


1. Introduction
The Schoenflies motion represents the end effector of a parallel manipulator (PM) with 3-DOF for translation and 1-DOF for rotation around a fixed axis [Reference Lee and Hervé1]. This type of manipulator finds wide applications in various industries, including packing, pick and place, and painting [Reference Richard, Gosselin and Kong2]. Over the past decades, numerous 3T1R (3-translation and 1-rotation) PMs have been discussed in the literature [Reference Guo, Ye, Qu, Zhang and Fang3–Reference Krut, Company, Nabat and Pierrot7]. Topology characteristic-based methods [Reference Yang, Liu, Shen and Hang8], constraint screw theory [Reference Kong and Gosselin9], and Lie group theory [Reference Angeles10] have been extensively applied in the type synthesis of 3T1R PMs. Depending on the rotation mode of the moving platform (MP), 3T1R PMs can be classified into the articulated MP type [Reference Krut, Company, Benoit, Ota and Pierrot5–Reference Krut, Company, Nabat and Pierrot7], the helical joint connected MP type [Reference Xu, Chen, He and Li11], and the single MP type [Reference Zhang, Dong, Dai, Chen and Zhao12]. Among these types, the 3T1R PM with a single MP stands out due to its simple structure and lightweight moving parts. However, most single MP 3T1R PMs have relatively limited regular workspaces when subjected to certain actuated joint stroke limitations, which restricts their applicability.
To address this limitation, we have proposed a 3T1R PM with the 2PPaRR-2PPaRU configuration in Ref. [Reference Zhang, Dong, Dai, Chen and Zhao12]. Compared with the existing 3T1R PM 2PRPaR-2PRPaU [Reference Liu and Wang13], the sequence of parallelogram (Pa) joints and revolute (R) joints in all four limbs is changed from R-Pa to Pa-R. This modification reduces the influence of driving joint stroke on the cross-sectional profile of the reachable workspace, thus resulting in a more regular workspace. However, symmetric 3T1R PMs based on Pa joints typically exhibit poor performance in their home configurations and often encounter architectural singularities, which limits their practical use. Two primary approaches exist to address architectural singularities in such PMs: adjusting the mechanism’s structural parameters [Reference Ma and Angeles14–Reference Salgado, Altuzarra, Amezua and Hernández18] or employing redundant actuation [Reference Yi, Kim, Kwak and Kim19]. While redundant actuation increases the complexity and control challenges, most current solutions rely on adjusting structural parameters. For instance, Angeles et al. [Reference Ma and Angeles14, Reference Ma and Angeles15] examined the influence of the shape and size of the Stewart PM’s MP on singularity and performance. Lou et al. [Reference Yang, Zhao, Xiong, Li and Lou16] mitigated the architectural singularity of the mechanism at its initial configuration by aligning the end revolute joints of the 2nd, 3rd, and 4th limbs. Kim et al. [Reference Kim, Kim and Yi17] eliminated the architectural singularity in the initial configuration by rearranging the limbs on the MP, while Salgado et al. [Reference Salgado, Altuzarra, Amezua and Hernández18] positioned the limbs on an asymmetric frame to avoid architectural singularity. However, most of these methods do not achieve rotational decoupling [Reference Ma and Angeles14, Reference Ma and Angeles15, Reference Kim, Kim and Yi17, Reference Salgado, Altuzarra, Amezua and Hernández18]. Based on the method in Ref. [Reference Yang, Zhao, Xiong, Li and Lou16], we present an improved 3T1R PM, termed 2PPaRR-2PPaRU, which features an analytical solution for forward kinematics. This enhanced 3T1R PM retains the benefits of the original mechanism, such as a regular workspace and a large rotational range. Moreover, it overcomes the architectural singularity at the initial configuration and achieves rotational decoupling, thereby simplifying kinematic analysis and enhancing mechanism control.
Performance analysis is crucial for evaluating the performance and optimizing parameters of PMs. Kinematic performance evaluation mainly includes dexterity [Reference Angeles and López-Cajún20], manipulability [Reference Stoughton and Arai21], and motion/force transmission index [Reference Wang, Wu and Liu22, Reference Chen, Xie and Liu23]. Compared with the Jacobian-based indexes [Reference Angeles and López-Cajún20, Reference Stoughton and Arai21], the motion/force transmission index [Reference Wang, Wu and Liu22, Reference Chen, Xie and Liu23] reflects the efficiency of energy transfer from inputs to outputs, a vital indicator of the manipulator’s operational performance. To ensure the optimized parameters meet the accuracy requirements in application scenes, such as seeding transplanting, pipe cultivation, packing etc., the stiffness model of the modified 3T1R PM is established through the virtual joint method (VJM) [Reference Gosselin and Zhang24–Reference Shen, Tang, Wu, Li, Li and Yang27]. The VSI [Reference Yan, Ong and Nee28] is applied to evaluate the stiffness performance.
The remainder of this paper is organized as follows: Section 2 introduces the modified 3T1R PM structure and presents the mobility analysis. In Section 3, the authors derive analytical solutions for the forward and inverse kinematics of the manipulator. Section 4 conducts a singularity analysis based on the Jacobian matrix of the mechanism. The motion/force transmission index is analyzed in Section 5. The stiffness model of the modified PM is established, and its stiffness performance is evaluated in Section 6. Section 7 presents parameter optimization based on the overall reachable workspace area (ORWA), the good transmission workspace (GTW) ratio (GTWR), and global stiffness index (GSI). Finally, Section 8 summarizes the paper.
2. Structure and mobility analysis
The original structure of the 4-DOF 3T1R PM 2PPaRR-2PPaRU [Reference Zhang, Dong, Dai, Chen and Zhao12] is depicted in Figure 1. In this configuration, the two PPaRU limbs (the 1st and 3rd limbs) and the two PPaRR limbs (the 2nd and 4th limbs) are symmetrically arranged on the base. The axes of the four prismatic (P) joints align with the
Z
-axis, while the movement direction of the Pa joints lies in the plane of the Pa joints and is perpendicular to the link
 $A_{i}B_{i}(i=1,2,3,4)$
. The axes of the revolute joints in limbs 2 and 4 run parallel to the
Y
-axis. Additionally, the axes of the revolute joints and the first revolute joints of the universal joints in limbs 1 and 3 are parallel to the
X
-axis, while the axes of the second revolute joints of the universal joints are parallel to the
Y
-axis. There are three translations at the end of the four limbs, one rotation around the
Y
-axis at the end of limbs 2 and 4, and two rotational motions with axes parallel to the
X
and
Y
axes at the end of limbs 1 and 3.
The original 2PPaRR-2PPaRU PM. (a) CAD model and (b) schematic representation.

Figure 1. Long description
Panel A: A CAD model of a parallel manipulator with a single moving platform. The model includes several joints and links connected to form a structure capable of translation and rotation. Panel B: A schematic representation of the parallel manipulator. The diagram shows a moving platform connected to a fixed base through various joints and links. The moving platform can translate in three dimensions and rotate around a fixed axis. The schematic includes labels for different joints and links, indicating their positions and connections.
Utilizing the constraint screw theory [Reference Huang and Li29], it is possible to determine the mobility and motion characteristics of the MP. However, the symmetric design based on Pa joints often leads to poor performance or even architectural singularity of the 3T1R PM at its home configuration. Additionally, the rotation of the MP is strongly coupled with limbs 2 and 4, increasing the complexity of kinematic analysis and control for the mechanism.
To address these issues, the authors have coaxially connected the end revolute joints of limbs 1, 3, and 4 to the MP. The geometric center of the revolute joint C
4 in limb 4 has been selected as the origin
 $o'$
of the moving coordinate system. Figure 2(a) presents a three-dimensional (3D) model of the improved 3T1R PM, while Figure 2(b) provides a schematic representation of the mechanism. Table I lists the structural parameters of the improved 2PPaRR-2PPaRU PM.
The improved 3T1R PM 2PPaRR-2PPaRU. (a) CAD model and (b) schematic representation.

The constraint screw theory [Reference Huang and Li29] is employed to analyze the mobility of the enhanced 2PPaRR-2PPaRU PM. The twist screw systems of limbs 1 and 2 can be expressed as follows:
 \begin{align} \begin{cases} \boldsymbol{\$}_{11}=\left(\boldsymbol{0};\,\boldsymbol{z}\right),\boldsymbol{\$}_{12}=\left(\boldsymbol{0};\,\boldsymbol{u}_{{a_{1}}{b_{1}}}\times \boldsymbol{y}\right)\\[3pt]\boldsymbol{\$}_{13}=\left(\boldsymbol{x};\,\boldsymbol{r}_{B1}\times \boldsymbol{x}\right),\boldsymbol{\$}_{14}=\left(\boldsymbol{x};\,\boldsymbol{r}_{C1}\times \boldsymbol{x}\right)\\[3pt]\boldsymbol{\$}_{15}=\left(\boldsymbol{y};\,\boldsymbol{r}_{C1}\times \boldsymbol{y}\right) \end{cases} \end{align}
and
 \begin{align} \begin{cases} \boldsymbol{\$}_{21}=\left(\boldsymbol{0};\,\boldsymbol{z}\right),\boldsymbol{\$}_{22}=\left(\boldsymbol{0};\,\boldsymbol{u}_{{a_{2}}{b_{2}}}\times \boldsymbol{x}\right)\\[3pt]\boldsymbol{\$}_{23}=\left(\boldsymbol{y};\,\boldsymbol{r}_{B2}\times \boldsymbol{y}\right),\boldsymbol{\$}_{24}=\left(\boldsymbol{y};\,\boldsymbol{r}_{C2}\times \boldsymbol{y}\right) \end{cases} \end{align}
where
 $\boldsymbol{x},\boldsymbol{y}$
and
 $\boldsymbol{z}$
denote the unit direction vectors of the
X
,
Y
and
Z
axes, respectively;
 $\boldsymbol{r}_{Bi}$
and
 $\boldsymbol{r}_{Ci}(i=1,2)$
denote the geometric centers of the joints, and
 $\boldsymbol{u}_{{a_{i}}{b_{i}}}$
and
 $\boldsymbol{u}_{{b_{i}}{c_{i}}}(i=1,2)$
represent the unit directional vectors of links
 $A_{i}B_{i}$
and
 $B_{i}C_{i}(i=1,2)$
. Based on the reciprocal relationship between the twist screw system and the wrench screw system, the constraint screw applied by limbs 1 and 2 can be determined as follows:
 \begin{align} \boldsymbol{\$}_{C11}=\left(0,0,0;\,0,0,1\right) \end{align}
and
 \begin{align} \begin{cases} \boldsymbol{\$}_{C21}=\left(0,0,0;\,0,0,1\right)\\[3pt]\boldsymbol{\$}_{C22}=\left(0,0,0;\,1,0,0\right) \end{cases} \end{align}
where the
 $\boldsymbol{\$}_{Cij}$
expresses the constraint wrench screw exerted on the MP by the limb i. Similarly, the constraint wrench screw systems of the limbs 3 and 4 can be written as:
 \begin{align} \boldsymbol{\$}_{C31}=\left(0,0,0;\,0,0,1\right) \end{align}
and
 \begin{align} \begin{cases} \boldsymbol{\$}_{C41}=\left(0,0,0;\,0,0,1\right)\\[3pt]\boldsymbol{\$}_{C42}=\left(0,0,0;\,1,0,0\right) \end{cases} \end{align}
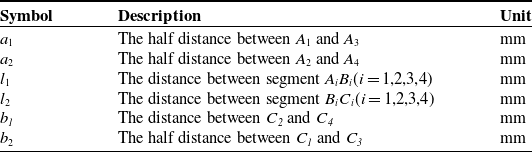
The structure parameters of the improved 2PPaRR-2PPaRU PM

Table I. Long description
A table with three columns and seven rows. The columns are labeled Symbol, Description, and Unit. The rows are as follows: Row 1: Symbol, a 1; Description, The half distance between A 1 and A 3; Unit, mm. Row 2: Symbol, a 2; Description, The half distance between A 2 and A 4; Unit, mm. Row 3: Symbol, l 1; Description, The distance between segment A B i (i = 1, 2, 3, 4); Unit, mm. Row 4: Symbol, l 2; Description, The distance between segment B C i (i = 1, 2, 3, 4); Unit, mm. Row 5: Symbol, b 1; Description, The distance between C 2 and C 4; Unit, mm. Row 6: Symbol, b 2; Description, The half distance between C 1 and C 3; Unit, mm.
Note that
 $\boldsymbol{\$}_{C11}=\boldsymbol{\$}_{C21}=\boldsymbol{\$}_{C31}=\boldsymbol{\$}_{C41}$
and
 $\boldsymbol{\$}_{C22}=\boldsymbol{\$}_{C42}$
, which means the 3T1R PM 2PPaRR-2PPaRU is an over-constrained system. The constraint wrench screw system of the 3T1R PM 2PPaRR-2PPaRU can be derived through Eqs. (3)–(6) as:
 \begin{align} \begin{cases} \boldsymbol{\$}_{C1}=\left(0,0,0;\,1,0,0\right)\\[3pt]\boldsymbol{\$}_{C2}=\left(0,0,0;\,0,0,1\right) \end{cases} \end{align}
Reusing the reciprocal screw theory, the twist screw system of the mechanism can be derived as:
 \begin{align} \begin{cases} \boldsymbol{\$}_{1}=\left(0,0,0;\,1,0,0\right)\\[3pt]\boldsymbol{\$}_{2}=\left(0,0,0;\,0,1,0\right)\\[3pt]\boldsymbol{\$}_{3}=\left(0,0,0;\,0,0,1\right)\\[3pt]\boldsymbol{\$}_{4}=\left(0,1,0;\,0,0,0\right) \end{cases} \end{align}
Eq. (8) indicates that the 2PPaRR-2PPaRU PM offers three translations and one rotation around the
Y
-axis. Figure 3(a) illustrates the MP after undergoing finite rotation about the
Y
-axis, while Figure 3(b) demonstrates the application of the 2PPaRR-2PPaRU PM in transplanting seedlings. When the 4-DOF PM performs seedling transplanting, the MP is parallel to the seedling tray, and the gripper on the MP grips the seedling; then the MP moves with the seedling. Subsequently, the orientation of the MP gradually becomes parallel to the transmission belt (
 $\phi =0$
). Once the MP reaches the fixed transplanting position, the gripper puts the seedling into the flowerpot. Compared with the 1-DOF and the 2-DOF seedling transplanting mechanisms, the 4-DOF PM 2PPaRR-2PPaRU has better flexibility and can realize more trajectories.
Mobility and application of the improved 3T1R PM. (a) rotation around the Y-axis and (b) application.

Figure 3. Long description
Panel A: A diagram of a parallel manipulator showing rotation around the Y-axis. The diagram includes labels for the X, Y, and Z axes, and annotation for rotation angle, φ. Panel B: A diagram of the application of the parallel manipulator in an industrial setting. The manipulator is shown with various components and structures, including a moving platform and actuated joints.
3. Position analysis
3.1. Inverse position analysis
Inverse position analysis aims to solve for the inputs of the driving joints
 $d_{i}\,(i=1,2,3,4)$
under the given position and orientation of the MP
 $(x,y,z,\phi )$
. Here,
 $d_{i}$
represents the displacement of each actuated joint along the
 $\boldsymbol{Z}$
-axis;
 $\phi$
is the rotation angle about the
 $\boldsymbol{Y}$
-axis, where clockwise rotation is defined as negative and counterclockwise as positive. As seen in Figure 2, from the origin
 $O$
of the global coordinate system to the geometric centers
 $C_{i}$
of the revolute joints, the closed-loop equation of limb i can be written as follows:
 \begin{align} \boldsymbol{O}\boldsymbol{C}_{i}=\boldsymbol{O}\boldsymbol{A}_{i}+\boldsymbol{A}_{i}\boldsymbol{B}_{i}+\boldsymbol{B}_{i}\boldsymbol{C}_{i} \end{align}
Projecting Eq. (9) along global coordinate axes
 $\boldsymbol{X},\boldsymbol{Y}$
and
 $\boldsymbol{Z}$
, the algebraic equation can be expressed as follows:
 \begin{align} \begin{cases} x=l_{1}\cos \theta _{11}\\ y-b_{2}=-a_{1}+l_{2}\cos \theta _{12}\\ z=d_{1}+l_{1}\sin \theta _{11}+l_{2}\sin \theta _{12} \end{cases} \\[-32pt] \nonumber \end{align}
 \begin{align} \begin{cases} x-b_{1}\cos \phi =-a_{2}+l_{2}\cos \theta _{22}\\ y=l_{1}\cos \theta _{21}\\ z+b_{1}\sin \phi =d_{2}+l_{1}\sin \theta _{21}+l_{2}\sin \theta _{22} \end{cases} \\[-32pt] \nonumber \end{align}
 \begin{align} \begin{cases} x=l_{1}\cos \theta _{31}\\ y+b_{2}=a_{1}-l_{2}\cos \theta _{32}\\ z=d_{3}+l_{1}\sin \theta _{31}+l_{2}\sin \theta _{32} \end{cases} \\[-32pt] \nonumber \end{align}
 \begin{align} \begin{cases} x=a_{2}-l_{2}\cos \theta _{42}\\ y=l_{1}\cos \theta _{41}\\ z=d_{4}+l_{1}\sin \theta _{41}+l_{2}\sin \theta _{42} \end{cases} \end{align}
where the intermediate variable
 $\theta _{i1}$
denotes the angle between link
 $A_{i}B_{i}$
and the negative direction of the
 $\boldsymbol{X}{-}$
axis for limbs i = 1, 3, or the angle between link
 $A_{i}B_{i}$
and the negative direction of the
 $\boldsymbol{Y}{-}$
axis for limbs i = 2, 4. Similarly,
 $\theta _{i2}$
is defined as the acute angle between link
 $B_{i}C_{i}$
and the
 $\boldsymbol{Y}{-}$
axis for i = 1, 3, and as the acute angle between link
 $B_{i}C_{i}$
and the
 $\boldsymbol{X}{-}$
axis for i = 2, 4.
By solving Eqs. (10)–(13), the inverse position results are as follows:
 \begin{align} \begin{cases} d_{1}=z-l_{1}\sin \theta _{11}-l_{2}\sin \theta _{12}\\[3pt]d_{2}=z+b_{1}\sin \phi -l_{1}\sin \theta _{21}-l_{2}\sin \theta _{22}\\[3pt]d_{3}=z-l_{1}\sin \theta _{31}-l_{2}\sin \theta _{32}\\[3pt]d_{4}=z-l_{1}\sin \theta _{41}-l_{2}\sin \theta _{42} \end{cases} \end{align}
where
 $\theta _{11}=a\cos \frac{x}{l_{1}},\theta _{12}=a\cos \frac{y-b_{2}+a_{1}}{l_{2}},\theta _{21}=a\cos \frac{y}{l_{1}},\theta _{22}=a\cos \frac{a_{2}+x-b_{1}\cos \phi }{l_{2}},\theta _{31}=a\cos \frac{x}{l_{1}},$
 $\theta _{32}=a\cos \frac{a_{1}-y-b_{2}}{l_{2}},\theta _{41}=a\cos \frac{y}{l_{1}},\theta _{42}=a\cos \frac{a_{2}-x}{l_{2}}$
.
3.2. Forward position analysis
In contrast to the inverse position analysis, forward position analysis involves solving for the position vector
 $(x,y,z,\phi )$
of the MP for the given inputs
 $d_{i}(i=1,2,3,4)$
. The position vectors of joints
 $B_{i}$
and
 $C_{i}$
in the fixed coordinate system are expressed as follows:
 \begin{align} \begin{cases} \boldsymbol{B}_{1}=\left(l_{1}\cos \theta _{11},-a_{1},d_{1}+l_{1}\sin \theta _{11}\right),\boldsymbol{C}_{1}=\left(x,y-b_{2},z\right)\\[3pt]\boldsymbol{B}_{2}=\left(-a_{2},l_{1}\cos \theta _{21},d_{2}+l_{1}\sin \theta _{21}\right),\boldsymbol{C}_{2}=\left(x-b_{1}\cos \phi, y,z+b_{1}\sin \phi \right)\\[3pt]\boldsymbol{B}_{3}=\left(l_{1}\cos \theta _{31},a_{1},d_{3}+l_{1}\sin \theta _{31}\right),\boldsymbol{C}_{3}=\left(x,y+b_{2},z\right)\\[3pt]\boldsymbol{B}_{4}=\left(a_{2},l_{1}\cos \theta _{41},d_{4}+l_{1}\sin \theta _{41}\right),\boldsymbol{C}_{4}=\left(x,y,z\right) \end{cases} \end{align}
According to the geometric constraints of the mechanism:
 \begin{align} \left| \boldsymbol{B}_{i}\boldsymbol{C}_{i}\right| =l_{2}\left(i=1,2,3,4\right) \end{align}
Combining Eqs. (15)–(16) leads to
 \begin{align} \begin{cases} \left(x-l_{1}\cos \theta _{11}\right)^{2}+\left(y-b_{2}+a_{1}\right)^{2}+\left(z-d_{1}-l_{1}\sin \theta _{11}\right)^{2}={l}_{2}^{2}\\[3pt]\left(x-b_{1}\cos \phi +a_{2}\right)^{2}+\left(y-l_{1}\cos \theta _{21}\right)^{2}+\left(z+b_{1}\sin \phi -d_{2}-l_{1}\sin \theta _{21}\right)^{2}={l}_{2}^{2}\\[3pt]\left(x-l_{1}\cos \theta _{31}\right)^{2}+\left(y+b_{2}-a_{1}\right)^{2}+\left(z-d_{3}-l_{1}\sin \theta _{31}\right)^{2}={l}_{2}^{2}\\[3pt]\left(x-a_{2}\right)^{2}+\left(y-l_{1}\cos \theta _{41}\right)^{2}+\left(z-d_{4}-l_{1}\sin \theta _{41}\right)^{2}={l}_{2}^{2} \end{cases} \end{align}
From Figure 2, we can obtain
 $\theta _{11}=\theta _{31},\theta _{21}=\theta _{41},x=l_{1}\cos \theta _{11},y=l_{1}\cos \theta _{21}$
; consequently, all the intermediate variables in Eq. (17) can be eliminated. Then the forward kinematic solutions can be derived as:
 \begin{align} \begin{cases} x=\left(2a_{2}E_{1}-\sqrt{4{a}_{2}^{2}{E}_{2}^{2}{l}_{1}^{2}-{E}_{1}^{2}{E}_{2}^{2}+{E}_{2}^{4}{l}_{1}^{2}}\right)/\left(4{a}_{2}^{2}+{E}_{2}^{2}\right)\\[3pt]y=\left({d}_{1}^{2}-{d}_{3}^{2}+2M_{4}\left(d_{3}-d_{1}\right)\right)/\left(4\left(b_{2}-a_{1}\right)\right),z=M_{4}+\sqrt{{l}_{1}^{2}-x^{2}}\\[3pt]\phi =2a\tan \left(\left(K_{2}-\sqrt{{K}_{2}^{2}-{K}_{3}^{2}+{K}_{1}^{2}}\right)/\left(K_{1}+K_{3}\right)\right) \end{cases} \end{align}
The intermediate variables in the Eq. (18) are as follows:
 $M_{1}=4((d_{3}-d_{1})^{2}+4(b_{2}-a_{1})^{2}),$
 \begin{align*} M_{2}&=4\left(d_{3}-d_{1}\right)\left({d}_{1}^{2}-{d}_{3}^{2}\right)-16\left(b_{2}-a_{1}\right)^{2}\left(d_{3}+d_{1}\right),M_{4}=\left(-M_{2}+\sqrt{{M}_{2}^{2}-4M_{1}M_{3}}\right)/\left(2M_{1}\right),\\[3pt]K_{2}&=2b_{1}\left(z-d_{2}-\sqrt{{l}_{1}^{2}-y^{2}}\right)\!, M_{3}=\left(\left({d}_{1}^{2}-{d}_{3}^{2}\right)+4\left(b_{2}-a_{1}\right)^{2}\right)^{2}-16{l}_{2}^{2}\left(b_{2}-a_{1}\right)^{2}+16{d}_{3}^{2}\left(b_{2}-a_{1}\right)^{2},\\[3pt]K_{3}&={l}_{2}^{2}-\left(x+a_{2}\right)^{2}-{b}_{1}^{2}-\left(z-d_{2}-\sqrt{{l}_{1}^{2}-y^{2}}\right)^{2}\!, E_{2}=2\left(d_{4}+\sqrt{{l}_{1}^{2}-y^{2}}\right)-2M_{4},K_{1}=-2\left(x+a_{2}\right)b_{1},\\[3pt]E_{1}&={a}_{2}^{2}+{M}_{4}^{2}+{l}_{1}^{2}-2M_{4}\left(d_{4}+\sqrt{{l}_{1}^{2}-y^{2}}\right)+\left(d_{4}+\sqrt{{l}_{1}^{2}-y^{2}}\right)^{2}-{l}_{2}^{2}.\end{align*}
3.3. Calculation example of forward and inverse position solutions
The structural dimensions are given as
 $a_{1}=a_{2}=306,l_{1}=308,l_{2}=342,b_{1}=110,b_{2}=90$
(unit: mm), and the initial pose of the MP is set to
 $(x_{0},y_{0},z_{0},\varphi )=(29.765,23.481,758.559,0)$
. With the driving function in Eq. (19) applied at the preset pose of the MP, the theoretical solutions derived from Eq. (14) and the corresponding Adams simulation results are shown in Figure 4. Meanwhile, by inputting the corresponding data of the driving joints into Adams, the simulation curves of the pose of the MP in Adams and the theoretical solutions obtained via Eq. (18) are presented in Figure 5. Figures 4 and 5 show that the theoretical curves of the driving joints and the MP are almost the same as the corresponding simulation curves in Adams, which verifies the correctness of the kinematic analytical solutions of the improved 3T1R PM.
Comparison of the driving joint displacements from theoretical and simulation results (a) d2, d3, and d4 and (b) d1.

Comparison between theoretical and simulated MP pose (a) x, y, and
 $\phi$
and (b) z.

Figure 5. Long description
Panel A: A line graph shows the displacement in millimeters of a manipulator pose in the x and y directions over time in seconds. The x-axis represents time in seconds, ranging from 0 to 8 seconds. The y-axis represents displacement in millimeters, ranging from -10 to 80 millimeters. The graph includes multiple lines representing theoretical and simulated values for x, y, and phi directions. The theoretical values for x and y are marked with blue stars and red crosses, respectively, while the simulated values are shown with blue and red lines. The phi values are marked with green stars and lines. The graph shows oscillatory behavior for x and y directions, while the phi values remain constant. Panel B: Another line graph shows the displacement in millimeters of a manipulator pose in the z direction over time in seconds. The x-axis represents time in seconds, ranging from 0 to 8 seconds. The y-axis represents displacement in millimeters, ranging from 758 to 776 millimeters. The graph includes two lines representing theoretical and simulated values for the z direction. The theoretical values are marked with orange crosses, and the simulated values are shown with an orange line. The graph shows a linear increase in displacement over time.
 \begin{align} \begin{cases} x=x_{0}+24\sin \left(2.5t\right),y=y_{0}+24-24\cos \left(2.5t\right)\\[3pt]z=z_{0}+\dfrac{12.5t}{2\pi },\varphi =0 \end{cases} \end{align}
4. Velocity and singularity analysis
4.1. Velocity analysis
Velocity analysis is the basis of the singularity analysis. By differentiating both sides of Eq. (14), we can derive the mapping between the input velocity
 $\,\dot{\!d}_{i}(i=1,2,3,4)$
and the output velocity
 $(\dot{x},\dot{y},\dot{z},\dot{\phi })$
. To date, numerous studies have investigated the Jacobian matrix of the mechanism in detail, such as Ref. [Reference Dong, Sun, Song, Gao and Lian30–Reference Yuan and Zhang32]. Therefore, the derivation of the Jacobian matrix is omitted here. The derived Jacobian matrix can be expressed as follows:
 \begin{align} \boldsymbol{J}_{d}\,\,\dot{\!\boldsymbol{d}}=\boldsymbol{J}_{X}\,\dot{\!\boldsymbol{X}} \end{align}
The
 $\boldsymbol{J}_{d}$
and
 $\boldsymbol{J}_{X}$
are the inverse Jacobian matrix and the forward Jacobian matrix, respectively, and are given as follows:
 \begin{align} \boldsymbol{J}_{d}=\left[\begin{array}{c@{\quad}c@{\quad}c@{\quad}c} J_{d11} & 0 & 0 & 0\\[3pt]0 & J_{d22} & 0 & 0\\[3pt]0 & 0 & J_{d33} & 0\\[3pt]0 & 0 & 0 & J_{d44} \end{array}\right] \\[-28pt] \nonumber \end{align}
 \begin{align} \boldsymbol{J}_{X}=\left[\begin{array}{l@{\quad}l@{\quad}l@{\quad}l} J_{X11} & J_{X12} & J_{X13} & J_{X14}\\[3pt]J_{X21} & J_{X22} & J_{X23} & J_{X24}\\[3pt]J_{X31} & J_{X32} & J_{X33} & J_{X34}\\[3pt]J_{X41} & J_{X42} & J_{X43} & J_{X44} \end{array}\right] \end{align}
where
 $ J_{d11}=\sin \theta _{11}\sin \theta _{12},J_{d22}=\sin \theta _{21}\sin \theta _{22},J_{d33}=\sin \theta _{31}\sin \theta _{32},J_{d44}=\sin \theta _{41}\sin \theta _{42},$
 $ J_{X11}=\cos \theta _{11}\sin \theta _{12},J_{X12}=\cos \theta _{12}\sin \theta _{11},J_{X13}=\sin \theta _{11}\sin \theta _{12},J_{X14}=0,J_{X21}=\sin \theta _{21}\cos \theta _{22},$
 $J_{X22}=\cos \theta _{21}\sin \theta _{22},J_{X23}=\sin \theta _{21}\sin \theta _{22},J_{X31}=\cos \theta _{31}\sin \theta _{32},J_{X32}=-\cos \theta _{32}\sin \theta _{31},$
 $ J_{X34}=0,J_{X24}=\left(b_{1}\cos \phi \sin \theta _{21}\sin \theta _{22}+b_{1}\sin \phi \sin \theta _{21}\cos \theta _{22}\right),J_{X33}=\sin \theta _{31}\sin \theta _{32},$
 $ J_{X41}=-\cos \theta _{42}\sin \theta _{41},J_{X42}=\cos \theta _{41}\sin \theta _{42},J_{X43}=\sin \theta _{41}\sin \theta _{42},J_{X44}=0$
When
 $| \boldsymbol{J}_{d}| \neq 0$
, the Jacobian matrix for the improved PM 2PPaRR-2PPaRU equals
 \begin{align} \boldsymbol{J}={\boldsymbol{J}}_{d}^{-1}\boldsymbol{J}_{X} \end{align}
4.2. Singularity analysis
Singularity is an inherent property of the PMs. It significantly affects the PM’s performance, especially near its singular configuration, potentially causing damage to equipment. In this section, we will examine inverse kinematic singularity, forward kinematic singularity, and combined kinematic singularity [Reference Gosselin and Angeles33].
4.2.1. Inverse kinematics singularity
Inverse kinematic singularity may arise when the MP is at the workspace boundary. In such a configuration, the MP loses one or more DOFs. When this occurs,
 $| \boldsymbol{J}_{d}| =0$
and
 $| \boldsymbol{J}_{x}| \neq 0$
. Since
 $\boldsymbol{J}_{d}$
is a diagonal matrix, it is easy to obtain
 $| \boldsymbol{J}_{d}| =0$
when
 $\sin \theta _{i1}\sin \theta _{i2}=0\,(i=1,2,3,4)$
. To avoid interference between the links, the following constraints should be satisfied:
 \begin{align} \begin{cases} 30^{\circ }\leq \theta _{i1}\leq 150^{\circ }\\[3pt]0\leq \theta _{i2}\lt 90^{\circ } \end{cases} \end{align}
From Eq. (24), the four situations can be found as follows:
 \begin{align} \theta _{i2}=0\left(i=1,2,3,4\right) \end{align}
In these situations, links
 $B_{i}C_{i}(i=1,2,3,4)$
and the MP are coplanar and parallel with the XOY plan when
 $\theta _{i2}=0$
; meanwhile, the MP lies on the boundary of its workspace. The four inverse kinematic singular configurations are presented in Figure 6.
The inverse kinematic singularity configurations (a)
 $\theta _{12}=0$
, (b)
 $\theta _{22}=0$
, (c)
 $\theta _{32}=0$
, and (d)
 $\theta _{42}=0$
.

4.2.2. Forward kinematics singularity
A forward kinematic singularity, also known as a parallel singularity, occurs within the workspace. In such configurations, the MP undergoes infinitesimal motion in certain directions while the driving joints remain fixed, which implies that the MP obtains extra DOFs. The forward kinematic singularity occurs when
 $| \boldsymbol{J}_{d}| \neq 0$
and
 $| \boldsymbol{J}_{X}| =0$
. According to Eq. (22),
 $\det (\boldsymbol{J}_{X})=-b_{1}\sin \theta _{11}\sin \theta _{21}\sin \theta _{41}\sin (\phi +\theta _{22})\sin (\theta _{12}+\theta _{32})\sin (\theta _{42}+\theta _{31})$
can be obtained, the physical constraint is same as Eq. (24).
It can be obtained
 $b_{1},\sin \theta _{11},\sin \theta _{21}$
and
 $\sin \theta _{41}$
are not equal to 0. According to the forward kinematic singularity condition
 $| \boldsymbol{J}_{d}| \neq 0\boldsymbol{,}\ | \boldsymbol{J}_{X}| =0$
and Eq. (24), it can be easily derived that
 $\sin (\theta _{12}+\theta _{32})\neq 0$
. Thus,
 $| \boldsymbol{J}_{X}| =0$
is equal to:
 \begin{align} \sin \left(\theta _{42}+\theta _{31}\right)=0\text{ or }\sin \left(\phi +\theta _{22}\right)=0 \end{align}
When
 $\sin (\theta _{42}+\theta _{31})=0$
, combined with the physical constraint
 $x_{C3}=x_{C4}$
(where
 $x_{C3}$
and
 $x_{C4}$
are the projections of the geometric centers of revolute joints C
3 and C
4 onto the
X
-axis), the following equation can be obtained:
 \begin{align} \begin{cases} \theta _{31}+\theta _{42}=\pi \\[3pt]l_{1}\cos \theta _{31}=a_{2}-l_{2}\cos \theta _{42} \end{cases} \end{align}
It can be derived from Eq. (27) that
 $\theta _{42}=a\cos (a_{2}/(l_{2}-l_{1}))$
, which means
 $l_{2}-l_{1}\gt a_{2}$
. This will lead to an excessively long link
 $B_{i}C_{i}\,(i=1,2,3,4)$
, reducing the PM’s stiffness and rendering it impractical for control. When
 $\sin (\theta _{22}+\phi )=0$
, it can be derived that
 $\phi =-\theta _{22}$
. In this singular configuration, the axis of link B
2
C
2 is coplanar with the MP. Figure 7 presents one of the singular configurations associated with forward kinematics.
The forward kinematic singularity configuration
 $\theta _{22}=-\phi$
.

Figure 7. Long description
A diagram of a parallel manipulator. The diagram shows a structure with multiple vertical columns connected by horizontal and diagonal links. The vertical columns are labeled with black tops and have orange connectors at the bottom. The horizontal and diagonal links are connected to a central moving platform. The central moving platform is connected to the vertical columns via orange connectors. The diagram includes labels for the Y-axis, points B2 and C2, and angles theta22 and phi. The Y-axis is shown as a red arrow pointing horizontally. B2 and C2 are the geometric centers of the corresponding joints. theta22 and phi are the angles corresponding to link B2C2 and the moving platform (MP), respectively. The diagram illustrates the motion and rotation capabilities of the parallel manipulator.
4.2.3. Combined kinematic singularity
In the combined kinematic singular configurations of the mechanism, the MP can move in one or several directions when the actuated joints are locked. Conversely, when the MP is constrained, the actuated joints can undergo finite motion. The corresponding conditions are
 $| \boldsymbol{J}_{d}| =0$
and
 $| \boldsymbol{J}_{X}| =0$
. Based on the analysis in Sections 4.2.1 and 4.2.2, three types of combined singular configurations can be identified, as shown in Figure 8.
Combined kinematic singular configurations (a)
 $\theta _{22}=-\phi$
and
 $\theta _{12}=0$
, (b)
 $\theta _{22}=-\phi$
and
 $\theta _{32}=0$
, and (c)
 $\theta _{22}=-\phi$
and
 $\theta _{42}=0$
.

5. Motion/force transmission analysis and parameter optimization
5.1. Local motion/force transmission analysis
Liu et al. [Reference Wang, Wu and Liu22, Reference Chen, Xie and Liu23] proposed the local transmission index (LTI) based on the transmission angle theory [Reference Balli and Chand34]. The transmission index reflects the energy transfer efficiency of the PM. The closer the transmission index is to unity, the higher the transmission efficiency. The LTI can be defined as follows:
 \begin{align} \begin{cases} \mathrm{ITI}_{i}=\dfrac{\left| \boldsymbol{\$}_{i1}\circ \boldsymbol{\$}_{Ti}\right| }{\left| \boldsymbol{\$}_{i1}\circ \boldsymbol{\$}_{Ti}\right| _{\max }}\\[8pt]\mathrm{OTI}_{i}=\dfrac{\left| \boldsymbol{\$}_{oi}\circ \boldsymbol{\$}_{Ti}\right| }{\left| \boldsymbol{\$}_{oi}\circ \boldsymbol{\$}_{Ti}\right| _{\max }}\\[8pt]\mathrm{LTI}=\min \left\{\mathrm{ITI}_{i},\mathrm{OTI}_{i}\right\} \end{cases} \end{align}
where
 $\boldsymbol{\$}_{i1},\boldsymbol{\$}_{Ti}$
and
 $\boldsymbol{\$}_{Oi}$
denote the input twist screw, transmission wrench screw and the output twist screw of the limb i, respectively.
 $\mathrm{ITI}_{i},\mathrm{OTI}_{i}$
and LTI represent the input transmission index, output transmission index, and the minimum value of all the input and output transmission index, that is, the LTI of the PM. LTI ranges from zero to unity, and a higher LTI indicates better transmissibility.
Fixing
 $\boldsymbol{\$}_{i1}$
(the input twist screw), the newly added constraint wrench screw represents the transmission wrench screw of limb i. According to the reciprocity between the twist screw system and the wrench screw system [Reference Dai and Jones35], we can obtain the transmission wrench screws in limbs 1, 2, 3, and 4 as follows (see Appendix A):
 \begin{align} \begin{cases} \boldsymbol{\$}_{T1}=\left(l_{11},m_{1},n_{1};\,p_{1},q_{1},r_{1}\right)\\[3pt]\boldsymbol{\$}_{T2}=\left(l_{21},m_{2},n_{2};\,p_{2},q_{2},r_{2}\right)\\[3pt]\boldsymbol{\$}_{T3}=\left(l_{31},m_{3},n_{3};\,p_{3},q_{3},r_{3}\right)\\[3pt]\boldsymbol{\$}_{T4}=\left(l_{41},m_{4},n_{4};\,p_{4},q_{4},r_{4}\right) \end{cases} \end{align}
With the input joint in limb i actuated and the input joints in the other three limbs fixed, the unit twist screw of the MP is equivalent to the output twist screw of that limb. According to the reciprocity between the twist screw
 $\boldsymbol{\$}_{Oi}(i=1\sim 4)$
and the wrench screw
 $\boldsymbol{\$}_{Ci},\boldsymbol{\$}_{Tk}(i=1,2;\,k=1\sim 4)$
:
 \begin{align} \boldsymbol{\$}_{Oi}\circ \boldsymbol{\$}_{Ci}=0,\boldsymbol{\$}_{Oi}\circ \boldsymbol{\$}_{Tk}=0\left(i\neq k\right) \end{align}
The PM’s output twist screws can be determined. As indicated by the analysis in Ref. [Reference Zhang, Dong, Dai, Chen and Zhao12], it is evident that the cross-section profile of the mechanism’s reachable workspace remains consistent at different heights when the orientation of the MP is fixed, without accounting for the limitations of actuated displacements. Therefore, this section focuses on analyzing the distribution of LTI within the cross-section of the workspace at a specific operating height (Z = 1,000 mm). Given that the 3T1R PM is primarily used in light-load scenarios, the configuration of the improved 3T1R PM is picked into GTW when
 $\mathrm{LTI}\geq 0.5$
. The structural parameters remain consistent with those in Section 3.3. The LTI distribution across the reachable workspace under various orientations is symmetrical about the
X
-axis, as depicted in Figure 9, aligning with the symmetry of the mechanism architecture about the
X
-axis. Compared to the LTI distribution of the original design in Ref. [Reference Zhang, Dong, Dai, Chen and Zhao12], the region with poor transmission performance is deviated from the home configuration.
LTI distribution (a)
 $\phi =-45^{\circ }$
, (b)
 $\phi =0$
, (c)
 $\phi =45^{\circ }$
, (d)
 $\phi =-90^{\circ }$
, and (e)
 $\phi =90^{\circ }$
.

Figure 9. Long description
Panel A: A heat map representing LTI distribution with a gradient from blue to red. The x-axis ranges from -35 to 110 millimeters, and the y-axis ranges from -125 to 125 millimeters. The color scale on the right indicates values from 0.05 to 0.35, with red representing higher values and blue representing lower values. The distribution shows a concentrated region of higher values around the center-right. Panel B: A heat map representing LTI distribution with a gradient from blue to red. The x-axis ranges from -35 to 145 millimeters, and the y-axis ranges from -125 to 125 millimeters. The color scale on the right indicates values from 0 to 0.6, with red representing higher values and blue representing lower values. The distribution shows a concentrated region of higher values around the center, with a labeled region indicating LTI values greater than or equal to 0.5. Panel C: A heat map representing LTI distribution with a gradient from blue to red. The x-axis ranges from -35 to 110 millimeters, and the y-axis ranges from -125 to 125 millimeters. The color scale on the right indicates values from 0.1 to 0.6, with red representing higher values and blue representing lower values. The distribution shows a concentrated region of higher values around the center. Panel D: A heat map representing LTI distribution with a gradient from blue to red. The x-axis ranges from -35 to 35 millimeters, and the y-axis ranges from -125 to 125 millimeters. The color scale on the right indicates values from 0.1 to 0.4, with red representing higher values and blue representing lower values. The distribution shows a concentrated region of higher values around the center. Panel E: A heat map representing LTI distribution with a gradient from blue to red. The x-axis ranges from -35 to 35 millimeters, and the y-axis ranges from -125 to 125 millimeters. The color scale on the right indicates values from 0.1 to 0.4, with red representing higher values and blue representing lower values. The distribution shows a concentrated region of higher values around the center.
5.2. Overall good transmission workspace analysis
To provide an overall measure of the good transmission region within the entire reachable workspace, the GTWR [Reference Xie, Liu, Wang and Wang36] is defined as follows:
 \begin{align} \Gamma =\frac{\int \gamma d\mathrm{s}}{\int ds} \end{align}
Here,
 $\gamma$
refers to the point in the GTW,
 $\int \gamma ds$
refers to the set of
 $\gamma$
in the overall reachable workspace and
 $\int ds$
refers to the total discrete points in the reachable workspace. The overall reachable workspace comprises the cross-sections obtained under various orientations at the operating height Z = 1,000 mm. Clearly,
 $\Gamma$
ranges from 0 to 1, with higher values indicating better global transmission performance. In Figure 9, the 3T1R PM exhibits GTW only when the orientation of the MP equals 0 and 45°, resulting in GTWR values of 0.223 and 0.239, respectively.
6. Stiffness analysis of the 2PPaRR-2PPaRU PM
The stiffness performance reflects the ability of a PM to resist deflection under external loads, which is a crucial index for evaluating the accuracy of the PM. In this section, the VJM [Reference Gosselin and Zhang24–Reference Shen, Tang, Wu, Li, Li and Yang27] is applied to derive the stiffness model of the 2PPaRR-2PPaRU PM. The stiffness of the actuators, parallelogram links, and
 $B_{i}C_{i}(i=1,2,3,4)$
links, together with the deflections of the passive joints, is taken into account.
6.1. Stiffness matrix of the parallelogram
Since the links are slender and flexible, they can be modeled as cantilever beams in the stiffness analysis. Based on the Euler–Bernoulli equation [Reference Filipovic37], the stiffness matrix of a link can be derived as:
 \begin{align} \boldsymbol{K}_{bar}=\left[\begin{array}{c@{\quad}c@{\quad}c@{\quad}c@{\quad}c@{\quad}c} k_{11} & 0 & 0 & 0 & 0 & 0\\[3pt]0 & k_{22} & 0 & 0 & 0 & k_{26}\\[3pt]0 & 0 & k_{33} & 0 & k_{35} & 0\\[3pt]0 & 0 & 0 & k_{44} & 0 & 0\\[3pt]0 & 0 & k_{53} & 0 & k_{55} & 0\\[3pt]0 & k_{62} & 0 & 0 & 0 & k_{66} \end{array}\right] \end{align}
where
 $k_{11}=GI_{x}/l_{i},\ k_{22}=4EI_{y}/l_{i},\ k_{33}=4EI_{z}/l_{i},\ k_{44}=EA/l_{i},\ k_{55}=12EI_{z}/{l}_{i}^{3},\ k_{66}=12EI_{y}/{l}_{i}^{3}, k_{26}=k_{62}=6EI_{y}/{l}_{i}^{2}, k_{35}=k_{53}=-6EI_{z}/{l}_{i}^{2}$
. The
 $l_{i}$
is the link length,
 $A,\ E$
and
 $G$
are the cross-section area, the Young’s and shear modules of the link,
 $I_{y},I_{z}$
and
 $I_{x}$
are the quadratic and polar moments of inertia of the cross section, respectively.
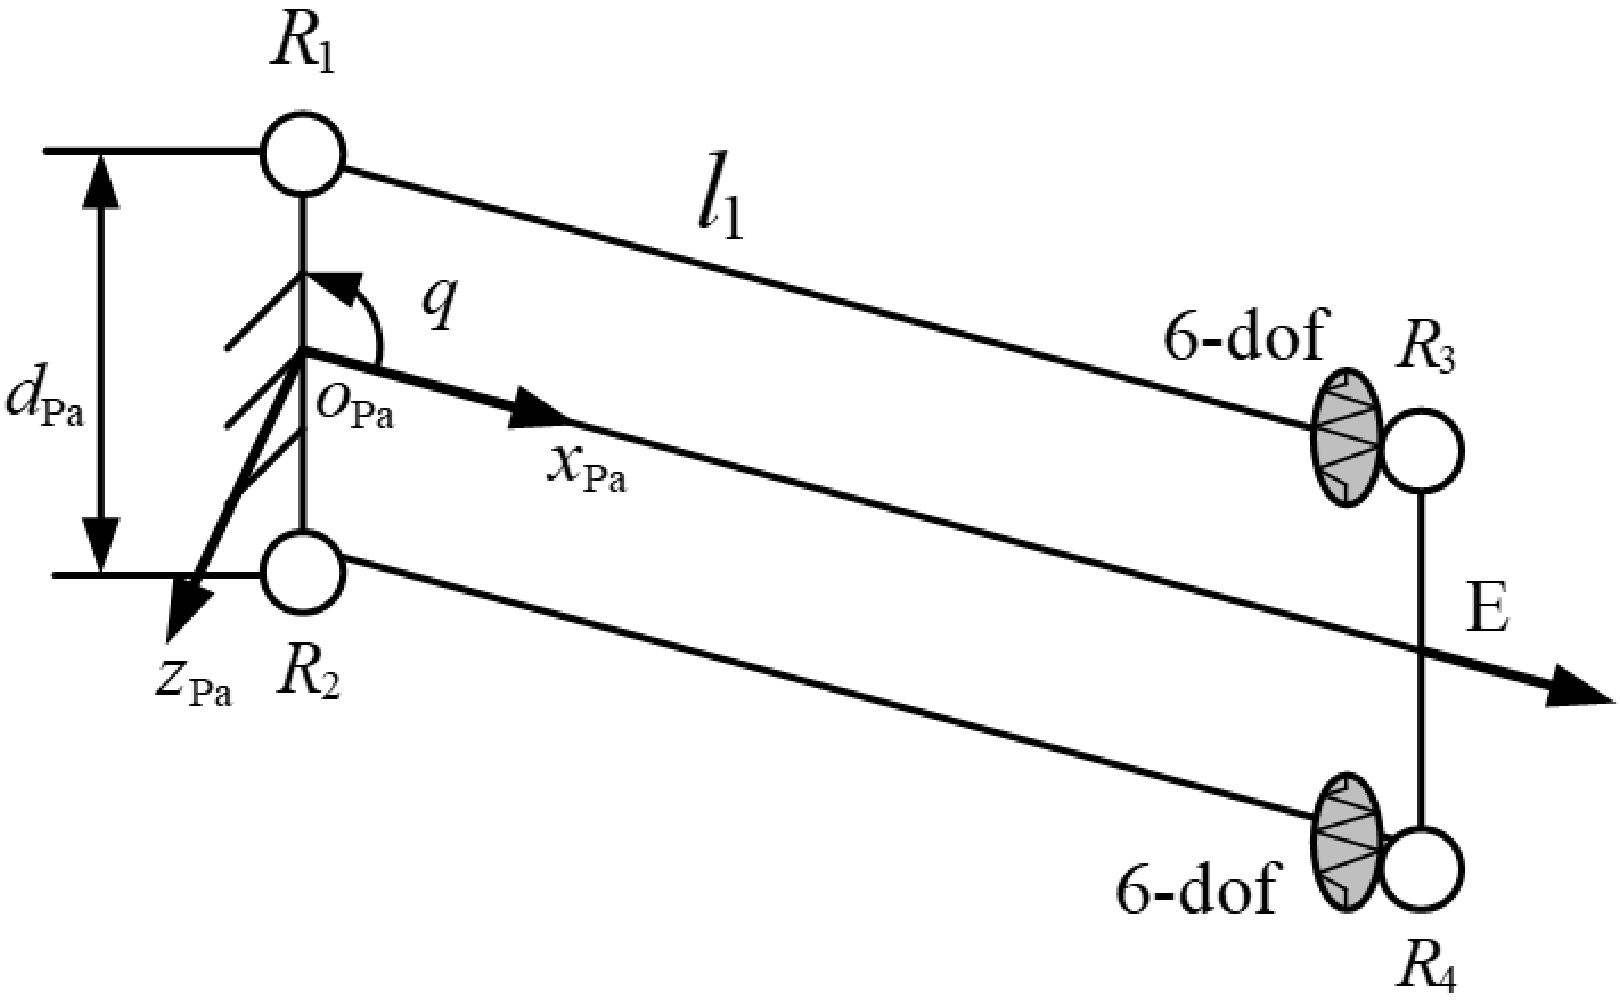
The virtual spring model of the parallelogram structure is shown in Figure 10. The elastic deformations of the upper link are equivalent to the elastic deformations of the virtual spring at the end of the link, and the motion of the passive joints R1, R3 is considered. The elastic deformation
 $\delta \boldsymbol{t}^{up}$
of the end of the upper limb equals:
 \begin{align} \delta \boldsymbol{t}^{up}={\boldsymbol{J}}_{\Pi }^{\theta }\delta \boldsymbol{\theta }_{\Pi }+{\boldsymbol{J}}_{\varphi }^{up}\delta \boldsymbol{q}_{\Pi } \end{align}
where
 ${\boldsymbol{J}}_{\Pi }^{\theta }$
is the Jacobian matrix that corresponds to the deflection
 $\delta \boldsymbol{\theta }_{\Pi }$
of the upper link, and
 ${\boldsymbol{J}}_{\varphi }^{up}$
is the Jacobian matrix that corresponds to the motion of the passive revolute joints
 $\delta \boldsymbol{q}_{\Pi }$
. The
 ${\boldsymbol{J}}_{\Pi }^{\theta }$
and
 ${\boldsymbol{J}}_{\varphi }^{up}$
are expressed as:
 \begin{align} {\boldsymbol{J}}_{\Pi }^{\theta }=\left[\begin{array}{c@{\quad}c@{\quad}c@{\quad}c@{\quad}c@{\quad}c} 1 & 0 & 0 & 0 & 0 & 0\\[3pt]0 & 1 & 0 & 0 & 0 & 0\\[3pt]0 & 0 & 1 & 0 & 0 & 0\\[3pt]0 & dSq/2 & 0 & 1 & 0 & 0\\[3pt]-dSq/2 & 0 & -L-dCq/2 & 0 & 1 & 0\\[3pt]0 & L+dCq/2 & 0 & 0 & 0 & 1 \end{array}\right],\ {\boldsymbol{J}}_{\varphi }^{up}=\left[\begin{array}{c@{\quad}c} 0 & 0\\[3pt]1 & 1\\[3pt]0 & 0\\[3pt]dSq/2 & dSq/2\\[3pt]0 & 0\\[3pt]dCq/2 & L+dCq/2 \end{array}\right] \end{align}
where
 $Sq=\sin q,Cq=\cos q$
. According to the static equilibrium equation [Reference Pashkevich, Chablat and Wenger25]:
 \begin{align} \left[\begin{array}{c@{\quad}c} {\boldsymbol{J}}_{\Pi }^{\theta }{\boldsymbol{K}}_{bar}^{-1}{\boldsymbol{J}}_{\Pi }^{\theta ^{T}} & {\boldsymbol{J}}_{\varphi }^{up}\\[6pt] {\boldsymbol{J}}_{\varphi }^{up^{T}} & \boldsymbol{0}_{2\times 2} \end{array}\right]\left[\begin{array}{l} \boldsymbol{f}_{up}\\[3pt] \delta \boldsymbol{\varphi }^{up} \end{array}\right]=\left[\begin{array}{l} \delta \boldsymbol{t}^{up}\\[3pt] \boldsymbol{0}_{n\times n} \end{array}\right] \end{align}
The stiffness matrix of the upper limb is:
 \begin{align} {\boldsymbol{K}}_{\Pi }^{up}=\left[\begin{array}{c@{\quad}c} {\boldsymbol{J}}_{\Pi }^{\theta }{\boldsymbol{K}}_{bar}^{-1}\left({\boldsymbol{J}}_{\Pi }^{\theta }\right)^{T} & {\boldsymbol{J}}_{\varphi }^{up}\\[6pt] \left({\boldsymbol{J}}_{\varphi }^{up}\right)^{T} & \boldsymbol{0}_{2\times 2} \end{array}\right]^{-1} \end{align}
The virtual spring model of the parallelogram.

The stiffness matrix
 ${\boldsymbol{K}}_{\Pi }^{up}$
of the upper limb is the first six-dimensional entry extracted from Eq. (36). Due to the passive joints’ motion compensation, the translational stiffness along the
 $z_{Pa}-$
axis vanishes, and the stiffness matrix of the parallelogram structure can be represented by the first 5-dimensional submatrix as follows:
 \begin{align} {\boldsymbol{K}}_{\Pi }^{up}=\left[\begin{array}{c@{\quad}c@{\quad}c@{\quad}c@{\quad}c} k_{11}+k_{55}d^{2}{S}_{q}^{2}/4 & 0 & k_{55}d^{2}S_{2q}/8 & 0 & 0\\[3pt] 0 & k_{44}d^{2}{S}_{q}^{2}/4 & 0 & 0 & 0\\[3pt] k_{55}d^{2}S_{2q}/8 & 0 & k_{33}+k_{55}d^{2}{C}_{q}^{2}/4 & 0 & k_{35}\\[3pt] 0 & 0 & 0 & k_{44} & 0\\[3pt] 0 & 0 & k_{35} & 0 & k_{55} \end{array}\right]_{5\times 5} \end{align}
where
 $k_{ij}$
denotes the
 $(\text{\em i}\mathit{,}\text{\em j})$
entry of the matrix
 ${\boldsymbol{K}}_{\Pi }^{up}$
. Similarly, the stiffness matrix of the lower limb can be obtained. The overall stiffness matrix of the parallelogram structure equals:
 \begin{align} \boldsymbol{K}_{\Pi }={\boldsymbol{K}}_{\Pi }^{up}+{\boldsymbol{K}}_{\Pi }^{down}=2{\boldsymbol{K}}_{\Pi }^{up} \end{align}
6.2. Stiffness modeling of the PM
The 3T1R PM 2PPaRR-2PPaRU consists of two PPaRR limbs and two PPaRU limbs. Before establishing the stiffness matrix of the PM, the stiffness matrices of the two different types of limbs should be built first. The stiffness matrix of the PM is equivalent to the sum of the stiffness matrices of all four limbs.
6.2.1. Stiffness modeling of the PPaRU limb
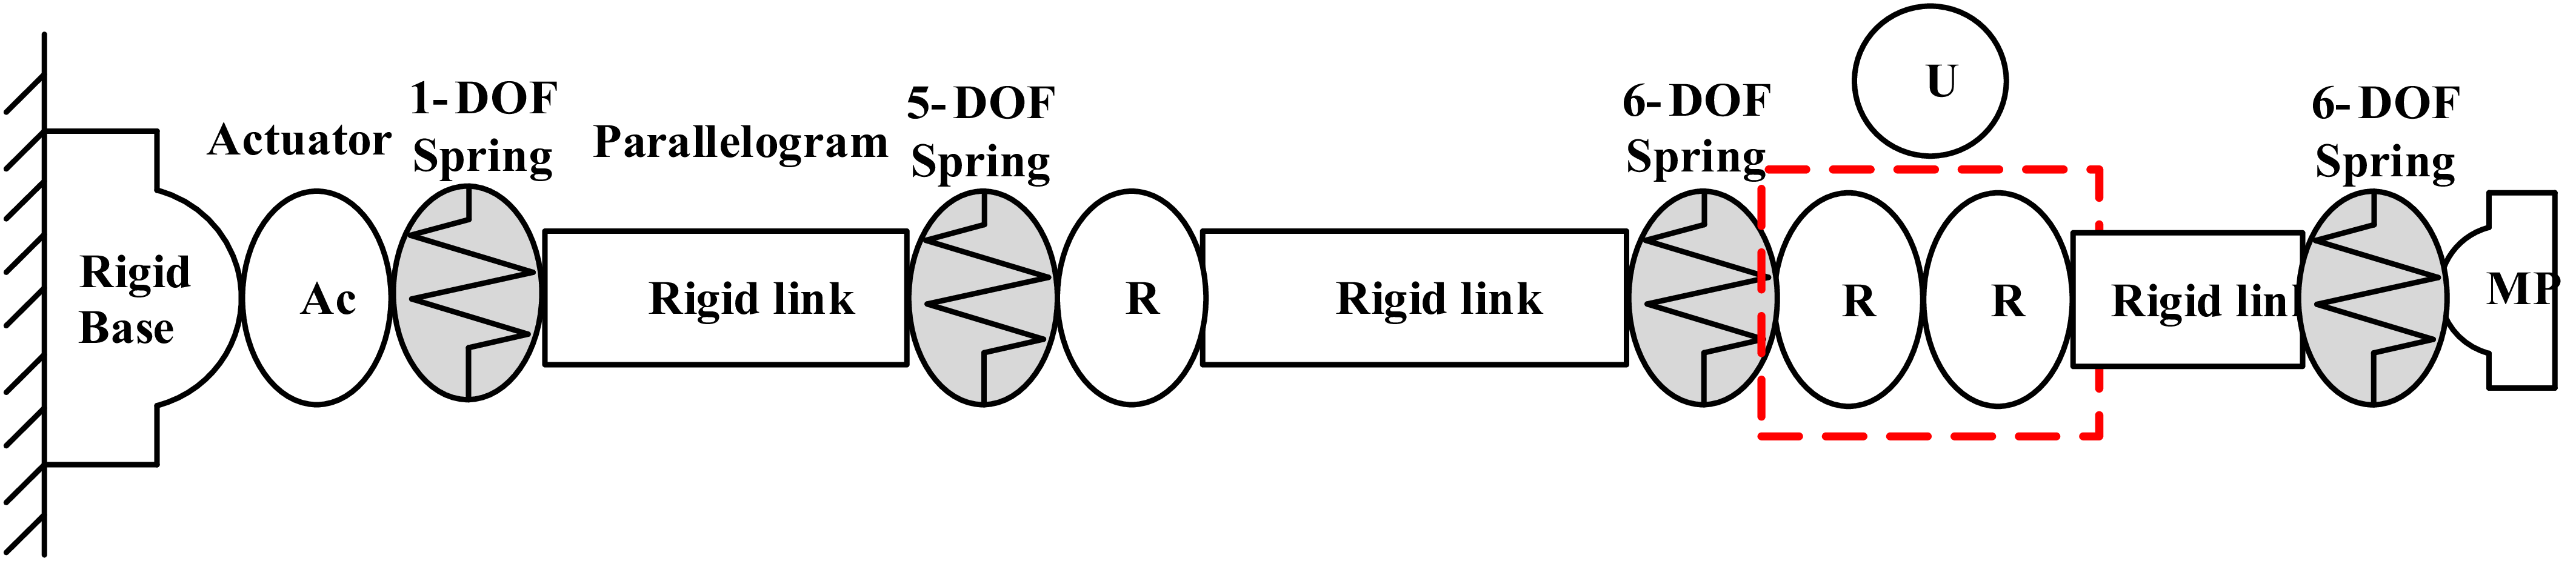
The virtual spring model of the PPaRU limb is presented in Figure 11, where a 1-DOF virtual spring denotes the actuator stiffness, while a 5-DOF and two 6-DOF virtual springs correspond to the stiffness of the parallelogram structure, the
 $B_{i}C_{i}$
and the
 $U_{i}(i=1,3)$
links, respectively.
The virtual spring model of the PPaRU limb.

According to the static equilibrium equation:
 \begin{align} \left[\begin{array}{c@{\quad}c} {\boldsymbol{J}}_{\theta }^{i}\left({\boldsymbol{K}}_{Li}^{i}\right)^{-1}\left({\boldsymbol{J}}_{\theta }^{i}\right)^{T} & {\boldsymbol{J}}_{q}^{i}\\[3pt] \left({\boldsymbol{J}}_{q}^{i}\right)^{T} & \boldsymbol{0}_{4\times 4} \end{array}\right]\left[\begin{array}{c} \boldsymbol{f}\\[3pt] \delta \boldsymbol{q}_{i} \end{array}\right]=\left[\begin{array}{c@{\quad}c} \boldsymbol{K}_{Li} & *\\[3pt] * & * \end{array}\right]\left[\begin{array}{c} \boldsymbol{f}\\[3pt] \delta \boldsymbol{q}_{i} \end{array}\right]=\left[\begin{array}{c} \delta \boldsymbol{t}_{Li}\\[3pt] \boldsymbol{0} \end{array}\right] \end{align}
The stiffness matrix of the PPaRU limb is the first
 $6\times 6$
submatrix extracted from the following matrix:
 \begin{align} \boldsymbol{K}_{Li}=\left[\begin{array}{c@{\quad}c} {\boldsymbol{J}}_{\theta }^{i}\left({\boldsymbol{K}}_{Li}^{i}\right)^{-1}\left({\boldsymbol{J}}_{\theta }^{i}\right)^{T} & {\boldsymbol{J}}_{q}^{i}\\[3pt] \left({\boldsymbol{J}}_{q}^{i}\right)^{T} & \boldsymbol{0}_{4\times 4} \end{array}\right]^{-1} \end{align}
where
 $\boldsymbol{K}_{Li}(i=1,3)$
is the stiffness matrix of the PPaRU limb,
 $\boldsymbol{f}$
is the force applied at the free end of the limb,
 $\delta \boldsymbol{q}_{i}$
is the motion of passive joints,
 ${\boldsymbol{K}}_{Li}^{i}=diag(\mathrm{K}_{ac},\boldsymbol{K}_{Pa},\boldsymbol{K}_{rod1},\boldsymbol{K}_{rod2})$
represents the stiffness in the joint space,
 ${\boldsymbol{J}}_{q}^{i}=({\boldsymbol{\$}}_{q1}^{i}\ {\boldsymbol{\$}}_{q2}^{i}\ {\boldsymbol{\$}}_{q3}^{i}\ {\boldsymbol{\$}}_{q4}^{i})$
is the Jacobian matrix of the passive joints,
 ${\boldsymbol{J}}_{\theta }^{i}=(\boldsymbol{\$}_{ac}\ {\boldsymbol{\$}}_{Pa1}^{i}\ {\boldsymbol{\$}}_{Pa2}^{i} \ldots {\boldsymbol{\$}}_{Rod12}^{i})$
is the Jacobian matrix of the links (see Appendix B),
 $\boldsymbol{r}_{C1}=(x,y-b2+l_{u},z)$
and
 $\boldsymbol{r}_{C3}=(x,y+b2-l_{u},z)$
are the end points of the U1 and U3 joints, respectively.
6.2.2. Stiffness modeling of the PPaRR limb
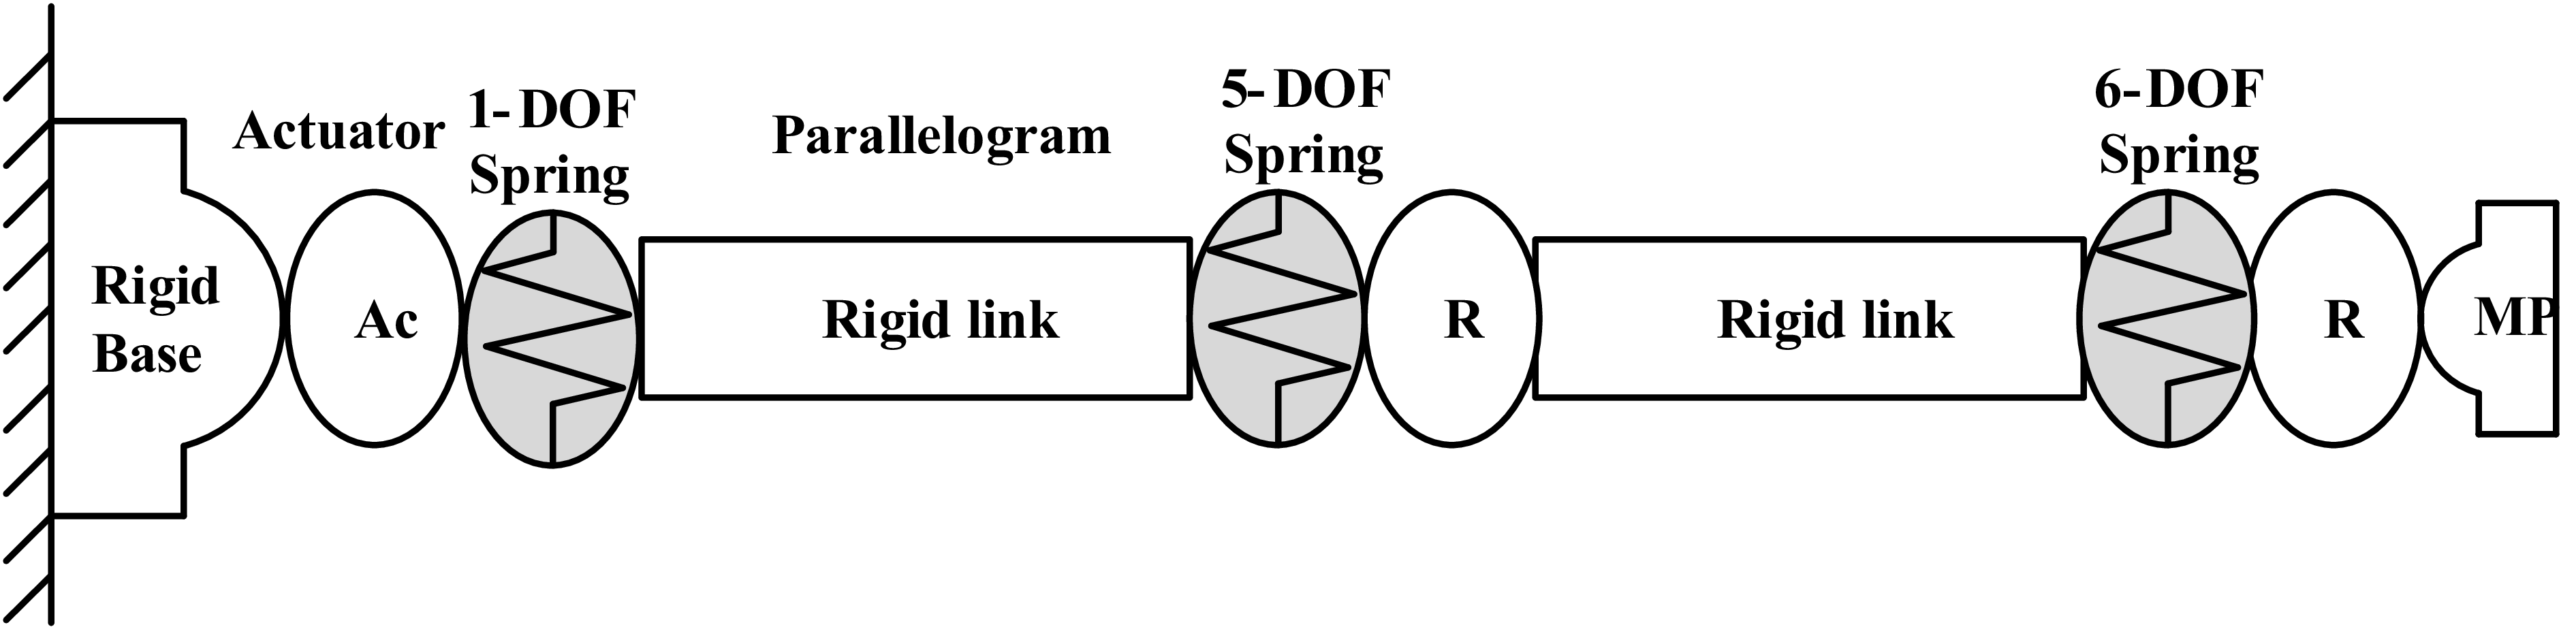
The virtual spring model of the PPaRR limb is presented in Figure 12, where the 1-DOF virtual spring denotes the stiffness of the actuator, and the 5-DOF and 6-DOF virtual springs represent the stiffness of the Pa joint and the link, respectively.
The virtual spring model of the PPaRR limb.

Similarly, the stiffness matrix of the PPaRR limb is the first
 $6\times 6$
submatrix extracted from the following matrix:
 \begin{align} \boldsymbol{K}_{Li}=\left[\begin{array}{c@{\quad}c} {\boldsymbol{J}}_{\theta }^{i}\left({\boldsymbol{K}}_{Li}^{i}\right)^{-1}\left({\boldsymbol{J}}_{\theta }^{i}\right)^{T} & {\boldsymbol{J}}_{q}^{i}\\[3pt] \left({\boldsymbol{J}}_{q}^{i}\right)^{T} & \boldsymbol{0}_{3\times 3} \end{array}\right] \end{align}
where
 $\boldsymbol{K}_{Li}(i=2,4)$
is the stiffness matrix of the PPaRR limb,
 ${\boldsymbol{K}}_{Li}^{i}=diag(\mathrm{K}_{ac},\boldsymbol{K}_{Pa},\boldsymbol{K}_{rod})$
represents the stiffness matrix in the joint space,
 ${\boldsymbol{J}}_{q}^{i}=({\boldsymbol{\$}}_{q1}^{i}\ {\boldsymbol{\$}}_{q2}^{i}\ {\boldsymbol{\$}}_{q3}^{i})$
is the Jacobian matrix of the passive joints and
 ${\boldsymbol{J}}_{\theta }^{i}=(\boldsymbol{\$}_{ac}\ {\boldsymbol{\$}}_{Pa1}^{i}\ {\boldsymbol{\$}}_{Pa2}^{i} \ldots {\boldsymbol{\$}}_{Rod5}^{i}\ {\boldsymbol{\$}}_{Rod6}^{i})$
is the Jacobian matrix of the links (see Appendix B).
The overall stiffness matrix
 $\boldsymbol{K}$
of the 3T1R PM is
 \begin{align} \boldsymbol{K}=\boldsymbol{K}_{L1}+\boldsymbol{K}_{L2}+\boldsymbol{K}_{L3}+\boldsymbol{K}_{L4} \end{align}
6.3. Simulation case
The structural parameters are the same as those in Section 3.3. Table II lists the cross-sectional radius of the links and material properties of the 2PPaRR-2PPaRU PM, where Kac denotes the stiffness of the actuator, r1 denotes the link radius, and ru denotes the radius of the U joint. To verify the correctness of the stiffness model of the PM, an external force
 $\boldsymbol{f}=(1\mathrm{N}.\mathrm{m};1\mathrm{N}.\mathrm{m};1\mathrm{N}.\mathrm{m};12\mathrm{N};12\mathrm{N};12\mathrm{N})$
is applied to the MP at the given pose
 $(34.417\text{ mm},8.211\mathrm{mm},838.575\text{ mm},0)$
. The results of the finite element model (FEM) and the analytical results are shown in Table III, and Figure 13 presents the deformation of the PM. The absolute values of the relative errors between the FEM results and the theoretical results in Table III are within 5%, which validates the correctness of the theoretical model.
The cross-sectional area of the links and material properties

Table II. Long description
A table listing structural parameters of a mechanical system. The table has six rows and eight columns. Column headers are Kac/N/m, E/MPa, r1/mm, ru/mm, lu/mm, dPa/mm, and Poisson ratio/mu. Row 1: Kac, 5e4; E, 2e5; r1, 12; ru, 11; lu, 28; dPa, 110; Poisson ratio, 0.3.
The result comparison of the FEA model and the analytical model of the PM

Table III. Long description
A table comparing analytical solutions, FEA solutions, and relative error for structural parameters. The table has three columns labeled delta x (mm), delta y (mm), and delta z (mm), and four rows labeled Analytical solutions, FEA solutions, and Relative error (percent). Row 1: Analytical solutions, delta x 0.0746, delta y 0.1969, delta z 0.0380. Row 2: FEA solutions, delta x 0.0770, delta y 0.1993, delta z 0.0388. Row 3: Relative error (percent), delta x 3.12, delta y 1.20, delta z 2.06.
FEA model of the 2PPaRR-2PPaRU PM. (a) Linear deformation along the x-axis, (b) linear deformation along the y-axis, and (c) linear deformation along the z-axis.

6.4. The stiffness performance analysis of the 2PPaRR-2PPaRU
The stiffness performance of the PM is correlated with its configuration. Similar to the kinematic indices based on the Jacobian matrix, the typical index based on the stiffness matrix has unclear physical significance for the unit inconsistency of the rotational stiffness and translational stiffness [Reference Yan, Ong and Nee28]. The virtual stiffness index (VSI) [Reference Yan, Ong and Nee28] reflects the stiffness of a PM in terms of energy, which is used to evaluate the local stiffness of the PM. When a force
 $\boldsymbol{f}$
is applied to the origin of the MP, the virtual work
 $W_{V}$
can be written as:
 \begin{align} W_{V}\,=\, \boldsymbol{f}^{T}\delta \boldsymbol{t} \end{align}
where
 $\delta \boldsymbol{t}$
is the virtual displacement vector caused by the force
 $\boldsymbol{f}$
. Substituting
 $\delta \boldsymbol{t}=\boldsymbol{K}^{-1}\boldsymbol{f}$
into Eq. (43), the virtual work can be rewritten as
 \begin{align} VW=\frac{1}{\boldsymbol{f}^{T}\boldsymbol{K}^{-1}\boldsymbol{f}} \end{align}
Within the linear elastic range, the relationship between virtual displacement and the force
 $\boldsymbol{f}$
satisfies Hooke’s law. Under a certain external force, a larger
 $\boldsymbol{f}^{T}\boldsymbol{K}^{-1}\boldsymbol{f}$
corresponds to larger virtual deflections and virtual work, thus indicating poor stiffness performance, and vice versa. Because the stiffness index is closely related to the direction of the wrench applied on the MP [Reference Yan, Ong and Nee28], the stiffness performance distribution of the 2PPaRR-2PPaRU over the reachable workspace under a unit force
 $\boldsymbol{f}=(\sqrt{6}/6\mathrm{N}.\mathrm{m};\sqrt{6}/6\mathrm{N}.\mathrm{m};\sqrt{6}/6\mathrm{N}.\mathrm{m};\sqrt{6}/6\mathrm{N};\sqrt{6}/6\mathrm{N};\sqrt{6}/6\mathrm{N})$
is presented in Figure 14. It can be seen from Figure 14 that the stiffness performance of the PM with
 $\phi =45^{\circ }$
and
 $90^{\circ }$
is better than that of the PM with
 $\phi =-45^{\circ }$
and
 $-90^{\circ }$
, demonstrating that the PM exhibits higher stiffness performance when
 $\phi$
is positive.
The VSI distribution over the reachable workspace under different orientations. (a)
 $\phi =-45^{\circ }$
, (b)
 $\phi =0$
, (c)
 $\phi =45^{\circ }$
, (d)
 $\phi =-90^{\circ }$
, and (e)
 $\phi =90^{\circ }$
.

Figure 14. Long description
Panel A: A heat map showing the VSI distribution over the reachable workspace. The x-axis ranges from -35 to 110 millimeters, and the y-axis ranges from -125 to 125 millimeters. The color scale ranges from 0 to 700, with darker colors indicating lower values and lighter colors indicating higher values. The distribution shows a gradient from left to right, with higher values concentrated on the right side. Panel B: A heat map showing the VSI distribution over the reachable workspace. The x-axis ranges from -35 to 145 millimeters, and the y-axis ranges from -125 to 125 millimeters. The color scale ranges from 0 to 2200, with darker colors indicating lower values and lighter colors indicating higher values. The distribution shows a gradient from left to right, with higher values concentrated on the left side. Panel C: A heat map showing the VSI distribution over the reachable workspace. The x-axis ranges from -35 to 110 millimeters, and the y-axis ranges from -125 to 125 millimeters. The color scale ranges from 1500 to 3200, with darker colors indicating lower values and lighter colors indicating higher values. The distribution shows a central concentration of higher values. Panel D: A heat map showing the VSI distribution over the reachable workspace. The x-axis ranges from -35 to 35 millimeters, and the y-axis ranges from -125 to 125 millimeters. The color scale ranges from 1700 to 2700, with darker colors indicating lower values and lighter colors indicating higher values. The distribution shows a central concentration of higher values. Panel E: A heat map showing the VSI distribution over the reachable workspace. The x-axis ranges from -35 to 35 millimeters, and the y-axis ranges from -125 to 125 millimeters. The color scale ranges from 2500 to 4400, with darker colors indicating lower values and lighter colors indicating higher values. The distribution shows a gradient from left to right, with higher values concentrated on the right side.
7. Parameter optimization design
The performance of the PM is significantly influenced by its structural parameters. To optimize the size of the mechanism, the parameter-finiteness normalization method (PFNM) [Reference Liu, Bonev, Wang and Xie38, Reference Liu and Wang39] is employed. Unlike other optimization methods like Genetic Algorithm, PFNM yields multiple sets of structural parameters with similar performance in a single calculation. This approach allows designers to flexibly adjust parameters based on specific requirements, saving time. However, expressing the six structural parameters
 $(a_{1},a_{2},l_{1},l_{2},b_{1},b_{2})$
in 3D design space can be challenging. Thus, by defining
 $l_{1}=l_{2},a_{1}=a_{2},b_{1}=2b_{2}$
, the three design variables can be obtained and normalized as:
 \begin{align} \begin{cases} D=\dfrac{r_{1}+r_{2}+r_{3}}{3}\\[3pt] r_{1}=b_{2},r_{2}=l_{2},r_{3}=a_{1} \end{cases} \end{align}
where D is a normalized factor and equals 340 mm. In real applications, the following conditions should be satisfied:
 \begin{align} \begin{cases} r_{1},r_{2},r_{3}\leq 3\\[3pt] r_{1}\leq r_{3} \end{cases} \end{align}
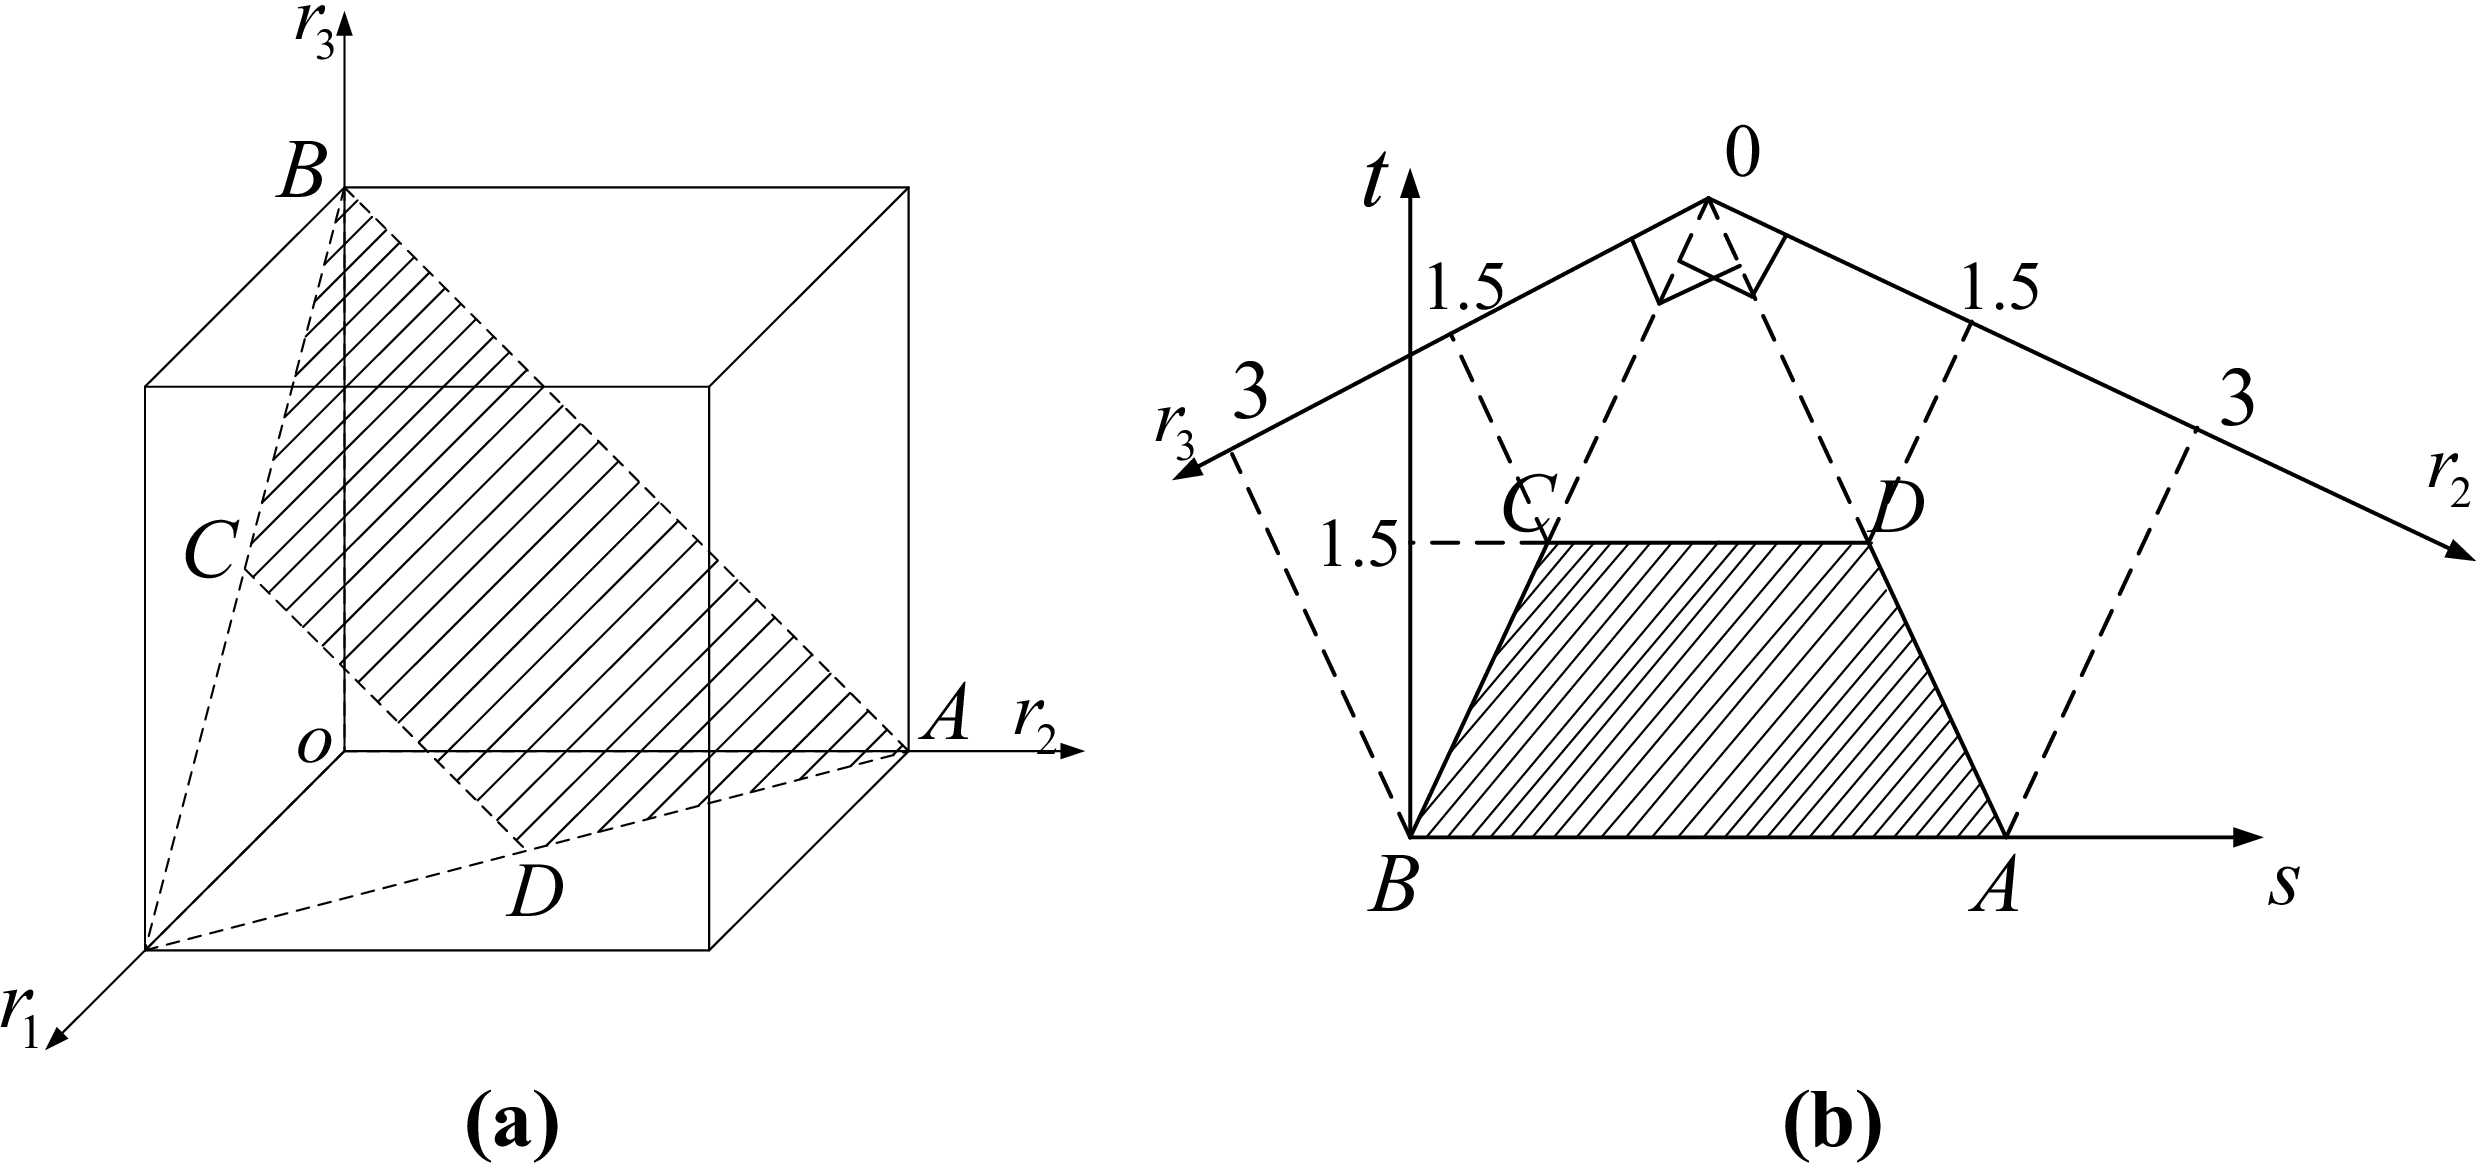
Following the procedures outlined in Refs. [Reference Liu, Bonev, Wang and Xie38, Reference Liu and Wang39], the parameter design space (PDS) can be established as shown in Figure 15(a). The trapezoid ABCD in Figure 15(a) represents all possible solutions. For convenience, the trapezoidal PDS ABCD is transformed into a plan view, as shown in Figure 15(b), where the relationship between the design parameters
 $(r_{1},r_{2},r_{3})$
in three-dimensional space and those
 $(s,t)$
in plan space is given as follows:
Parameter design space model. (a) Spatial view and (b) plan view.

 \begin{align} \begin{cases} r_{1}=t\\[3pt] r_{2}=\dfrac{\sqrt{3}}{2}s-\dfrac{t}{2}\\[3pt] r_{3}=3-\dfrac{\sqrt{3}}{2}s-\dfrac{t}{2} \end{cases} \quad \text{or} \quad \begin{cases} s=\sqrt{3}+\dfrac{\sqrt{3}}{3}r_{2}-\dfrac{\sqrt{3}}{3}r_{3}\\[3pt] t=r_{1} \end{cases} \end{align}
To ensure the correct assembly and motion of the mechanism, the design parameters in the trapezoid ABCD should also satisfy the following conditions:
 \begin{align} \begin{cases} 2l_{2}+2b_{2}\geq 2.2a_{1}\\[3pt] 2l_{2}+b_{1}\geq 2.2a_{2} \end{cases} \end{align}
Maintaining a balance among various performance indices is essential to avoid sacrificing one index for another. To achieve this, the ORWA, GTWR, and GSI are jointly evaluated at Z = 1,000 mm. Their respective distributions over the PDS are shown in Figure 16(a)–(c). The results show that the ORWA decreases with the increase in t, while the GTWR achieves a high value in the middle region and the GSI decreases with the increase in s. To ensure that the PM exhibits satisfactory ORWA, motion/force transmission performance, and stiffness performance, the optimal region is derived by imposing the following constraints:
 $\text{ORWA}\geq 0.8,\text{GTWR}\geq 0.25$
, and
 $\mathrm{GSI}\geq 2400$
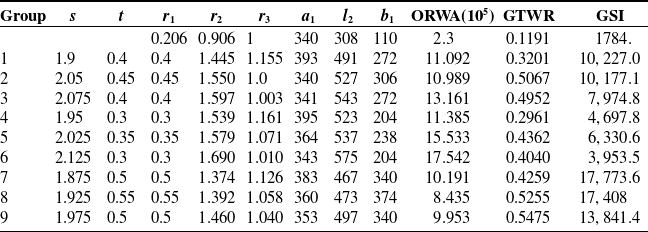
, as presented in Figure 16(d). This method provides multiple sets of design parameter selections. Subsequently, nine groups of data points are selected from Figure 16(d) as listed in Table IV. Among them, the design parameters of Group 7 are chosen as the optimal results, and the CAD model of the optimized 3T1R PM is shown in Figure 17.
The ORWA, GTWR, and GSI in the PDS

Table IV. Long description
A table with nine rows and twelve columns comparing performance indices across different groups. The columns are labeled as Group, s, t, r1, r2, r3, a1, l2, b1, ORWA (10^5), GTWR, and GSI. Each row provides specific values for these indices. Row 1: Group, 1, s, 1.9, t, 0.4, r1, 1.445, r2, 1.155, r3, 393, a1, 491, l2, 272, b1, 11.092, ORWA (10^5), 0.3201, GTWR, 10227.0, GSI. Row 2: Group, 2, s, 2.05, t, 0.45, r1, 1.550, r2, 1.00, r3, 340, a1, 527, l2, 306, b1, 10.989, ORWA (10^5), 0.5067, GTWR, 10177.1, GSI. Row 3: Group, 3, s, 2.075, t, 0.4, r1, 1.597, r2, 1.03, r3, 341, a1, 543, l2, 272, b1, 13.161, ORWA (10^5), 0.4952, GTWR, 7974.8, GSI. Row 4: Group, 4, s, 1.95, t, 0.3, r1, 1.539, r2, 1.161, r3, 395, a1, 523, l2, 204, b1, 11.385, ORWA (10^5), 0.2961, GTWR, 4697.8, GSI. Row 5: Group, 5, s, 2.025, t, 0.35, r1, 1.579, r2, 1.071, r3, 364, a1, 537, l2, 238, b1, 15.533, ORWA (10^5), 0.4362, GTWR, 6330.6, GSI. Row 6: Group, 6, s, 2.125, t, 0.3, r1, 1.690, r2, 1.010, r3, 343, a1, 575, l2, 204, b1, 17.542, ORWA (10^5), 0.4040, GTWR, 3953.5, GSI. Row 7: Group, 7, s, 1.875, t, 0.5, r1, 1.374, r2, 1.126, r3, 383, a1, 467, l2, 340, b1, 10.191, ORWA (10^5), 0.4259, GTWR, 17773.6, GSI. Row 8: Group, 8, s, 1.925, t, 0.55, r1, 1.392, r2, 1.058, r3, 360, a1, 473, l2, 374, b1, 8.435, ORWA (10^5), 0.5255, GTWR, 17408, GSI. Row 9: Group, 9, s, 1.975, t, 0.5, r1, 1.460, r2, 1.040, r3, 353, a1, 497, l2, 340, b1, 9.953, ORWA (10^5), 0.5475, GTWR, 13841.4, GSI.
ORWA, GTWR, and GSI distribution in the PDS. (a) distribution of ORWA, (b) distribution of GTWR, (c) distribution of GSI, and (d) optimum region.

Figure 16. Long description
Panel A: A contour plot shows the distribution of ORWA. The horizontal axis is labeled s and the vertical axis is labeled t. The color scale ranges from blue to red, indicating increasing values. The contours form a concentrated region in the lower right part of the plot. Panel B: A contour plot displays the distribution of GTWR. The horizontal axis is labeled s and the vertical axis is labeled t. The color scale ranges from blue to red, indicating increasing values. The contours form a concentrated region in the lower right part of the plot. Panel C: A contour plot illustrates the distribution of GSI. The horizontal axis is labeled s and the vertical axis is labeled t. The color scale ranges from blue to red, indicating increasing values. The contours form a concentrated region in the lower right part of the plot. Panel D: A contour plot shows the optimum region. The horizontal axis is labeled s and the vertical axis is labeled t. The plot includes a red line indicating the workspace, a cyan line for GTI, and a magenta line for GSI. The optimum region is highlighted in yellow.
The optimized 3T1R PM.

Figure 17. Long description
A diagram of an optimized 3T1R parallel mechanism with a 2PPaRR-2PPaRU configuration. The mechanism consists of four limbs connecting a base platform to a moving platform. Each limb includes a combination of parallelogram joints and revolute joints. The sequence of joints in each limb is changed from R-Pa to Pa-R, which helps in reducing the influence of the driving joint stroke on the cross-sectional profile of the reachable workspace, resulting in a more regular workspace. The diagram shows the structural arrangement of the joints and limbs, highlighting the changes made to address architectural singularities and improve performance.
Group * represents the original structural parameters. The LTI and VSI distributions for the optimized parameters within the reachable workspace are shown in Figures 18 and 19, respectively. The GTWR values in Figure 18 are 0.736, 0.622, 0.0, 0.229, 0.229 for MP orientations of 0°, 45°, −45°, 90°, and −90°, respectively. Compared to the LTI distribution before optimization in Figure 9, which exhibits GTWR values of 0.223 and 0.239 for MP orientations of 0° and 45°, the optimized distribution yields notable improvements in both GTWR and ORWA. Furthermore, as shown in Figure 19, the GSI values of the optimized design are 22,671.3, 27,870.4, 3,070.8, 26,869.1, and 9,361.6 for the same sequence of MP orientations. Under these optimized parameters, the proportion of the workspace with good VSI reaches 1.0 for all MP orientations except −45°, where it accounts for 0.490. In contrast, the initial design produces much lower GSI values of 1,156.4, 2,707.5, 146.8, 3,513.7, and 2,344.3, and workspace regions with good VSI are only available at MP orientations of 45°, 90°, −90°, with corresponding fractions of 0.827, 1.0, and 0.390, respectively. This comparison validates the effectiveness of the optimization approach for the improved 3T1R PM.
LTI distribution in group 7 (a)
 $\phi =-45^{\circ }$
, (b)
 $\phi =0$
, (c)
 $\phi =45^{\circ }$
, (d)
 $\phi =-90^{\circ }$
, and (e)
 $\phi =90^{\circ }$
.

Figure 18. Long description
Panel A: A heat map showing LTI distribution with x-axis labeled x/mm ranging from -80 to 320 and y-axis labeled y/mm ranging from -210 to 210. The color scale ranges from 0 to 0.5, with darker colors indicating lower values and lighter colors indicating higher values. The distribution shows a gradient from left to right. Panel B: A heat map showing LTI distribution with x-axis labeled x/mm ranging from -40 to 380 and y-axis labeled y/mm ranging from -210 to 210. The color scale ranges from 0 to 0.7, with darker colors indicating lower values and lighter colors indicating higher values. The distribution shows a central concentration of higher values. Panel C: A heat map showing LTI distribution with x-axis labeled x/mm ranging from -80 to 320 and y-axis labeled y/mm ranging from -210 to 210. The color scale ranges from 0 to 0.7, with darker colors indicating lower values and lighter colors indicating higher values. The distribution shows a central concentration of higher values. Panel D: A heat map showing LTI distribution with x-axis labeled x/mm ranging from -80 to 80 and y-axis labeled y/mm ranging from -210 to 210. The color scale ranges from 0 to 0.6, with darker colors indicating lower values and lighter colors indicating higher values. The distribution shows a central concentration of higher values with a labeled region indicating LTI greater than or equal to 0.5. Panel E: A heat map showing LTI distribution with x-axis labeled x/mm ranging from -80 to 80 and y-axis labeled y/mm ranging from -210 to 210. The color scale ranges from 0 to 0.6, with darker colors indicating lower values and lighter colors indicating higher values. The distribution shows a central concentration of higher values.
VSI distribution in group 7 (a)
 $\phi =-45^{\circ }$
, (b)
 $\phi =0$
, (c)
 $\phi =45^{\circ }$
, (d)
 $\phi =-90^{\circ }$
, and (e)
 $\phi =90^{\circ }$
.

8. Conclusions
This paper introduces an enhanced single MP 3T1R PM, denoted as 2PPaRR-2PPaRU, which incorporates decoupled rotational pitch motion. Building upon the original design, this improved version features coaxially connected end joints in limbs 1, 3, and 4, effectively addressing performance issues in the initial configuration. Furthermore, it ensures that the rotation of the MP is solely influenced by limb 2, offering the advantage of partial motion decoupling. The paper presents both inverse and forward kinematic solutions, which are helpful to simplify kinematic analysis and real-time control efforts. Singularity analysis reveals that the improved 3T1R PM 2PPaRR-2PPaRU exhibits inverse, forward, and combined singularities. The LTI analysis shows that the poor performance at the initial configuration was removed. The stiffness analysis demonstrates that the region exhibiting higher stiffness is close to the workspace boundary under the given unit wrench. Finally, the multi-objective optimization results reveal significant improvements in the ORWA, GTWR, and GSI compared to the original design. These analyses establish a solid foundation for prototype manufacturing and motion planning in subsequent work.
Author contributions
Xiaoshu Zhang: Methodology, Software, Validation, Writing – original draft, Writing – review and editing, Conceptualization. Aihong Ji: Methodology, Supervision, Funding acquisition. Shikun Wen: Software, Investigation. Andong Jiang: Review & editing, Investigation. Yi Sun: Formal analysis. Zhikang Yang: Writing & editing, Visualization. Qian Qi: Visualization.
Financial support
This work was financially supported by the Special Funds for Science and Technology Programs in Jiangsu Province (BZ2024021), the National Natural Science Foundation of China (No. 52575339, No. 52575123), and the Natural Science Foundation of Jiangsu Province (BK20241407).
Competing interests
The authors declare no conflicts of interest exist.
Ethical approval
Not applicable.
Appendix A. The expressions of the transmission wrench screw
 \begin{align*} l_{11} &=l_{1}\cos \theta _{11}\left(z-d_{1}-l_{1}\sin \theta _{11}\right),m_{1}=-l_{1}\sin \theta _{11}\left(b_{2}-a_{1}-y\right),n_{1}=l_{1}\sin \theta _{11}\left(z-d_{1}-l_{1}\sin \theta _{11}\right)\\[6pt]p_{1}&=l_{1}\sin \theta _{11}\left(\left(d_{1}+l_{1}\sin \theta _{11}\right)\left(b_{2}-y\right)-za_{1}\right),q_{1}=-\left(d_{1}+l_{1}\sin \theta _{11}-z\right)\left(-xl_{1}\sin \theta _{11}+zl_{1}\cos \theta _{11}\right),r_{1}=0\\[6pt]l_{21}&=-l_{1}\sin \theta _{21}\left(x-b_{1}\cos \phi +a_{2}\right),m_{2}=l_{1}\cos \theta _{21}\left(d_{2}+l_{1}\sin \theta _{21}-z-b_{1}\sin \phi \right),p_{2}=0,\\[6pt]l_{31}&=l_{1}\cos \theta _{31}\left(z-d_{3}-l_{1}\sin \theta _{31}\right),n_{2}=l_{1}\sin \theta _{21}\left(d_{2}+l_{1}\sin \theta _{21}-z-b_{1}\sin \phi \right),r_{2}=0,\\[6pt]q_{2}&=-l_{1}\sin \theta _{21}\left(\left(d_{2}+l_{1}\sin \theta _{21}\right)\left(x-b_{1}\cos \phi \right)+a_{2}\left(z+b_{1}\sin \phi \right)\right),m_{3}=-l_{1}\sin \theta _{31}\left(a_{1}-y-b_{2}\right),\\[6pt]n_{3}&=l_{1}\sin \theta _{31}\left(z-d_{3}-l_{1}\sin \theta _{31}\right),p_{3}=l_{1}\sin \theta _{31}\left(\left(d_{3}+l_{1}\sin \theta _{31}\right)\left(-y-b_{2}\right)+za_{1}\right),\\[6pt]q_{3}&=-\left(d_{3}+l_{1}\sin \theta _{31}-z\right)\left(-xl_{1}\sin \theta _{31}+zl_{1}\cos \theta _{31}\right),m_{4}=l_{1}\cos \theta _{41}\left(d_{4}+l_{1}\sin \theta _{41}-z\right),\\[6pt]n_{4}&=l_{1}\sin \theta _{41}\left(d_{4}+l_{1}\sin \theta _{41}-z\right),r_{3}=0,l_{41}=-l_{1}\sin \theta _{41}\left(x-a_{2}\right),p_{4}=0,\\[6pt]q_{4}&=l_{1}\sin \theta _{41}\left(za_{2}-xd_{4}-xl_{1}\sin \theta _{41}\right),r_{4}=0. \end{align*}
Appendix B. The expressions of the Jacobian matrix
The Jacobian matrix of the PPaRU limb is:
 \begin{align*} {\boldsymbol{\$}}_{Pa1}^{i} &=\left[\begin{array}{c} \boldsymbol{u}_{{a_{i}}{b_{i}}}\\[3pt] \left(\boldsymbol{r}_{Bi}-\boldsymbol{o}'\right)\times \boldsymbol{u}_{{a_{i}}{b_{i}}} \end{array}\right],{\boldsymbol{\$}}_{Pa2}^{i}=\left[\begin{array}{c} -\boldsymbol{y}\\[3pt] -\left(\boldsymbol{r}_{Bi}-\boldsymbol{o}'\right)\times \boldsymbol{y} \end{array}\right],{\boldsymbol{\$}}_{Pa3}^{i}=\left[\begin{array}{c} -\boldsymbol{u}_{{a_{i}}{b_{i}}}\times \boldsymbol{y}\\[3pt] -\left(\boldsymbol{r}_{Bi}-\boldsymbol{o}'\right)\times \left(\boldsymbol{u}_{{a_{i}}{b_{i}}}\times \boldsymbol{y}\right) \end{array}\right],{\boldsymbol{\$}}_{Pa4}^{i}=\left[\begin{array}{c} \boldsymbol{0}\\[3pt] \boldsymbol{u}_{{a_{i}}{b_{i}}} \end{array}\right],\\[4pt]{\boldsymbol{\$}}_{Pa5}^{i}&=\left[\begin{array}{c} \boldsymbol{0}\\[3pt] -\boldsymbol{y} \end{array}\right]\boldsymbol{,}{\boldsymbol{\$}}_{Rod1}^{i}=\left[\begin{array}{c} \boldsymbol{u}_{{b_{i}}{c_{i}}}\\[3pt] \left(\boldsymbol{r}_{Ci}-\boldsymbol{o}'\right)\times \boldsymbol{u}_{{b_{i}}{c_{i}}} \end{array}\right],{\boldsymbol{\$}}_{Rod2}^{i}=\left[\begin{array}{c} \boldsymbol{x}\times \boldsymbol{u}_{{b_{i}}{c_{i}}}\\ \left(\boldsymbol{r}_{Ci}-\boldsymbol{o}'\right)\times \left(\boldsymbol{x}\times \boldsymbol{u}_{{b_{i}}{c_{i}}}\right) \end{array}\right],{\boldsymbol{\$}}_{Rod3}^{i}=\left[\begin{array}{c} \boldsymbol{x}\\ \left(\boldsymbol{r}_{Ci}-\boldsymbol{o}'\right)\times \boldsymbol{x} \end{array}\right],\\[4pt]{\boldsymbol{\$}}_{Rod4}^{i}&=\left[\begin{array}{c} \boldsymbol{0}\\ \boldsymbol{u}_{{b_{i}}{c_{i}}} \end{array}\right],{\boldsymbol{\$}}_{Rod5}^{i}=\left[\begin{array}{c} \boldsymbol{0}\\ \boldsymbol{x}\times \boldsymbol{u}_{{b_{i}}{c_{i}}} \end{array}\right],{\boldsymbol{\$}}_{Rod6}^{i}=\left[\begin{array}{c} \boldsymbol{0}\\ \boldsymbol{x} \end{array}\right],{\boldsymbol{\$}}_{Rod7}^{i}=\left[\begin{array}{c} \boldsymbol{y}\\ \left(\boldsymbol{r}_{Ci}-\boldsymbol{o}'\right)\times \boldsymbol{y} \end{array}\right],{\boldsymbol{\$}}_{Rod8}^{i}=\left[\begin{array}{c} \boldsymbol{z}\\ \left(\boldsymbol{r}_{Ci}-\boldsymbol{o}'\right)\times \boldsymbol{z} \end{array}\right],\\[4pt]{\boldsymbol{\$}}_{Rod9}^{i}&=\left[\begin{array}{c} \boldsymbol{x}\\ \left(\boldsymbol{r}_{Ci}-\boldsymbol{o}'\right)\times \boldsymbol{x} \end{array}\right],{\boldsymbol{\$}}_{Rod10}^{i}=\left[\begin{array}{c} \boldsymbol{0}\\ \boldsymbol{y} \end{array}\right],{\boldsymbol{\$}}_{Rod11}^{i}=\left[\begin{array}{c} \boldsymbol{0}\\ \boldsymbol{z} \end{array}\right]\boldsymbol{,}{\boldsymbol{\$}}_{Rod12}^{i}=\left[\begin{array}{c} \boldsymbol{0}\\ \boldsymbol{x} \end{array}\right],{\boldsymbol{\$}}_{q1}^{i}=\left[\begin{array}{c} \boldsymbol{0}\\ \boldsymbol{-}\boldsymbol{u}_{{a_{i}}{b_{i}}}\times \boldsymbol{y} \end{array}\right],\\[4pt]{\boldsymbol{\$}}_{q2}^{i}&=\left[\begin{array}{c} \boldsymbol{x}\\ \left(\boldsymbol{r}_{Bi}-\boldsymbol{o}'\right)\times \boldsymbol{x} \end{array}\right],{\boldsymbol{\$}}_{q3}^{i}=\left[\begin{array}{c} \boldsymbol{x}\\ \left(\boldsymbol{r}_{Ci}-\boldsymbol{o}'\right)\times \boldsymbol{x} \end{array}\right],{\boldsymbol{\$}}_{q4}^{i}=\left[\begin{array}{c} \boldsymbol{y}\\ \left(\boldsymbol{r}_{Ci}-\boldsymbol{o}'\right)\times \boldsymbol{y} \end{array}\right],\boldsymbol{\$}_{ac}=\left[\begin{array}{c} \boldsymbol{0}\\ \boldsymbol{z} \end{array}\right]\end{align*}
where
 $\boldsymbol{u}_{{a_{i}}{b_{i}}}$
and
 $\boldsymbol{u}_{{b_{i}}{c_{i}}}$
denote the unit vectors of links
 $A_{i}B_{i}$
and
 $B_{i}C_{i}$
, respectively, and
 $\boldsymbol{r}_{Bi}, \boldsymbol{r}_{Ci}$
and
 $\boldsymbol{o}'$
denote the positions of points
 $B_{i}, C_{i}(i=1,3)$
and
 $o'$
in the fixed frame.
The Jacobian matrix of the PPaRR limb is:
 \begin{align*} {\boldsymbol{\$}}_{Pa1}^{i}&=\left[\begin{array}{c} \boldsymbol{u}_{{a_{i}}{b_{i}}}\\ \left(\boldsymbol{r}_{Bi}-\boldsymbol{o}'\right)\times \boldsymbol{u}_{{a_{i}}{b_{i}}} \end{array}\right],{\boldsymbol{\$}}_{Pa2}^{i}=\left[\begin{array}{c} \boldsymbol{x}\\ \left(\boldsymbol{r}_{Bi}-\boldsymbol{o}'\right)\times \boldsymbol{x} \end{array}\right],{\boldsymbol{\$}}_{Pa3}^{i}=\left[\begin{array}{c} \boldsymbol{u}_{{a_{i}}{b_{i}}}\times \boldsymbol{x}\\ \left(\boldsymbol{r}_{Bi}-\boldsymbol{o}'\right)\times \left(\boldsymbol{u}_{{a_{i}}{b_{i}}}\times \boldsymbol{x}\right) \end{array}\right],\boldsymbol{\$}_{ac}=\left[\begin{array}{c} \boldsymbol{0}\\ \boldsymbol{z} \end{array}\right]\end{align*}
 \begin{align*}{\boldsymbol{\$}}_{Pa4}^{i}&=\left[\begin{array}{c} \boldsymbol{0}\\ \boldsymbol{u}_{{a_{i}}{b_{i}}} \end{array}\right],{\boldsymbol{\$}}_{Pa5}^{i}=\left[\begin{array}{c} \boldsymbol{0}\\ \boldsymbol{x} \end{array}\right],{\boldsymbol{\$}}_{Rod1}^{i}=\left[\begin{array}{c} \boldsymbol{u}_{{b_{i}}{c_{i}}}\\ \left(\boldsymbol{r}_{Ci}-\boldsymbol{o}'\right)\times \boldsymbol{u}_{{b_{i}}{c_{i}}} \end{array}\right],{\boldsymbol{\$}}_{Rod2}^{i}=\left[\begin{array}{c} \boldsymbol{y}\times \boldsymbol{u}_{{b_{i}}{c_{i}}}\\ \left(\boldsymbol{r}_{Ci}-\boldsymbol{o}'\right)\times \left(\boldsymbol{y}\times \boldsymbol{u}_{{b_{i}}{c_{i}}}\right) \end{array}\right], \\ {\boldsymbol{\$}}_{Rod3}^{i} &=\left[\begin{array}{c} \boldsymbol{y}\\ \left(\boldsymbol{r}_{Ci}-\boldsymbol{o}'\right)\times \boldsymbol{y} \end{array}\right],\\[4pt]{\boldsymbol{\$}}_{Rod4}^{i}&=\left[\begin{array}{c} \boldsymbol{0}\\ \boldsymbol{u}_{{b_{i}}{c_{i}}} \end{array}\right],{\boldsymbol{\$}}_{Rod5}^{i}=\left[\begin{array}{c} \boldsymbol{0}\\ \boldsymbol{y}\times \boldsymbol{u}_{{b_{i}}{c_{i}}} \end{array}\right],{\boldsymbol{\$}}_{Rod6}^{i}=\left[\begin{array}{c} \boldsymbol{0}\\ \boldsymbol{y} \end{array}\right],{\boldsymbol{\$}}_{q1}^{i}=\left[\begin{array}{c} \boldsymbol{0}\\ \boldsymbol{u}_{{a_{i}}{b_{i}}}\times \boldsymbol{x} \end{array}\right],{\boldsymbol{\$}}_{q2}^{i}=\left[\begin{array}{c} \boldsymbol{y}\\ \left(\boldsymbol{r}_{Bi}-\boldsymbol{o}'\right)\times \boldsymbol{y} \end{array}\right], \\ {\boldsymbol{\$}}_{q3}^{i}&=\left[\begin{array}{c} \boldsymbol{y}\\ \left(\boldsymbol{r}_{Ci}-\boldsymbol{o}'\right)\times \boldsymbol{y} \end{array}\right].\end{align*}
where
 $\boldsymbol{u}_{{a_{i}}{b_{i}}}$
and
 $\boldsymbol{u}_{{b_{i}}{c_{i}}}$
denote the unit vectors of links
 $A_{i}B_{i}$
and
 $B_{i}C_{i}$
, respectively, and
 $\boldsymbol{r}_{Bi}, \boldsymbol{r}_{Ci}$
and
 $\boldsymbol{o}'$
denote the positions of points
 $B_{i}, C_{i}(i=2,4)$
and
 $o'$
in fixed frame.




 ϕ

 θ12=0
 θ22=0
 θ32=0
 θ42=0

 θ22=−ϕ

 θ22=−ϕ
 θ12=0
 θ22=−ϕ
 θ32=0
 θ22=−ϕ
 θ42=0

 ϕ=−45∘
 ϕ=0
 ϕ=45∘
 ϕ=−90∘
 ϕ=90∘




 ϕ=−45∘
 ϕ=0
 ϕ=45∘
 ϕ=−90∘
 ϕ=90∘


 ϕ=−45∘
 ϕ=0
 ϕ=45∘
 ϕ=−90∘
 ϕ=90∘

 ϕ=−45∘
 ϕ=0
 ϕ=45∘
 ϕ=−90∘
 ϕ=90∘


