1. Introduction
The study of the gabbroic rocks occurring along mid-ocean ridges is key for evaluating the evolution of the oceanic lithosphere, as they record the succession of magmatic events from deep to shallow crustal levels. It is important that the magmatic processes that can influence the compositions of lavas erupted at the spreading centres, such as crystal fractionation, crystal accumulation, in situ fractionation (Langmuir, Reference Langmuir1989) and magma mixing, are likely to be recorded in the gabbroic rocks constituting the foundation of the oceanic crust. Dredged gabbroic samples, therefore, are studied to examine gabbro–basalt relationships (Tiezzi & Scott, Reference Tiezzi and Scott1980; Bloomer, Natland & Fisher, Reference Bloomer, Natland, Fisher, Saunders and Norry1989), conditions of crystallization (Elthon, Reference Elthon1987), compositions and diversity of parental melts (Bloomer, Natland & Fisher, Reference Bloomer, Natland, Fisher, Saunders and Norry1989) and the dynamics of crystallization of plutonic rocks (Bloomer, Natland & Fisher, Reference Bloomer, Natland, Fisher, Saunders and Norry1989; Meyer, Dick & Thompson, Reference Meyer, Dick and Thompson1989).
The recovery of gabbroic rocks is mostly restricted to major transform faults or fracture zones transecting mid-ocean ridges, for example, the Mid-Atlantic Ridge (Miyashiro & Shido, Reference Miyashiro and Shido1980; Tiezzi & Scott, Reference Tiezzi and Scott1980; Walker & Delong, Reference Walker and Delong1984; Casey, Reference Casey, Karson, Cannat, Miller and Elthon1997; Casey et al. Reference Casey, Braun, Fujiwara, Matsumoto and Kelemen1998; Shipboard Scientific Party, Reference Kelemen, Kikawa and Miller2004), Southwest Indian Ridge (Hebert, Constantin & Robinson, Reference Hebert, Constantin, Robinson, Von Herzen and Robinson1991; Dick, Natland & Miller, Reference Dick, Natland and Miller1999; Dick et al. Reference Dick, Natland, Alt, Bach, Bideau, Gee, Haggas, Hertogen, Hirth, Holm, Ildefonse, Iturrino, John, Kellet, Kikawa, Kingdom, Leroux, Maede, Meyer, Miller, Naslund, Niu, Robinson, Snow, Stephen, Trimy, Worm and Yoshinobu2000), East Pacific Rise (Vanko & Batiza, Reference Vanko and Batiza1980; Hebert, Bideau & Hekinian, Reference Hebert, Bideau and Hekinian1983; Früh-Green, Plas & Dell'angelo, Reference Früh-Green, Plas, Dell'angelo, Mevel, Gillis, Allan and Meyer1996), Cayman Rise (Elthon, Casey & Komor, Reference Elthon, Casey and Komor1982; Elthon, Reference Elthon1987) and Gakkel Ridge (Gao et al. Reference Gao, Snow, Hellebrand, von der Handt, Dick and Hoefs2003). Restricted exposures of gabbros in these tectonic settings are due to thinning of crust, poor magma supply or intense faulting. Gabbros reported from ultra-slow mid-oceanic ridges, for example, the Gakkel Ridge in the Arctic Ocean, are mostly olivine gabbro, troctolite and microgabbro and are very primitive in nature (Gao et al. Reference Gao, Snow, Hellebrand, von der Handt, Dick and Hoefs2003). In contrast, gabbros from the Mid-Atlantic and Southwest Indian ridges (SWIR), occurring in association with major transform faults, are characterized by a wide range of compositions that suggests closed-system fractionation in ephemeral melt intrusions emplaced in the axial lithosphere (Bloomer, Natland & Fisher, Reference Bloomer, Natland, Fisher, Saunders and Norry1989). The presently available whole-rock and trace-element data for oceanic gabbros (mostly in different ODP sites and oceanic core complexes) for evaluating these rocks are mostly restricted to certain areas.
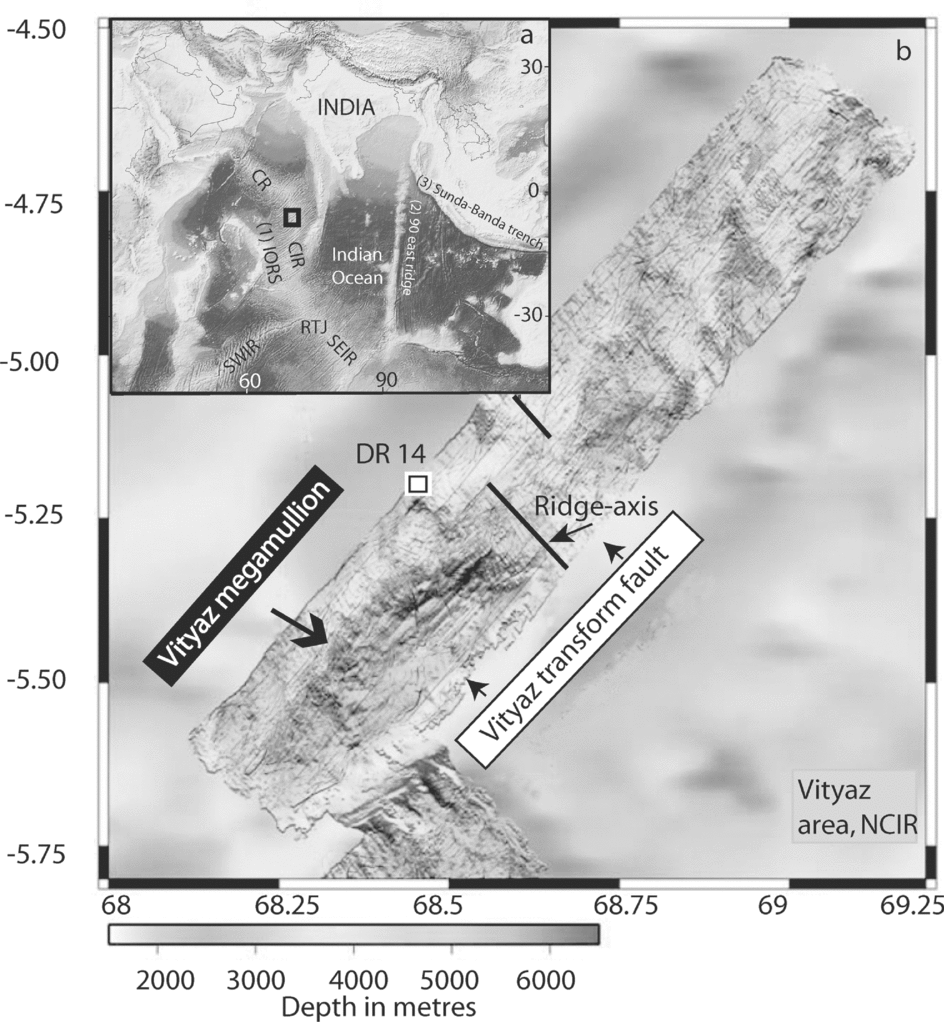
The most well-studied gabbro of the Indian Ocean Ridge System (Fig. 1) is from ODP Leg 118 from the SWIR (Dick et al. Reference Dick, Ozawa, Meyer, Niu, Robinson, Constantin, Hebert, Maeda, Natland, Hirth, Mackie, Natland, Dick, Miller and Von Herzen2002; Coogan et al. Reference Coogan, Macleod, Dick, Edwards, Kvassnes, Natland, Robinson, Thompson and O'Hara2001). Gabbro from Leg 176 (ODP Hole 735B from Atlantis II fracture zone, Dick et al. Reference Dick, Natland, Alt, Bach, Bideau, Gee, Haggas, Hertogen, Hirth, Holm, Ildefonse, Iturrino, John, Kellet, Kikawa, Kingdom, Leroux, Maede, Meyer, Miller, Naslund, Niu, Robinson, Snow, Stephen, Trimy, Worm and Yoshinobu2000) and Leg 179 (Hole 1105A) near Leg 118 have also been studied extensively (Thy, Reference Thy, Casey and Miller2003). Data from the above-mentioned sites suggest that generation of oceanic crust through the SWIR took place by the continuous intrusion and reintrusion of numerous, small, rapidly crystallized magma bodies together with complex interaction of magmatic, tectonic and hydrothermal processes (Dick, Robinson & Meyer, Reference Dick, Robinson, Meyer, Duncan, Rea, Weissel, von Rad and Kidd1992). More recent studies on gabbroic rocks from Leg 179 (Hole 1105A) report the presence of both oxide-bearing and oxide-free olivine gabbro and gabbro (Casey, Banerji & Zarian, Reference Casey, Banerji, Zarian, Casey and Miller2007). These gabbros of cumulate origin show well-layered structure and significant numbers of mappable layer contacts or compositional contacts. The extent of fractionation represented by the gabbroic rocks and scarce granophyres in the section is much greater than that represented in the Atlantis II basalt. The oxide phases are generally present in the more fractionated gabbroic rocks and absent in the more primitive gabbro members. Previously studied gabbroic rocks from the Central Indian Ridge have been recovered mostly from major transform faults, such as the Vema, Argo and Marie Celeste faults (Engel & Fisher, Reference Engel and Fisher1975; Bloomer, Natland & Fisher, Reference Bloomer, Natland, Fisher, Saunders and Norry1989). The heterogeneous textures and mineralogy and the distribution of gabbros in the Indian Ocean fracture zones indicate that many of them formed in small dykes or sills, rather than in large open magma chambers (Bloomer, Natland & Fisher, Reference Bloomer, Natland, Fisher, Saunders and Norry1989). Pulses of magma passing through such small dykes or sills may represent the ascent of a magma pulse of primitive nature from the mantle over a long period of time, or the ascent of several primitive magma batches separated in space and time (Bloomer, Natland & Fisher, Reference Bloomer, Natland, Fisher, Saunders and Norry1989).
(a) Sketch map of Indian Ocean showing position of Indian Ocean Ridge System (IORS) (1), 90°E ridge (2), and Sunda–Banda trench (3); (b) enlarged view of the box area in (a) showing multibeam map of the ‘Vityaz megamullion’ (after Drolia & DeMets, Reference Drolia and DeMets2005). Dredge location has been shown as DR 14. Symbols: CR – Carlsberg Ridge; CIR – Central Indian Ridge; RTJ – Rodriguez triple junction; SWIR – Southwest Indian Ridge; SEIR – Southeast Indian Ridge.

The focus of the present paper is on the geochemistry of gabbros collected from the Northern Indian Ocean Ridge (NCIR) at 5°S–68°E (Fig. 1). The chain-bag dredging technique was used to collect these samples where the water column depth was ~ 3000 m. As the geochemistry of oceanic gabbro from NCIR is not adequately represented in the literature, their whole-rock analyses along with their petrographic and mineralogical descriptions are presented for the first time in this paper. One of the important objectives of this paper is to examine the possible petrogenetic relationship between the NCIR basalts (Ray et al. Reference Ray, Iyer, Banerjee, Misra and Widdowson2007) and these gabbros, which may be of three types: (a) the gabbros may be the pre-existing cumulate phase that are brought to the shallower level of oceanic crust and reacted with the NCIR basalt (cf. Lissenberg & Dick, Reference Lissenberg and Dick2008); (b) the present gabbro may be the cumulate phase derived during fractionation of the NCIR parent magma; or (c) the gabbros may have a different magmatic history and are genetically related to the gabbroic rocks occurring along transform faults.
Basalts generated at the Indian Ocean ridge have long been known to have isotopic compositions distinct from the Atlantic and Pacific MORBs (e.g. Subbarao & Hedge, Reference Subbarao and Hedge1973; Dupré & Allègre, Reference Dupré and Allègre1983). The Indian Ocean basalts are characterized by relatively high87Sr/86Sr (0.702733–0.703383) and low 206Pb/204Pb (17.898–18.839) (Mahoney et al. Reference Mahoney, Natland, White, Poreda, Bloomer, Fisher and Baxter1989), particularly for a given 143Nd/144Nd, 207Pb/204Pb or 208Pb/204Pb value, compared to those of the Atlantic and Pacific MORBs (e.g. Price et al. Reference Price, Kennedy, Riggs-Sneeringer and Frey1986; Dosso et al. Reference Dosso, Bougault, Beuzart, Calvez and Joron1988; Mahoney et al. Reference Mahoney, Natland, White, Poreda, Bloomer, Fisher and Baxter1989). The origin of these isotopic signatures has long been a source of controversy, having been variously attributed to addition of plume material, deeply recycled pelagic sediments, subduction modified mantle wedge material and/or the addition of continental lithosphere to the Indian Ocean upper mantle (e.g. Mahoney et al. Reference Mahoney, Natland, White, Poreda, Bloomer, Fisher and Baxter1989; Rehkamper & Hofmann, Reference Rehkamper and Hofmann1997; Kempton et al. Reference Kempton, Pearce, Barry, Fitton, Langmuir and Christie2002; Hanan et al. Reference Hanan, Blichert-Toft, Pyle and Christie2004). To explore these possibilities, we also measure the Pb, Sr and Nd isotope ratios of two NCIR gabbro samples to evaluate any possible input in the mantle reservoir (as in the Indian Ocean MORB: Rehkamper & Hoffman, Reference Rehkamper and Hofmann1997) during the gabbro genesis.
2. Regional geomorphology
The ocean bottom morphology of the present sampling area (Fig. 1) is described in detail in Drolia & DeMets (Reference Drolia and DeMets2005). The morphological features close to the inner northeastern corner of the Vityaz transform fault (Fig. 1b) include an elongated domal high with well-expressed ridge-perpendicular corrugations. The megamullion rises from the ~ 4700 m deep rift axis to a depth of ~ 2300 m over a distance of 9 km with an inward-facing slope of 20°. At a distance beyond ~ 13 km from the ridge axis the slope reverses and the surface of the megamullion tilts gently (1.5°) away from the spreading axis. Although the Vityaz megamullion has been interpreted as an active detachment fault within the relatively poorly magmatic spreading segments at the NCIR (Drolia & DeMets, Reference Drolia and DeMets2005), recent studies show that late stage volcanism, as found in the present case, plays an important role in the accretionary processes (cf. Morishita et al. Reference Morishita, Hara, Nakalura, Sawaguchi, Tamura, Arai, Okino, Takai and Kumagai2009). The active detachment surface of the Vityaz megamullion facilitated extension and enhanced magma intrusion periodically within the relatively magma-starved ridge segments (cf. Ildefonse et al. Reference Ildefonse, Blackman, John, O'Hara, Miller and Macleod2007). Such a possibility of gabbroic intrusion also cannot be ruled out in the present case.
The seafloor fabric in the study area is mostly dominated by abyssal hills and transform-parallel lineation, although some disturbed seafloor fabrics flanking the spreading segment immediately north of the Vityaz transform fault are also present (Drolia et al. Reference Drolia, Iyer, Chakraborty, Kodagali, Ray, Misra, Andrade, Sarma, Rajasekhar and Mukhopadhyay2003). The half spreading rate of the present location varies from 18 to 22 mm yr−1 (Drolia et al. Reference Drolia, Iyer, Chakraborty, Kodagali, Ray, Misra, Andrade, Sarma, Rajasekhar and Mukhopadhyay2003), typical for a slow-spreading crust. The perpendicular distance of the present study area from the nearest NCIR axis (Fig. 1b) is ~ 7.4 km. At the assumed half spreading rate (18 mm yr−1), the oceanic crust in the present area has an estimated age of ~ 0.4 Ma. This perhaps indicates the maximum age limit of the gabbro body under study if it occurs as an intrusive dyke or sill (cf. Bloomer, Natland & Fisher, Reference Bloomer, Natland, Fisher, Saunders and Norry1989).
3. Sampling and analytical techniques
The present dredge location was situated at the northeastern corner of the ‘Vityaz megamullion’, adjacent to the non-transform discontinuity (Fig. 1b). The chain-bag dredge technique was used to collect the rock samples, and the operation was carefully monitored by single beam as well as multi-beam swath bathymetry during sampling. The chain-bag dredge was deployed about ~ 7.5 km away from the axial valley adjacent to the ‘Vityaz megamullion’. The precise navigational data on the time and position of the operation were recorded by onboard Global Positioning System.
In our chain-bag dredge recovery, gabbro was the principal rock type (~ 80 %). Other types included only altered basalts (~ 20 %), which are not considered in the present study. In hand specimen study, the gabbro samples look very fresh, hard and compact. The major mineral phases of the gabbro (plagioclase, olivine and clinopyroxene) were analysed using an electron microprobe with wave-length dispersive spectrometers (CAMECA SX 100) at the Central Petrological Laboratory, Geological Survey of India, Kolkata, India. The analytical conditions were: operating voltage 15 kV, sample current 12 nA, beam diameter 5 μm, and analysis duration for each element 10 sec. All calibrations were made using natural standards supplied by BRGM (Bureau de recherches géologiques et minières, France), except for Mn and Ti for which synthetic standards were used. The obtained data were corrected internally using the matrix correction procedure of Pouchou & Pichoir (Reference Pouchou, Pichoir and Newbury1988) (PAP correction).
The samples for the whole-rock chemical analyses were ground to a 200 mesh size using a tungsten carbide ring mill following the procedure of Balaram, Gnaneshwara Rao & Anjaiah (Reference Balaram, Gnaneshwara Rao and Anjaiah1999). The major element analyses of whole rock samples were carried out at the XRF laboratory, National Geophysical Research Institute, Hyderabad, India, using powdered homogeneous samples in pellet form. For XRF studies a Philips Magix XRF spectrometer PRO model PW2440 has been used in wavelength dispersive mode. The uncertainties of our analyses were better than ± 0.02 wt % on pressed powder pellets. The accuracy and precision of our XRF analyses as observed on the international rock standard, the ‘Mount Royal Gabbro, Canada’ (MRG-1), were better than 5 %, except for Mn and P for which the values are better than 8 % due to their low abundances. All trace elements including REE were analysed from the same sample powders using ICP-MS (model ELAN DRC II, PerkinElmer Sciex Instruments, USA) at the National Geophysical Research Institute, Hyderabad, India, using methods described in Balaram, Gnaneshwara Rao & Anjaiah (Reference Balaram, Gnaneshwara Rao and Anjaiah1999). The accuracy and precision of measurements of these trace elements for international rock standard MRG-1 were better than ± 5 %.
The Sr, Pb and Nd isotopic analyses were performed at the Pacific Centre for Isotope Research, Canada, using methods described by Weis et al. (Reference Weis, Kieffer, Maerschalk, Pretorius and Barling2005, Reference Weis, Kieffer, Maerschalk, Barling, De Jong, Williams, Hanano, Pretorius, Mattielli, Scoates, Goolaerts, Friedman and Mahoney2006, Reference Weis, Kieffer, Hanano, Silva, Barling, Pretorius, Maerschalk and Mattielli2007). All the samples were carefully leached to remove all possible secondary alteration phases, following the method described by Weis & Frey (Reference Weis and Frey1996) and by Nobre-Silva et al. (Reference Nobre Silva, Weis, Barling and Scoates2009). The standard analyses during the course of this study gave: 87Sr/86Sr = 0.710249 ± 14 (n = 7) for NBS987 (TIMS Finnigan Triton); 143Nd/144Nd = 0.511869 ± 18 for La Jolla Nd (MC-ICP-MS Nu Instruments), normalized to Rennes 143Nd/144Nd = 0.511973 (n = 25), 206Pb/204Pb = 16.9398 ± 24, 207Pb/204Pb = 15.4953 ± 19 and 207Pb/204Pb = 36.7095 ± 46 (n = 11) for SRM 981 (MC-ICP-MS Nu Instruments). For the MC-ICP-MS analyses, the measured results were normalized to the standard values on the basis of the mean of the day for Nd and by the ln–ln method for Pb, relative to the triple spike values of Galer & Abouchami (Reference Galer and Abouchami1998).
4. Petrography
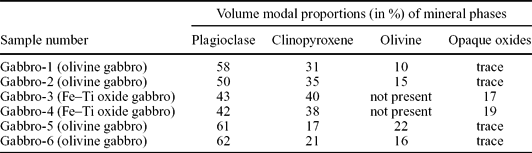
The NCIR gabbros, in general, are coarse-grained rocks exclusively composed of plagioclase, olivine, clinopyroxene and Fe–Ti oxide (ilmenite and/or magnetite) in variable proportions. Depending on the modal proportions of the constituent minerals (Table 1), the gabbroic rocks can primarily be classified into two broad groups: (a) olivine gabbro and (b) Fe–Ti oxide gabbro.
Modal analyses of NCIR gabbro

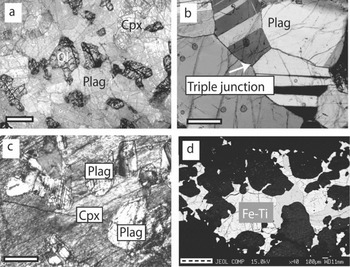
Most of the olivine gabbro shows typically ophitic to subophitic texture, with the early formed plagioclase crystals in mutual contact with each other and the late formed olivine and clinopyroxene grains occupying interstitial spaces (Fig. 2a). The plagioclase crystals also show triple junctions among three grain boundaries (Fig. 2b). This textural observation suggests a cumulate origin of the gabbro (cf. Irvine, Reference Irvine1982; Winter, Reference Winter2001). The interstitial clinopyroxenes sometimes contain partially digested subhedral prismatic plagioclase (Fig. 2c). Plagioclase, the most common mineral phase, occurs as subhedral tabular grains (0.7 to 6.3 mm in size) with well-developed twin lamellae. Olivine (0.5 to 3.7 mm in size) is the next most dominant mineral and is intensively fractured, with alteration stains (reddish brown in colour) sometimes present along inherent fractures. In places olivine contains partial or complete inclusions of plagioclase and clinopyroxene. The degree of alteration present along the fractures within the olivine varies between 5 and 10 %. In comparison, plagioclase and clinopyroxene are almost alteration-free. Under the microscope, all of our studied samples are fresh and show practically no seawater alteration.
Photomicrographs of Vityaz gabbros: (a) olivine gabbro in plane polarized light showing ophitic or subophitic texture; note interstitial olivine (Ol) and clinopyroxene (Cpx) within plagioclase (Plag) grains that are in mutual contact; scale bar: 1 mm; (b) plagioclase in olivine gabbro showing triple junction; (c) digested plagioclase (Plag) within interstitial clinopyroxene (Cpx); (d) BSE image of Fe–Ti oxide gabbro showing subhedral equant Fe–Ti oxides. Scale bars for (b, c, d) are 0.5 mm.

The Fe–Ti oxide gabbro contains considerable proportions of Fe–Ti oxides in addition to plagioclase and clinopyroxene. The Fe–Ti oxides mostly occur as disseminated grains or sometimes as bands alternating with feldspar and clinopyroxene-rich layers (Fig. 2d). A third and rare variety is microgabbro or fine-grained gabbro, which is principally composed of equigranular plagioclase and less abundant clinopyroxene grains. In addition to the fine grain size, the microgabbro differs from the olivine gabbro by the conspicuous absence of olivine.
Lissenberg & Dick (Reference Lissenberg and Dick2008) recently pointed out a possibility that some oceanic gabbros might be pre-existing gabbros that have reacted with migrating melts. This type of gabbro typically shows poikilitic texture with abundant high Mg no. (86–91) clinopyroxene, which occurs as oikocrysts enclosing olivine and resorbed plagioclase. In this type of melt–rock interaction, gabbro xenoliths contain quenched glass pockets (Gurenko & Sobolev, Reference Gurenko and Sobolev2006). In the Bay of Islands ophiolite, extensive disaggregation and mixing between gabbros and invading magmas was noticed that produced a range of hybrid rocks (Bédard, Reference Bédard1991; Bédard & Hebert, Reference Bédard and Hebert1996; Bédard et al. Reference Bédard, Hebert, Berclaz, Barfalvy, Dilek, Moores, Eltohn and Nicolas2000). Our gabbro samples, however, are dominated by ophitic to subophitic texture (Fig. 2a), and no poikilitic clinopyroxene is seen under the microscope. Neither any evidence of quenched glass pockets nor any petrological evidence of mixing between our gabbro and invading melt is observed in our sample population. Thus the hand specimen and textural evidence do not suggest a pre-existing cumulate origin for our gabbro samples. Gabbro xenoliths in MORB from the East Pacific Rise show textural features of extensive melt–rock interaction, and it has been suggested that this interaction plays an active role underneath the East Pacific Rise (Ridley et al. Reference Ridley, Perfit, Smith and Fornari2006). Our collected samples of NCIR basalts, however, do not show any xenolithic gabbro in hand specimen or any petrographic evidence of melt–rock interaction (Ray et al. Reference Ray, Iyer, Banerjee, Misra and Widdowson2007). Therefore, it can be concluded that melt–rock interaction is perhaps not important in the evolution of the NCIR MORBs.
5. Analytical data
5.a. Mineral chemistry
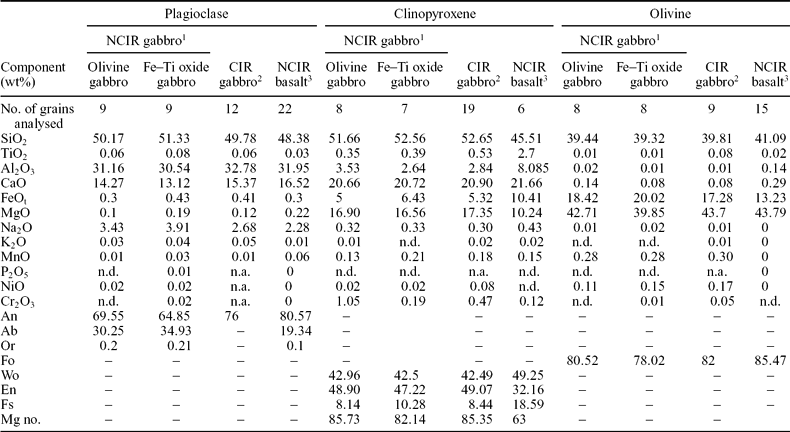
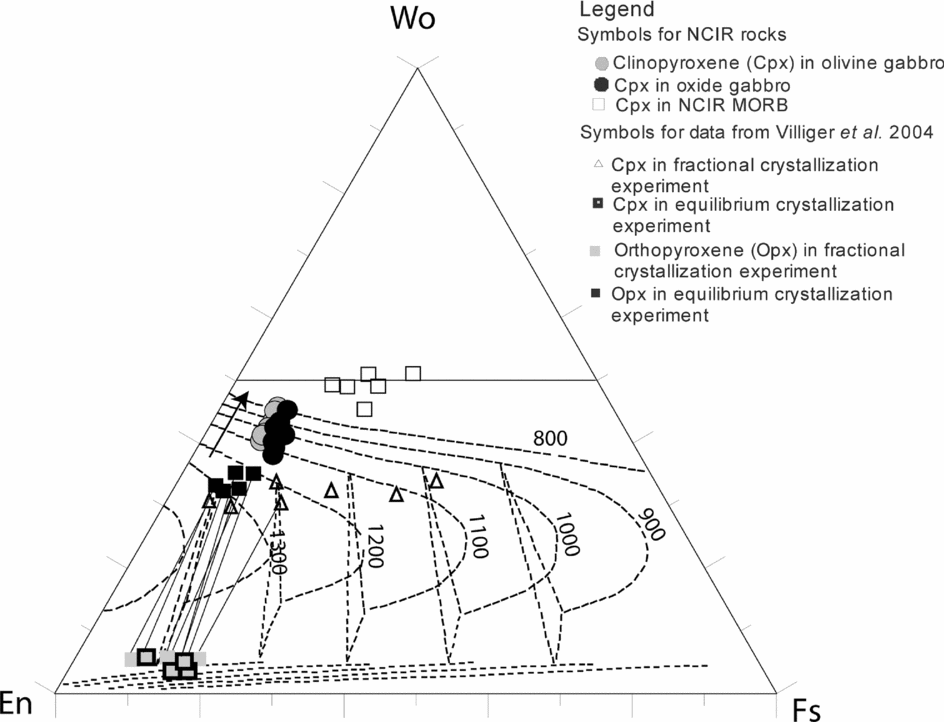
Selected microprobe analyses of different mineral phases of the NCIR olivine gabbro are given in Table 2 (and Appendix Tables A1–A3, available at http://multimediafluids.uam.elogim.com/journals/geo), along with analyses from NCIR basalts for comparison. The unzoned olivines of the olivine gabbro show uniformity in composition with ~ Fo80–81 compared to the olivine phenocrysts of NCIR basalt (Fo81–88). There are no notable variations between the core and rim of olivine (core~ Fo80 and rim~ Fo78). The plagioclase in olivine gabbro shows restricted compositional variation between An67 and An75 which overlaps with the lower range of composition of plagioclase phenocrysts in the NCIR basalts (An63 to An88). The clinopyroxenes of the olivine gabbros have a composition of Wo40–45En48–52Fs8–9 and plot in the augite field of pyroxene quadrilateral, with a limited linear Ca-enrichment trend that is sub-parallel to the En–Di join (Fig. 3). On the other hand, the clinopyroxenes of the NCIR basalts have an average composition of Wo49En32Fs19 and show a limited Fe-enrichment trend parallel to the Di–Hd join within the diopside field. The Mg no. [100 × mol Mg/(mol Mg + mol Fe2+)] of the clinopyroxene from gabbro exhibits a restricted variation between 87 and 85, while those from the NCIR basalts show a wide variation from 73 to 51 (Table 2).
Comparative average chemistry of plagioclase, clinopyroxene and olivine of NCIR gabbro, NCIR basalt and CIR gabbro

Mg no. = 100 × mol Mg/(mol Mg + mol Fe2+)
n.d. – not determined
1Present study data from Appendix Tables A1, A2 and A3, available online at http://multimediafluids.uam.elogim.com/journals/geo
2Data from Bloomer, Natland & Fisher, Reference Bloomer, Natland, Fisher, Saunders and Norry1989
3Unpublished data of the first author (D. Ray).
Plots of clinopyroxenes of NCIR gabbros in molar wollastonite (Wo)–enstatite (En)–ferrosilite (Fs) (pyroxene) ternary diagram; data from Appendix Table A3 at http://multimediafluids.uam.elogim.com/journals/geo. The pyroxene compositions obtained during fractional and equilibrium crystallization experiments on primitive mantle-derived tholeiitic basalt at 1.0 GPa (Villiger et al. Reference Villiger, Ulmer, Muntener and Thompson2004) and unpublished clinopyroxene data of NCIR basalts of first author (D.R.) are also shown for comparison. Coexisting clinopyroxene and orthopyroxene compositions of Villiger et al. (Reference Villiger, Ulmer, Muntener and Thompson2004) are connected with tie lines.

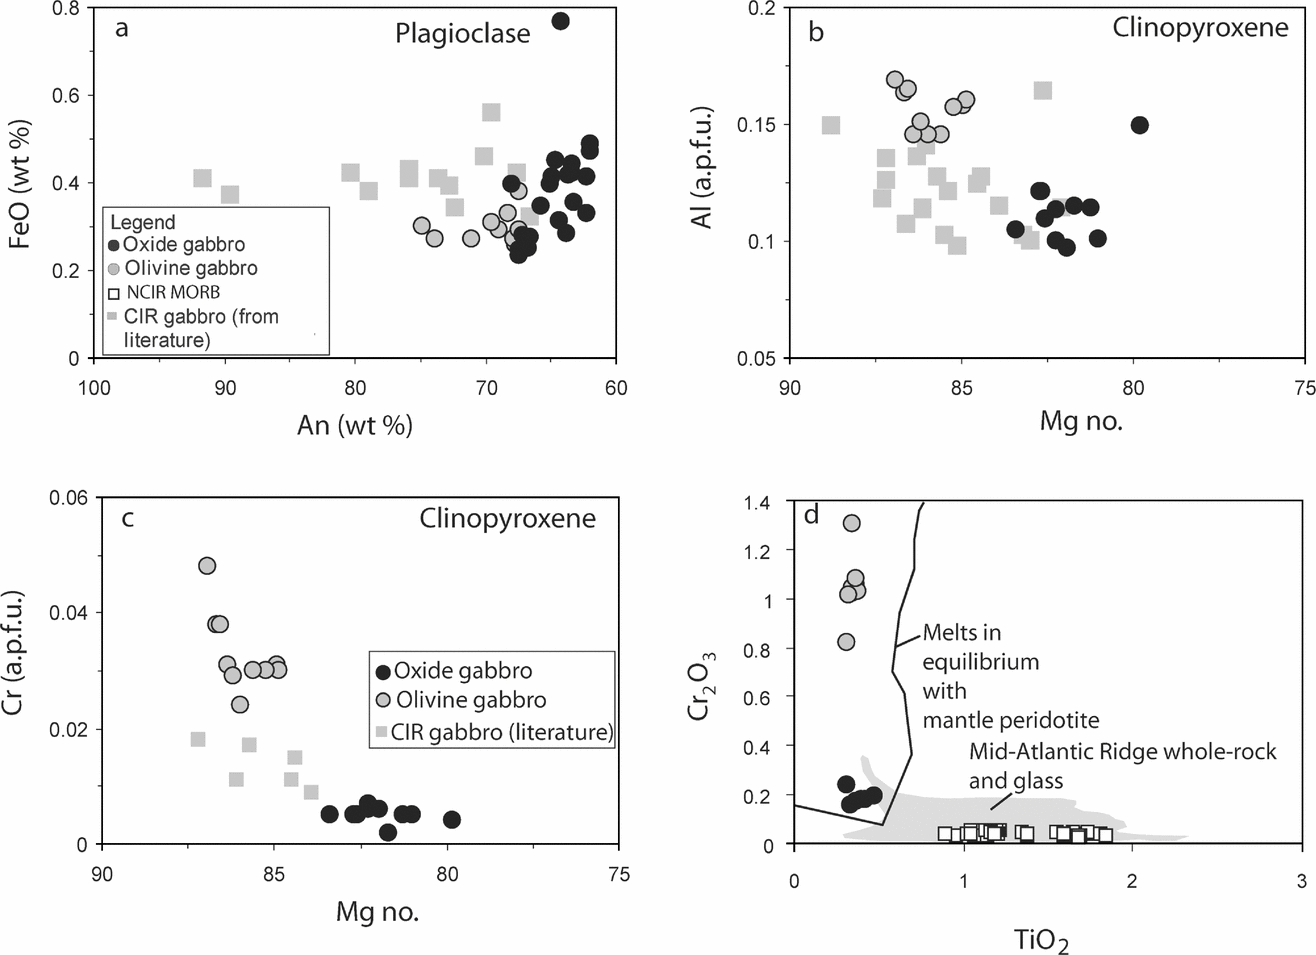
The olivines in Fe–Ti oxide gabbro (Fo78–80) are marginally Fo-poor in average in comparison to those of olivine gabbro (Fo80–81) and NCIR basalt (Fo81–88) (Table 2). The plagioclase and clinopyroxene of the Fe–Ti oxide gabbro overlap in composition with those of olivine gabbro (Fig. 3). The plagioclase of the Fe–Ti oxide gabbro contains marginally higher FeOtotal (~ 0.13 wt % in average) compared to those of the olivine gabbro and is comparable to those of the CIR gabbro of Bloomer, Natland & Fisher (Reference Bloomer, Natland, Fisher, Saunders and Norry1989) (Table 2, Fig. 4a). One of the plagioclase analyses (Appendix Table A2 at http://multimediafluids.uam.elogim.com/journals/geo, sample number Gabbro-3f) shows the presence of relatively high FeOt (0.77 wt %), which could be due to a relatively high proportion of replacement of Al by Fe3+ ions in the plagioclase structure (cf. Deer, Howie & Zussman, Reference Deer, Howie and Zussman1992). The clinopyroxenes of the Fe–Ti oxide gabbro, CIR gabbro of Bloomer, Natland & Fisher (Reference Bloomer, Natland, Fisher, Saunders and Norry1989) and olivine gabbro together show linear and curvilinear decreasing trends of variations in Mg no. versus Al a.p.f.u. (atoms power formula unit) and Cr, respectively, where clinopyroxenes from the Fe–Ti gabbro and olivine gabbro always represent the most and the least evolved member, respectively, along these trends (Fig. 4b, c).
Binary plots for mineral chemical compositions of NCIR gabbro: (a) plagioclase in An (wt %) versus FeOtotal (wt %) plot; (b) clinopyroxene in Mg no. versus Al (a.p.f.u.) (atomic power formula unit) plot; (c) clinopyroxene in Mg no. versus Cr (a.p.f.u.) plot; (d) TiO2 versus Cr2O3 plot (after Lissenberg & Dick, Reference Lissenberg and Dick2008) showing clinopyroxenes of NCIR gabbro are in equilibrium with melt that co-exists with mantle peridotite. Symbols: filled grey circle – plagioclase/pyroxene from olivine gabbro; filled black circle – plagioclase/pyroxene from oxide gabbro (data from Appendix Tables A2, A3 at http://multimediafluids.uam.elogim.com/journals/geo); filled grey square – plagioclase/pyroxene from CIR gabbro (Bloomer, Natland & Fisher, Reference Bloomer, Natland, Fisher, Saunders and Norry1989) and open square – NCIR MORB (Ray et al. Reference Ray, Iyer, Banerjee, Misra and Widdowson2007) for comparison.

The compositions of pyroxenes of the NCIR gabbros and basalts are compared with the experimental pyroxene compositions of Villiger et al. (Reference Villiger, Ulmer, Muntener and Thompson2004) obtained during fractional and equilibrium crystallization of primitive, mantle-derived tholeiitic basalt at 1.0 GPa (Fig. 3). A comparison of our samples with the above experimental work (Villiger et al. Reference Villiger, Ulmer, Muntener and Thompson2004) is reasonable because the primitive NCIR parent basaltic magma is found to have evolved at a pressure of ~ 1 GPa (Ray et al. Reference Ray, Iyer, Banerjee, Misra and Widdowson2007). Our least evolved clinopyroxene of the NCIR gabbro lies close in composition to the clinopyroxenes of Villiger et al. (Reference Villiger, Ulmer, Muntener and Thompson2004), and our clinopyroxenes are found to have evolved between temperatures of 1200 and 900 °C when compared with the isotherms on the pyroxene quadrilateral after Lindsley (Reference Lindsley1983). The trend of clinopyroxenes of the NCIR basalt, on the other hand, is parallel to the trend of clinopyroxene of Villiger et al. (Reference Villiger, Ulmer, Muntener and Thompson2004) obtained during their fractional crystallization experiment, although these pyroxenes are systematically Ca-enriched. The clinopyroxenes of NCIR basalt evolved at a relatively low temperature of ≤ 800 °C.
Our additional evidence against the origin of the clinopyroxenes of the olivine and oxide gabbros by melt–rock interaction (cf. Lissenberg & Dick, Reference Lissenberg and Dick2008) is shown in the TiO2 versus Cr2O3 plot (Fig. 4d). In this diagram, the clinopyroxenes of the olivine and oxide gabbros occur in the field of the primitive melts that is in equilibrium with mantle peridotite. The clinopyroxenes of the olivine gabbros and oxide gabbros have nearly the same TiO2 contents (~ 0.35 wt %), but the former has much higher Cr2O3 (~ 1 wt % in average) compared to the latter (~ 0.19 wt %). The clinopyroxenes of olivine gabbros define a linear trend on which the clinopyroxenes of oxide gabbros are plotted. This plot therefore suggests a cogenetic relationship of clinopyroxene from olivine and oxide gabbros and crystallization of these clinopyroxenes from mantle-derived primary magma rather than their formation by any melt–rock interaction as suggested by Lissenberg & Dick (Reference Lissenberg and Dick2008).
5.b. Whole rock chemistry
5.b.1. Major element chemistry
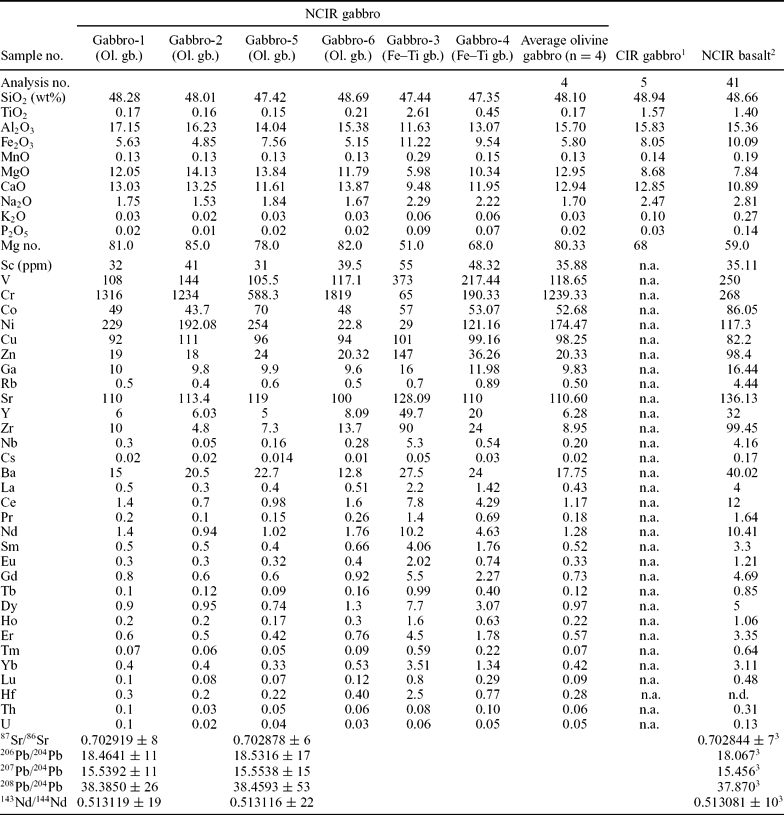
The major and trace element compositions along with the Sr, Pb and Nd isotopic ratios of the present NCIR gabbro are shown in Table 3. The Mg no. of the olivine gabbro samples vary over a range of ~ 85 to 78, while the Fe–Ti oxide samples have lower values of 68 and 51 (Fig. 6). In comparison, the early reported CIR gabbros, collected from the Vema, Argo and Marie Celeste TF and ANTP 125–8 sites, have comparable compositions, except for one sample with very low Mg no. (~ 39) (Engel & Fisher, Reference Engel and Fisher1975).
Major oxides, trace element and Sr, Pb and Nd isotopic data of the NCIR gabbro; available chemical data of the CIR gabbro and NCIR basalts are given for comparison

Ol. gb. – Olivine gabbro, Fe–Ti gb. – Fe–Ti oxide gabbro, n.a. – not available
1Data from Engel & Fisher (Reference Engel and Fisher1975) and Dmitriv & Sharaskin (1975)
2Ray et al. (Reference Ray, Iyer, Banerjee, Misra and Widdowson2007)
3Sample no. 33 Dr (table 1 of Rehkamper & Hofmann, Reference Rehkamper and Hofmann1997)
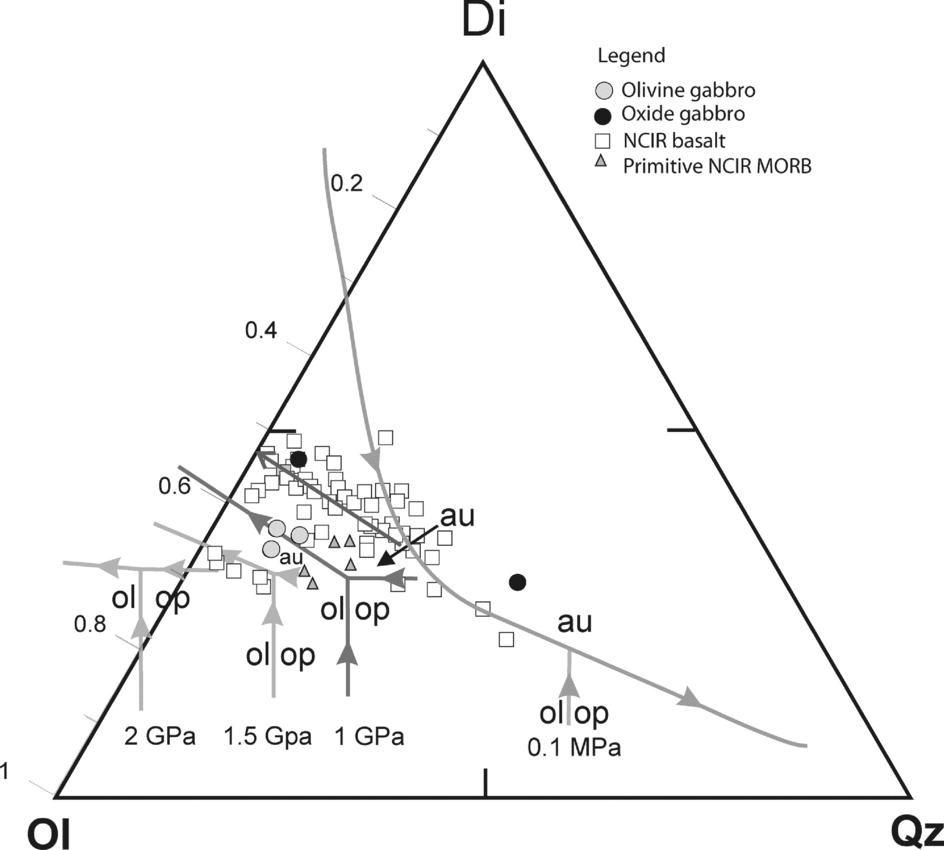
The possible liquid line of descent between the present gabbro (cumulates) and NCIR basalt is also examined in the normative olivine–diopside–silica diagram projected from the plagioclase apex (after Walker, Shibata & Delong, Reference Walker, Shibata and Delong1979) (Fig. 5). The evolved NCIR basalts, having Mg no. < 0.68, plot on a linear trend, which is parallel to the 1 GPa cotectic line between the Di and Ol fields but within the Di field. The olivine gabbro samples show a point concentration of data on the Ol–Di cotectic line at 1 GPa, but two samples of oxide gabbro show wide scatter in plot. Neither the gabbro nor the NCIR basalts (Mg no. < 0.68) describe any liquid line of descent in this diagram, indicating their non-cogenetic origin.
Plot of primary and fractionated NCIR basalts (data from Ray et al. Reference Ray, Iyer, Banerjee, Misra and Widdowson2007 and our unpub. data), and NCIR olivine gabbro and oxide gabbro (data from Table 3) in CIPW normative Olivine (Ol)–Diopside (Di)–Quartz (Qz) diagram projected from plagioclase apex (after Walker et al. Reference Walker, Shibata and Delong1979). Symbols: filled grey triangle – NCIR primary basalt; open square – NCIR basalt; filled grey circle – olivine gabbro; filled black circle – oxide gabbro.

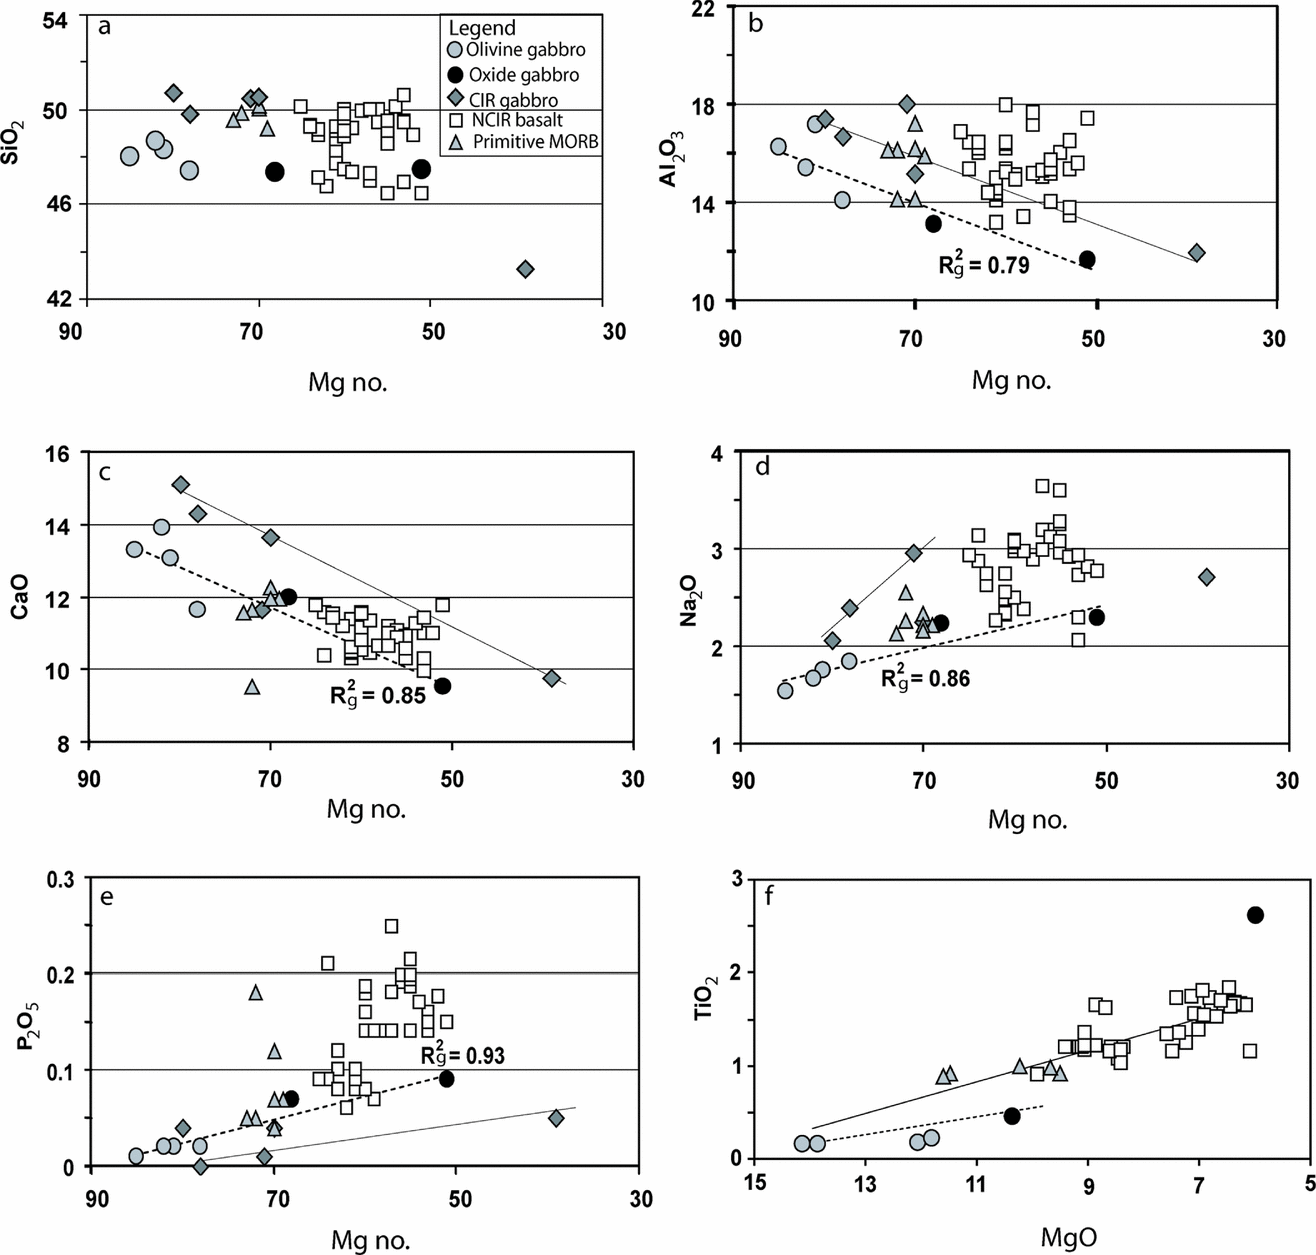
The major oxide variations between NCIR gabbros and basalts are also examined in Mg no. versus major oxide bivariant plots (Fig. 6). The variations of SiO2 for both the olivine and Fe–Ti oxide gabbros as well as the NCIR basalts are very restricted between ~ 46 and 50 wt % and are independent of any variation of Mg no. (Fig. 6a). In the major element binary plots against Mg no., significant and systematic variations are observed only for Al2O3 and CaO. Distinctly different but parallel decreasing trends are observed for Al2O3 and CaO with decreasing Mg no. for the present gabbro and the CIR gabbro (Engel & Fisher, Reference Engel and Fisher1975), where the CIR gabbros always have higher oxide values with reference to the same Mg no. (Fig. 6b, c). In the Mg no. versus CaO plot, the trend of the gabbro is linear, although some scatter of data is also seen, which is possibly related to the variation in An content in plagioclase in our studied samples. The NCIR basalts along with their primitive members show a distinct cluster in the Mg no. versus Al2O3 plot, right above the linear trends defined by these two sets of gabbro samples. In the Mg no. versus CaO plot, the average linear trend defined by the NCIR basalt is parallel to those of the present and CIR gabbros and lies in between them. In the Mg no. versus Na2O and P2O5 plots, the gabbroid rocks define moderately increasing linear trends with decreasing Mg no. (Fig. 6d, e). The CIR gabbro (Engel & Fisher, Reference Engel and Fisher1975), for comparison, defines different trends in both these diagrams. Most of the CIR gabbro has relatively high Na2O and low P2O5 compared to the present gabbro with reference to the same Mg no. The NCIR basalts have a tendency to cluster above the present gabbro trends. The available primitive NCIR N-MORB (Mg no. > 0.68: Ray et al. Reference Ray, Iyer, Banerjee, Misra and Widdowson2007) also forms clusters in these diagrams that are not overlapping with the fields of the NCIR basalt. In MgO versus TiO2 plot, the NCIR basalts and most of the present gabbro samples (except Gabbro-3 in Table 3) show linear increasing trends of varying slope with decreasing MgO (Fig. 6f). Different linear trends in the entire major oxide variation diagrams for the limited numbers of present gabbro and the CIR gabbro (Engel & Fisher, Reference Engel and Fisher1975) (Fig. 6) primarily suggest that these two plutonic igneous rocks have different liquid lines of descent. The NCIR basalts also do not show any genetic relationship with either of the gabbroic rocks (Figs 5, 6).
Binary major oxide plots for NCIR gabbro and basalt in Mg no. versus (a) SiO2, (b) Al2O3, (c) CaO, (d) Na2O and (e) P2O5, and (f) MgO v. TiO2 plots; Mg no. – 100 × mol Mg/(mol Mg + mol Fe2+). Symbols: filled grey circle – olivine gabbo; filled black circle – oxide gabbro (data from Table 3); open square – NCIR basalt (Ray et al. Reference Ray, Iyer, Banerjee, Misra and Widdowson2007 and unpub. data); filled grey diamond – CIR gabbro (Engel & Fisher, Reference Engel and Fisher1975); filled grey triangle – primitive NCIR MORB (Pluger et al. Reference Pluger1989).

5.b.2. Trace element chemistry
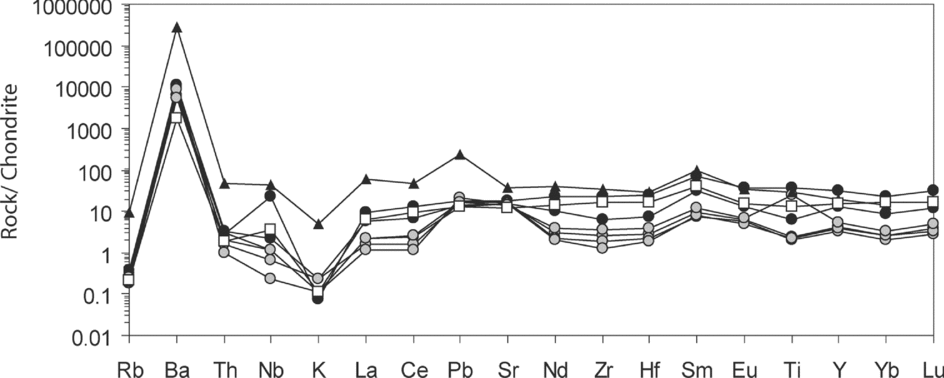
The CI-chondrite normalized (after McDonough & Sun, Reference McDonough and Sun1995) incompatible trace element chemistry of the NCIR gabbro and basalt is illustrated in a spidergram (Fig. 7). The olivine gabbros are mostly depleted in REE (La, Ce, Yb, Lu) and HFS elements (Nb, Nd, Zr, Hf) compared to the average NCIR N-MORB. The oxide gabbros, on the other hand, are less depleted and more MORB-like. Some of the LIL elements (Rb, K) in the gabbros have comparable abundances to that of the average NCIR MORB. Additionally, all the gabbros are uniformly enriched in Ba (~ 5 to 6 times NCIR MORB) and have variable Nb (~ 0.02 to 3 times NCIR MORB). The absence of any complementary incompatible element geochemistry between the NCIR gabbro and the average NCIR N-MORB in general, therefore, does not favour any model of crystal fractionation for the generation of these two igneous rocks from a common parent magma.
Normalized multi-element plot (normalized to chondrite, after McDonough & Sun, Reference McDonough and Sun1995) of NCIR gabbro (data from Table 3); average NCIR MORB (Ray et al. Reference Ray, Iyer, Banerjee, Misra and Widdowson2007) and Indian Ocean pelagic sediment (Carlo, Reference Carlo De, Wilkens, Firth and Bender1993; sample no. 1H-2, 145–150, Leg 136) are shown for comparison. Symbols: filled grey circle – olivine gabbro; filled black circle – oxide gabbro; open square – average NCIR N-MORB; black filled triangle – average pelagic sediment.

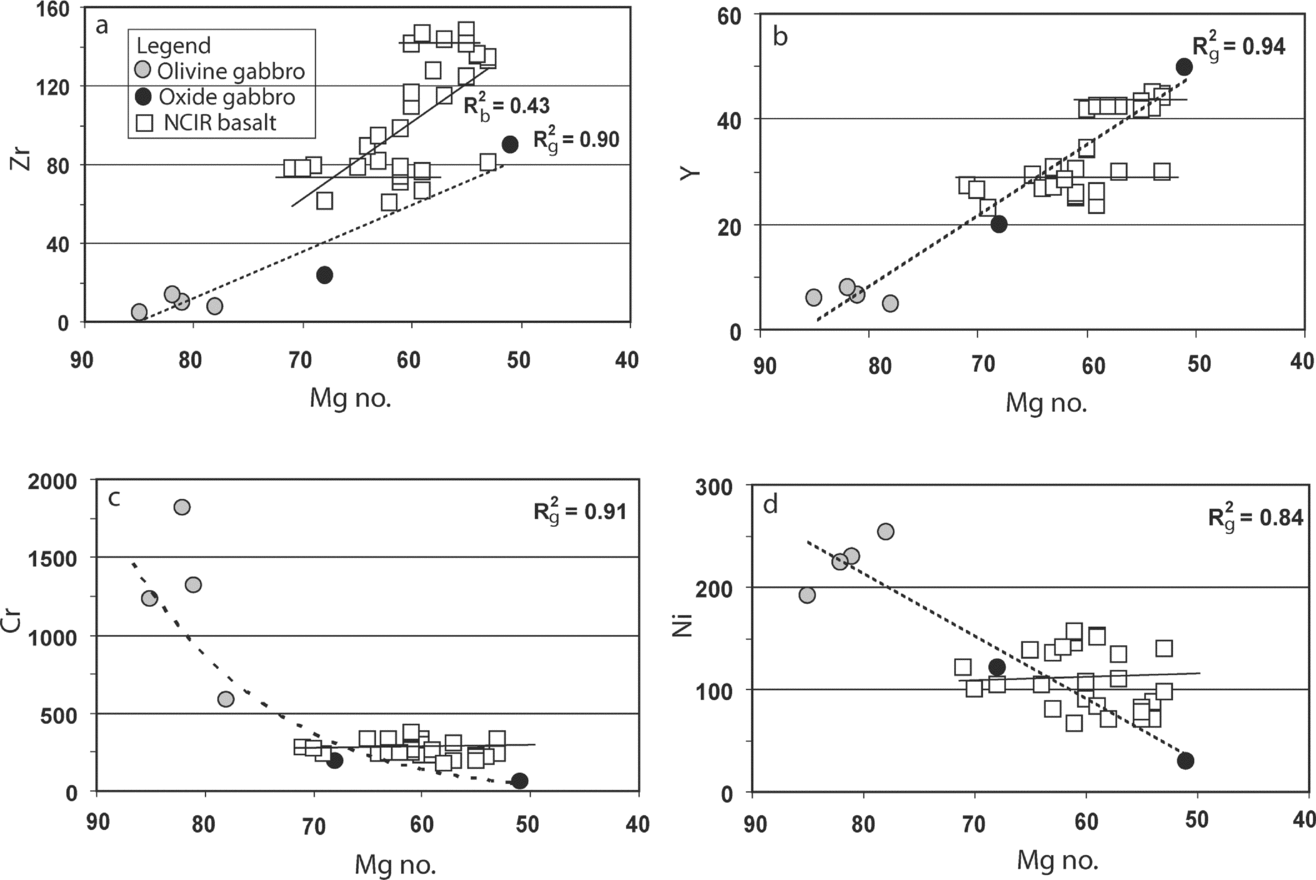
Any possible geochemical trends described by our limited number of gabbro samples (n = 6) are compared with those of NCIR basalts in Mg no. versus incompatible and compatible trace element plots (Fig. 8). In all of our plots, the trends and variations defined by the gabbro samples are mostly described by the oxide gabbro (n = 2). In the Mg no. versus Zr plot, the gabbros (Zr ~ < 85 ppm) show a linearly increasing trend with decreasing Mg no.; the NCIR basalts have relatively high Zr (~ 60–150 ppm) and show, in general, a relatively steep increasing linear trend with decreasing Mg no., although minor variations exist (Fig. 8a). The NCIR basalts with Zr contents of ~ 80 and 140 ppm show additional horizontal trends with no variation of Zr with increasing Mg no. In the Mg no. versus Y plot, although the NCIR basalts show a cluster on the linear trend defined by the present gabbro, they define two different linear trends with no change of Y content (at ~ 30 and 42 ppm Y) with increasing Mg no. (Fig. 8b). In Mg no. versus Cr and Ni plots, Cr and Ni show decreasing curvilinear and linear trends, respectively, for the gabbros with decreasing Mg no. (Fig. 8c, d). In these plots, the NCIR basalts show an evolved chemistry comparable to the Fe–Ti oxide gabbro. Though the basalts form clusters on the trends defined by the gabbro samples, they show no variations in Cr and Ni contents with decreasing Mg no.
Binary trace element plots of NCIR gabbro (data from Table 3) and basalt (Ray et al. Reference Ray, Iyer, Banerjee, Misra and Widdowson2007) in Mg no. versus (a) Zr, (b) Y, (c) Cr and (d) Ni diagrams. Symbols as in Figure 7; note differences in trends for gabbro (dotted best fit lines) and basalt (solid best fit lines).

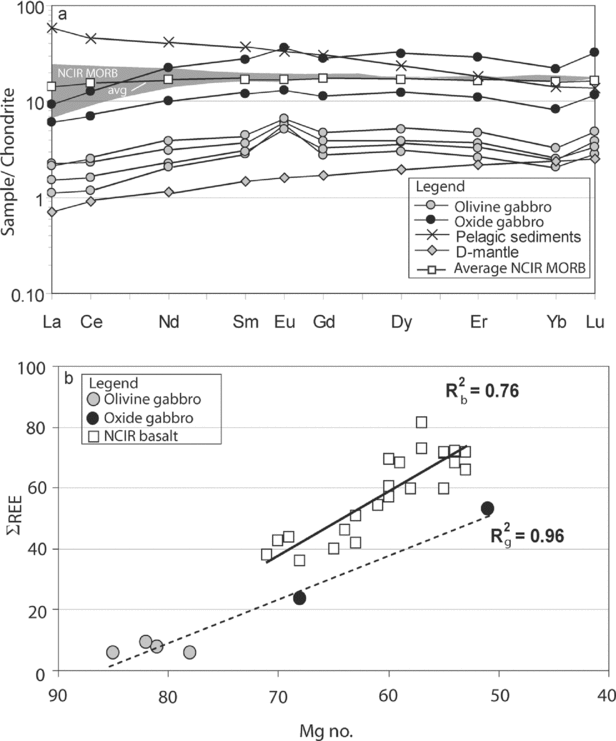
In the CI-chondrite-normalized (after McDonough & Sun, Reference McDonough and Sun1995) REE spidergram, the olivine- and Fe–Ti oxide gabbros show a slightly middle REE up-convex pattern (La/Yb = 0.42–0.9) with the latter having distinctly higher total REE (Fig. 9a). In general, the olivine gabbros are marginally LREE depleted (La/SmN = 0.33–0.62) with almost flat HREE (Gd/YbN = 1.26–1.55) and show a positive Eu anomaly {Eu/Eu* = 1.13–2.06, calculated after Taylor & McLennan (Reference Taylor and McLennan1985) using the following formula: Euanomaly = (EuCN)/[(SmCN) * (GdCN)]0.5}, which is almost absent in the oxide gabbro. The Fe–Ti oxide gabbro also has marginally depleted LREE (La/SmN = 0.33–0.50) and flat HREE (Gd/YbN = 1.27–1.37) but without any Eu anomaly. In contrast, the average NCIR N-MORB has flat REE (La/YbN = 0.91). In total REE (La, Ce, Nd, Sm, Eu, Gd, Dy, Er, Yb and Lu ~ ΣREE) content, the olivine gabbros have the lowest values (< 8.5 ppm) and the oxide gabbros have higher values (22 and 48 ppm) that overlap with those of the NCIR N-MORB (Fig. 9b). In the Mg no. versus total REE plot, the NCIR gabbro and basalt, however, show distinctly different increasing linear trends for total REE with decreasing Mg no. (Fig. 9b).
(a) Chondrite-normalized (after McDonough & Sun, Reference McDonough and Sun1995) REE spider diagram of NCIR gabbro and other Indian Ocean rocks for comparison. Symbols: filled grey circle – olivine gabbro; filled black circle – oxide gabbro (data from Table 3); filled diamond – D mantle (Workman & Hart, Reference Workman and Hart2005); cross-Indian ocean pelagic sediment (detail REE data from Ben Othman, White & Patchett, Reference Ben Othman, White and Patchett1989); open square – average NCIR MORB; grey-shaded area – the range of NCIR MORB (data from Ray et al. Reference Ray, Iyer, Banerjee, Misra and Widdowson2007). (b) Binary plot of total REE (ΣREE) versus Mg no. for Indian ocean gabbro and basalts. Symbols: filled grey circle – olivine gabbro; filled black circle – oxide gabbro (data from Table 3); open square – NCIR MORB (data from Ray et al. Reference Ray, Iyer, Banerjee, Misra and Widdowson2007).

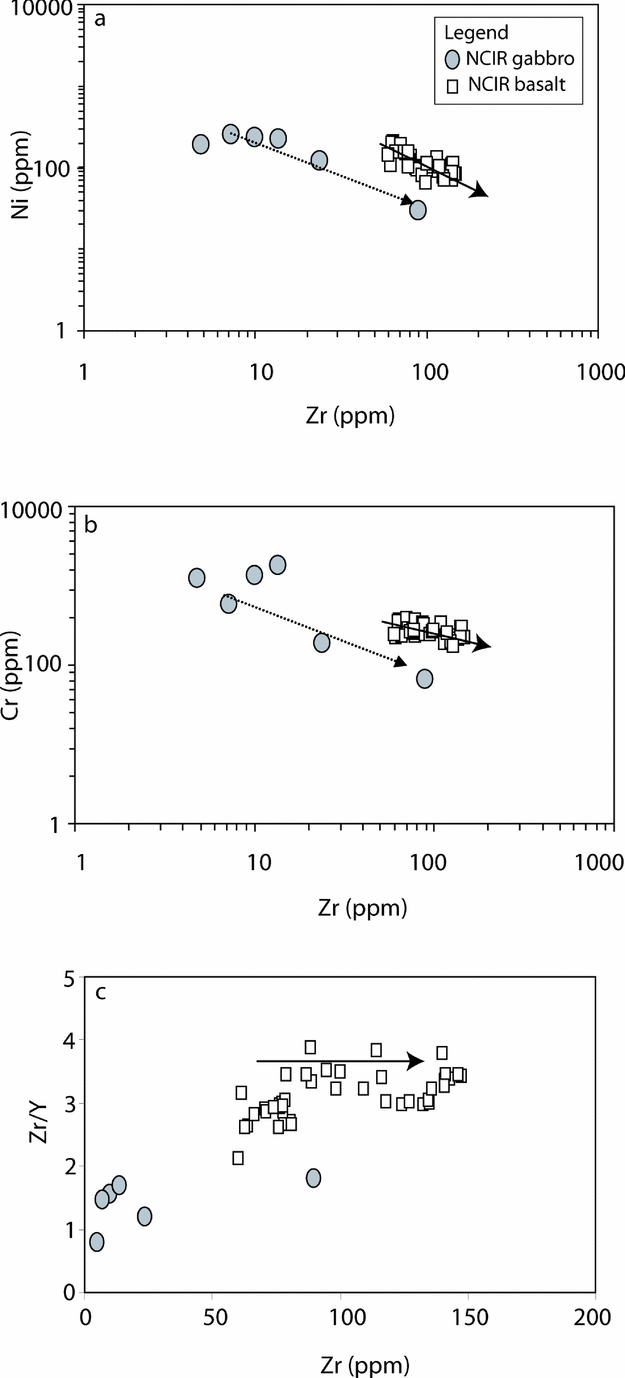
The incompatible versus compatible trace element variation diagrams are often used to examine the magmatic process (Cocherie, Reference Cocherie1986). Though originally proposed for volcanic rocks (Treuil & Varet, Reference Treuil and Varet1973; Allègre et al. Reference Allègre, Treuil, Minster, Minster and Albarede1977; Villemant et al. Reference Villemant, Jaffrezic, Joron and Treuil1981), Cocherie (Reference Cocherie1986) systematically studied the behaviour of trace elements during evolution of plutonic rock suites to evaluate fractional crystallization, partial melting and magma mixing. It is already understood that the NCIR basalts were formed by fractionation of one of the primitive MORB (no. 525–5-3) of Presnall & Hoover (Reference Presnall, Hoover and Mysen1987) (Ray et al. Reference Ray, Iyer, Banerjee, Misra and Widdowson2007). The compatible versus incompatible trace element diagrams (after Cocherie, Reference Cocherie1986) have, therefore, been used in the present study to evaluate the liquid line of descent of the NCIR basalts and its relationship with the present NCIR gabbro (Fig. 10). The governing criterion for selection of elements for our plots is very high ranges of variation of the elements in both gabbros and basalts. In the log–log plots of Ni and Cr against Zr, both the NCIR gabbro and basalt show similar but different decreasing linear trends for Ni and Cr with increasing Zr (Fig. 10a, b), indicating non-cogenetic origin of these rocks.
(a, b) Binary plots of present gabbro and NCIR basalts in compatible (Zr) versus incompatible trace element (Ni and Cr) log–log diagrams (after Cocherie, Reference Cocherie1986); (c) plot of incompatible trace element ratio (Zr/Y) against the least compatible element of the two (Zr) (Process identification plot, after White, Reference White and Dasch1999). Symbols: filled grey circle – NCIR gabbro (data from Table 3); open square – NCIR basalts (Ray et al. Reference Ray, Iyer, Banerjee, Misra and Widdowson2007). Arrows show direction of compositional changes with increasing Zr.

The covariation between the incompatible trace element ratios and the least compatible element between the two (after White, Reference White and Dasch1999) has also been examined between the NCIR basalt and gabbro for further verification of the possible co-magmatic nature of these two rock groups (Fig. 10c). In the Zr/Y versus Zr plot, the Zr/Y ratios of gabbro and basalt are different; the gabbros have a Zr/Y ratio mostly between ~ 1 and 2, and most of the data show a cluster at Zr ≤ 25 ppm, while the basalt has a characteristic value close to 3–4 and the values do not show much variation with increasing Zr. Different Zr/Y ratios of the present gabbro and basalt also favour their non-cogenetic relation.
In summary, the present available petrological and geochemical data can be used to determine the possible petrological relationships between our present olivine and oxide gabbro samples, and between the present gabbros and NCIR basalts. There are reasons to believe that the olivine gabbros and oxide gabbros could be cogenetic because: (a) olivine, plagioclase and clinopyroxene in these two gabbro types either have similar bulk compositions or show systematic variation in bulk composition (Figs 3, Fig. 4, Table 2; online Appendix Tables A1–A3, available at http://multimediafluids.uam.elogim.com/journals/geo), and (b) in major and trace element plots these two types of gabbro always show collinear trends (Figs 6, 8, 9b, 10a, b).
The current geochemical data on the present olivine and oxide gabbros (Tables 2, 3; Appendix Tables A1–A3 available at http://multimediafluids.uam.elogim.com/journals/geo) and their logical interpretation listed below negate all possibility of the NCIR gabbro representing the cumulate phase resulting from fractionation of the NCIR parent magma: (a) the clinopyroxenes of the NCIR gabbro and basalt have completely different trends of evolution in the pyroxene quadrilateral indicating their generation at widely different temperatures between 1200 and 1000 °C and at < 800 °C, respectively (Fig. 3), and the olivines of the NCIR gabbro are less Mg-rich compared to those of the NCIR basalts (Table 2), which would not be expected if these two rocks were cogenetic; (b) in the MgO (compatible) versus TiO2 (incompatible) oxide plot, the primitive NCIR basalts, which are compositionally similar to one of the primitive basaltic members (No. 525–5-3) of Presnall & Hoover (Reference Presnall, Hoover and Mysen1987) (Ray et al. Reference Ray, Iyer, Banerjee, Misra and Widdowson2007), and the evolved NCIR basalts together constitute a liquid line of descent that is different in style from that of the present gabbro suite (Fig. 6f); (c) in the CIPW normative Di–Ol–Qtz plot (Fig. 5) and in most of the major oxide bivariant diagrams against Mg no., the NCIR gabbro and basalt do not show any common geochemical lineage (Fig. 6a–d); (d) there is absence of any complementary incompatible element geochemistry between the present NCIR gabbro and basalt (Fig. 7); (e) different trends of evolution of the NCIR gabbro and basalt are seen in Mg no. versus Zr, Y, Cr, Ni and total REE plots (Figs 8, 9b); (f) in compatible versus incompatible trace element plots (Fig. 10a, b) and in a plot of incompatible trace elements ratio versus the least incompatible element of the two (Fig. 10c), the NCIR gabbro and basalt never show any common geochemical lineage. Therefore, on the basis of geochemical data, it can be argued that the NCIR gabbro represents a cumulate phase that was derived during fractionation of an unknown parent magma that was compositionally different from that of the NCIR basalt. The isotopic data in favour of this conclusion are discussed below.
6. Isotope geochemistry
Isotopic signatures have long been used to explore any possible input in the mantle reservoir during generation of the NCIR parent magmas, which may be attributed to addition of plume material, deeply recycled pelagic sediments, subduction modified mantle wedge material and/or the addition of continental lithosphere to the Indian Ocean upper mantle (e.g. Mahoney et al. Reference Mahoney, Natland, White, Poreda, Bloomer, Fisher and Baxter1989; Rehkamper & Hofmann, Reference Rehkamper and Hofmann1997; Kempton et al. Reference Kempton, Pearce, Barry, Fitton, Langmuir and Christie2002; Hanan et al. Reference Hanan, Blichert-Toft, Pyle and Christie2004). Our present isotopic data on two olivine gabbro samples have been used to explore these possibilities. As the present location (Fig. 1) is far from any known hotspot, we can perhaps negate the possibility of addition of any plume material in the mantle reservoir to regulate NCIR mantle chemistry (also see Michard, Montigny & Schlich, Reference Michard, Montigny and Schlich1986), although this type of interaction is only identified at the westernmost SWIR and near the Bouvet triple junction (Kurz, Le Roex & Dick, Reference Kurz, Le Roex and Dick1998; Kurz, Warren & Curtice, Reference Kurz, Warren and Curtice2009; Meyzen et al. Reference Meyzen, Blichert-Toft, Ludden, Humler, Mevel and Albarede2007).
Hart et al. (Reference Hart, Blusztajn, Dick, Meyer and Muehlenbach1999), in their work on oceanic gabbro samples from site 735, situated on a shallow (700 m) wave-cut platform on the transverse ridge system east of the Atlantis II fracture zone, SE Indian Ridge, had identified contamination of isotopic ratios (87Sr/86Sr, 206Pb/204Pb, δ18O, 187Os/188Os) of these samples by seawater. Their samples, which occurred on ~ 11 to 12 Ma old oceanic crust, show petrological evidence of alterations up to amphibolite to greenschist facies. In contrast, our samples are very young in age (c. < 0.4 Ma) and are almost alteration-free (Fig. 2). The samples were also carefully leached to remove any possible alteration before isotopic analysis. Therefore, it is likely that the effect of seawater alteration on our gabbroic samples is minor and the present isotopic data (Table 3) can be used to evaluate their magmatic evolution. As our gabbro samples are very young in age (c. < 0.4 Ma), we only consider the measured isotopic data of these samples in the following discussion.
Two olivine gabbro samples from the present suite show 87Sr/86Sr (0.702878–0.702919) and 143Nd/144Nd (0.513116–0.513119) ratios (Table 3) that are comparable to the average values of the SWIR gabbro (0.702921 and 0.51312, respectively: Hart et al. Reference Hart, Blusztajn, Dick, Meyer and Muehlenbach1999). In contrast, Pb isotopic ratios, for example, 206Pb/204Pb (18.4611–18.5316), 207Pb/204Pb (15.5392–15.5538) and 208Pb/204Pb (38.3850–38.4593), of present gabbro samples are relatively high as compared to the SWIR gabbro (17.662, 15.447 and 37.381, respectively) and the NCIR basalts (18.067, 15.456 and 37.870, respectively) (Table 3). Therefore, these isotopic data suggest that the NCIR and SWIR gabbros, and the NCIR basalts, seem to have different mantle sources. The possibilities of contamination of ancient Indian Ocean Ridge (IOR) mantle with radiogenic pelagic sediments (Rehkamper & Hofmann, Reference Rehkamper and Hofmann1997) or by a lower crustal component (Nakamura et al. Reference Nakamura, Sato, Sato and Ishii2006) have been discussed. In the present study, we explore this possibility for the NCIR gabbro mostly using the measured radiogenic isotopic ratios (Fig. 11).
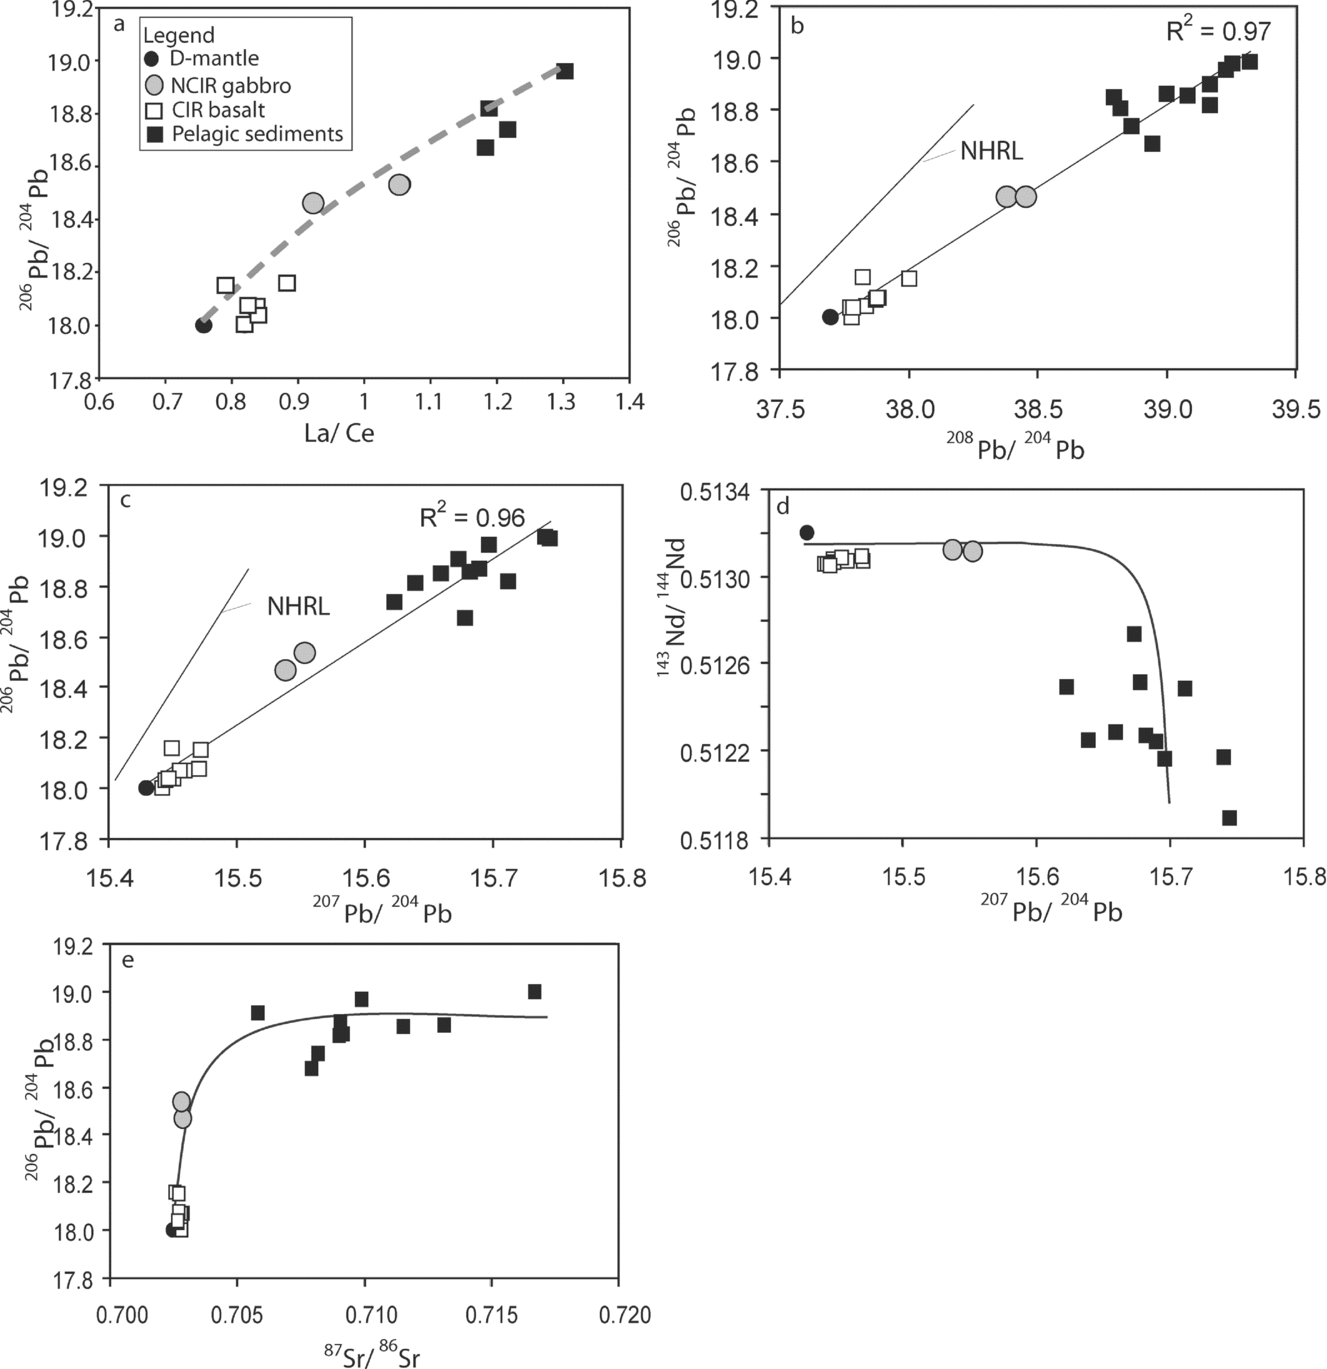
Binary plots of present gabbro in (a) La/CeN versus 206Pb/204Pb, (b) 208Pb/204Pb versus 206Pb/204Pb, (c) 207Pb/204Pb versus 206Pb/204Pb, (d)207Pb/204Pb versus 143Nd/144Nd, and (e) 87Sr/86Sr versus 206Pb/204Pb plots. Symbols: filled grey circle – olivine gabbro (data from Table 3); open square – Central Indian Ocean Ridge (CIR) basalts (Rehkamper & Hofmann, Reference Rehkamper and Hofmann1997); filled black square – Indian ocean pelagic sediments (Ben Othman, White & Patchett, Reference Ben Othman, White and Patchett1989); filled black circle – depleted mantle (Hart, Reference Hart1984); dashed and solid lines through the data indicate mixing lines between depleted mantle and Indian Ocean pelagic sediment end-members. Note that the IOR basalt and NCIR gabbro are always plotted on mixing lines between these two end-members; the role of pelagic sediments is also found to be important in the genesis of gabbro. Northern Hemisphere Reference Line (NHRL) from Hart (Reference Hart1984) is shown in (b, c) for reference.

The Nb/U and Ce/Pb ratios, though considered sensitive indicators to evaluate crustal contamination of the mantle source in MORB glasses (Rehkamper & Hofmann, Reference Rehkamper and Hofmann1997), are likely to be insensitive so far as the IOR gabbroic rocks are concerned because these rocks represent cumulate phases and, therefore, the ratios are possibly influenced by magmatic processes. In the REE diagram, the NCIR gabbros plot between the most depleted D-mantle and the most enriched Indian Ocean pelagic sediments end-members (Fig. 9a) and, therefore, mixing of these two end-member components may probably have an important bearing on the genesis of the NCIR gabbro. The incompatible La/Ce ratio has been well used to evaluate magma mixing for the Reykjanes Ridge basalts (Langmuir et al. Reference Langmuir, Vocke, Hanson and Hart1978). In our present study, when the D-mantle (data from Hart, Reference Hart1984), NCIR gabbro (Table 3), NCIR basalts (Rehkamper & Hofmann, Reference Rehkamper and Hofmann1997) and the Indian Ocean pelagic sediments (Ben Othman, White & Patchett, Reference Ben Othman, White and Patchett1989) are plotted together in the La/CeN versus 206Pb/204Pb diagram, they describe a well-defined curvilinear mixing trend between D-mantle and pelagic sediment end-members (Fig. 11a) (cf. Langmuir et al. Reference Langmuir, Vocke, Hanson and Hart1978). On this diagram, the NCIR basalts from literature (Rehkamper & Hofmann, Reference Rehkamper and Hofmann1997) always plot close to the D-mantle end-member, whereas the two gabbro samples are plotted midway between the D-mantle and pelagic sediment. In the measured 206Pb/204Pb versus 208Pb/204Pb and 207Pb/204Pb plots, the olivine gabbro falls on a straight mixing line containing the depleted mantle (D) and the Indian Ocean pelagic sediment as end-member compositions (Fig. 11b, c). These mixing lines are different from the Northern Hemisphere Reference Lines (NHRL) (Hart, Reference Hart1984) with ∆207Pb/204Pb and ∆208Pb/204Pb values of our two gabbro samples of ~ 4.67, 5.40 and 43.49, 42.76, respectively. In Nd–Pb and Sr–Pb isotopic diagrams, the gabbro compositions also fall on a curvilinear hyperbolic trend between D-mantle and pelagic sediments (Fig. 11d, e).
The isotopic compositions of the present gabbros occurring within the active NCIR are indicative of their source rock composition. All the diagrams, therefore, suggest that the NCIR magmas were generated from a depleted mantle source that was contaminated by mixing of Indian Ocean pelagic sediments in moderate to high proportions. The proportion of pelagic sediments can be computed close to 9 wt % or less for the NCIR basalts (we used Pb isotope compositions of average D-mantle and Indian Ocean pelagic sediments for our computation; for calculation procedure see Faure & Mensing, Reference Faure and Mensing2005, p. 347), which is very close to the estimation of Rehkamper & Hofmann (Reference Rehkamper and Hofmann1997) of ~ 10 wt %. For our two gabbro samples the proportion of involvement of the pelagic sediments, however, is much higher (could be ~ 50 wt %), as suggested by our Pb-isotope data.
7. Discussion
Occurrences of gabbros adjacent to the Vityaz megamullion of NCIR (low-angle detachment fault; cf. Drolia & DeMets, Reference Drolia and DeMets2005) represent recent magmatic intrusion. This intrusion creates the plutonic complex (the gabbro body) apparently after a magmatically quiescent period, which is common in megamullion settings elsewhere (Ildefonse et al. Reference Ildefonse, Blackman, John, O'Hara, Miller and Macleod2007). The presence of low-angle detachment faulting facilitates the emplacement of the gabbro in this tectonic setting (cf. Dick, Tivey & Tucholke, Reference Dick, Tivey and Tucholke2008). The dredged gabbros from the megamullion thus genetically differ from other CIR gabbros whose emplacement is exclusively controlled by the major transform faults, namely, the Marie Celeste, Argo and Vema transform faults (Bloomer, Natland & Fisher, Reference Bloomer, Natland, Fisher, Saunders and Norry1989). The gabbros are mostly homogeneous in composition and vary between olivine gabbro and Fe–Ti oxide gabbros, in comparison to the other fracture zone gabbros of the Indian Ocean Ridge system, which have heterogeneous mineralogy and texture (Bloomer, Natland & Fisher, Reference Bloomer, Natland, Fisher, Saunders and Norry1989). The Vityaz gabbros also show different trends of evolution in Mg no. versus major oxides plots (Fig. 6), compared to the CIR gabbros from the transform faults (Engel & Fisher, Reference Engel and Fisher1975). It appears that these two suites of gabbro samples have different petrogenetic evolutions. On the other hand, the mineral chemistry (Table 2, Appendix Tables A1–A3 at http://multimediafluids.uam.elogim.com/journals/geo, Figs 3, 4) of olivine gabbros and Fe–Ti oxide gabbros of the present gabbro suite, along with their geochemical continuity (Figs 6, 8, 9), suggests that these two rock types could be cogenetic.
Any possibility of the present gabbro being a pre-existing cumulate phase that is brought up to the shallower level of oceanic crust and reacted by the NCIR basalt can be ruled out (a) because of the absence of poikilitic clinopyroxene, with resorbed plagioclase inclusions (Fig. 2c) and (b) because the clinopyroxene composition of these gabbros is well within the field of primitive melt that is in equilibrium with mantle peridorite (Fig. 4d) (cf. Lissenberg & Dick, Reference Lissenberg and Dick2008).
Based on the Pb, Nb and Sr isotopic ratios, Rehkamper & Hofmann (Reference Rehkamper and Hofmann1997) suggested that the parent magma of the Indian Ocean MORB was generated from a depleted mantle (mostly Atlantic or Pacific type) that had been contaminated by recycled ocean crust with ~ 1.5 Ga old pelagic sediments. In their model, the pelagic sediment input may vary up to ~ 10 wt %. Our present Pb, Sr, Nd isotopic ratios, together with geochemical studies, suggest the proportion of the pelagic sediment mixing might be ~ 9 wt % (Fig. 11). The Pb-isotope data suggest that the mixing of the Indian Ocean pelagic sediments in the parent magma of the present gabbro suite is significant, which is much higher compared to that of the Indian Ocean MORB source. However, the mechanism by which this high proportion of pelagic sediments was incorporated into the D-mantle during the genesis of the gabbro cannot be clearly established.
8. Conclusions
(1) The gabbro samples (c. < 0.4 Ma) dredged from the slow-spreading segment of the NCIR adjacent to the ‘Vityaz megamullion’ are mainly of two types: olivine and Fe–Ti oxide gabbros. Their common mineralogical compositions, that is, olivine (~ Fo80–81), clinopyroxene (En48Fs8–10) and plagioclase (An67–70), and geochemical continuity on major oxide and trace element variation diagrams suggest these two varieties of gabbros could be cogenetic.
(2) The geochemical and Pb-isotopic data suggest that the present gabbro samples are not cogenetic with the NCIR basalts, and are also geochemically distinct from the CIR gabbro from the Vema, Argo and Marie Celeste transform faults.
(3) Modelling on isotopic data suggests that the NCIR gabbros were derived from a depleted mantle source that was significantly contaminated, most likely by Indian Ocean pelagic sediments. The Pb-isotope data suggest that the level of pelagic sediment contamination is much higher compared to that of the Indian Ocean MORB source.
Acknowledgements
We are grateful to D. Pyle, T. Morishita, H. Kumagai and P. Leat for their valuable comments on the early versions of the manuscript. We are obliged to the Directors of NCAOR and NIO for constant encouragement. We are indebted to the Ministry of Earth Sciences, Government of India, for allotting the cruises and the scientific party and the crew members of ORV Sagar Kanya for their unstinting help in collecting the samples. This work is supported by the CSIR Network program and Office of Naval Research, USA. The first author (D.R.) also gratefully acknowledges the support of a CSIR-Senior Research Fellowship during the progress of this research. A. K. Chakrabarti helped us on several technical aspects of this manuscript.