Introduction
Most studies of diversity–disturbance relationships in bee communities have been observational, comparing species richness and abundance in disturbed versus undisturbed sites or comparing sites with more versus less disturbance in highly modified landscapes. Habitat loss is the primary contributor to declines in bee (Hymenoptera: Apoidea) abundance and diversity, but several other disturbances are also important including agricultural practices, logging, pesticide use, and fire (Winfree et al. Reference Winfree, Aguilar, Vazquez, LeBuhn and Aizen2009; Bommarco et al. Reference Bommarco, Biesmeijer, Meyer, Potts, Poyry and Roberts2010; Williams et al. Reference Williams, Crone, Roulston, Minckley, Packer and Potts2010). In general, bees tend to prefer open, meadow habitat, so disturbances that preserve fields and meadows tend also to promote bee abundance and diversity. At the local level, intermediate levels of disturbance seem to promote bee diversity, as illustrated by the following three examples: alpine sites with intermediate burning frequencies host more bee and wasp species, and more of the rare species, than unburned or frequently burned sites (Moretti et al. Reference Moretti, Obrist and Duelli2004); small-scale disturbances created by military vehicles or by grazing lead to increased numbers of individuals and species of bumblebees (Carvell Reference Carvell2002); and bee species richness and abundance is highest at intermediate levels of logging in tropical forest (Hsiang Liow et al. Reference Hsiang Liow, Sodhi and Elmqvist2001).
Another approach to studying the relationship between diversity and disturbance is to examine how communities re-establish themselves following high magnitude disturbances, especially disturbances that result in severe reduction in numbers or complete eradication of the organisms of interest. Recent studies demonstrate that habitat restoration can rapidly result in increased bee abundance and diversity, even in areas from which bees have previously been eradicated. Restoration of native vegetation along roadsides in Kansas, United States of America led to increases in both abundance and species richness of bees, such that the bee assemblages of restored roadsides were similar to those in prairie remnants (Hopwood Reference Hopwood2008). A comparison of pollinator communities of ancient and restored heathlands in southern England indicated that the key pollinators, mostly bees, were the same (Forup et al. Reference Forup, Henson, Craze and Memmott2008); since the restored sites were only 11–14 years old, bee communities evidently re-established and recovered quickly. Restoration of riparian habitat along the Sacramento River in California, United States of America, resulted in establishment of native bee communities with abundance and richness comparable with or exceeding that found in nearby remnant habitats (Williams Reference Williams2011). Restoration of sand dune complexes in riverine habitat in north-western Germany also indicated that wild bee communities re-established rapidly, although in restored sites bees were less abundant and their assemblages included fewer specialists than in the relatively undisturbed sites to which they were compared (Exeler et al. Reference Exeler, Kratochwil and Hochkirch2009). This last study also revealed evidence for rapid succession in bee communities in the first three years following restoration, with initial increases in number and abundance of species, followed by a decline in the third year.
Taken together, studies of disturbance and restoration effects on bees suggest that (1) communities can recover quickly if suitable habitat is available, (2) bee communities often reach their highest diversity when intermediate levels of disturbance promote habitat heterogeneity and openness (Carvell Reference Carvell2002), and (3) following very severe disturbances that eradicate or seriously reduce bee populations, recovery of bee communities involves succession. However, there are several difficulties inherent in studying successional patterns as bee communities establish themselves in newly available habitat. First, longitudinal studies of succession from the time of an initial major disturbance are desirable but may take years to complete, even if the recovery of bee communities is rapid. Second, the dynamics of bee populations are notoriously variable in time, so longitudinal studies must be able to separate the effects of succession on bee abundance and diversity from the effects of other factors such as weather, parasite pressure, or disease (Cane and Tepedino Reference Cane and Tepedino2001). A solution to these problems is to compare bee abundance and diversity sites in close proximity at the same point in time, so that different stages of habitat recovery can be compared without the added complications of temporal variability.
The landscape of southern Ontario, Canada, is highly modified by human activity, and the effects are particularly obvious in the Niagara Peninsula, the area of land bounded on three sides by Lake Ontario, the Niagara River, and Lake Erie. Although the aboriginal inhabitants of southern Ontario certainly had an impact on the natural landscape, it was the advent of European settlement after about 1750 that resulted in extensive land-use change (Butt et al. Reference Butt, Ramprasad and Fenech2005). Prior to that time, much of Niagara was Carolinian forest and tall grass prairie, but the historical land surveys that would have revealed the extent of forest versus grassland coverage prior to 1750 have mostly been lost or destroyed (Butt et al. Reference Butt, Ramprasad and Fenech2005). Nevertheless, European settlement certainly resulted in widespread conversion of forested areas to agriculture, which would have increased the availability of open habitat, leading to increases in bee abundance and diversity (Proctor et al. Reference Proctor, Nol, Burke and Crins2012). On the other hand, by the early 20th century, most land in Niagara had been converted to urban settlement or intensive, heavily mechanised agriculture (Muller and Middleton Reference Muller and Middleton1994), practices that tend to result in lower bee diversity (Winfree et al. Reference Winfree, Aguilar, Vazquez, LeBuhn and Aizen2009; Williams et al. Reference Williams, Crone, Roulston, Minckley, Packer and Potts2010; Winfree Reference Winfree2010), so it is also likely that there is less suitable bee habitat now than there was 100 years ago. Surprisingly, for a region settled for such a long time and where pollination services have been especially important to the local agricultural economy, the bee community of Niagara was unstudied until recently (Richards et al. Reference Richards, Rutgers-Kelly, Gibbs, Vickruck, Rehan and Sheffield2011). The lack of historical records for both vegetation and insect communities means that we cannot easily assess the disturbance effects of land-use change on local bee communities in this region. However, we can study how bee communities re-establish and reassemble as habitat becomes available following major disturbances that seriously reduce bee abundance and diversity.
In 2003, we began a long-term study of bee abundance and diversity in naturalising meadow habitats in southern St. Catharines, Ontario, Canada. We are studying bees at meadow sites of various ages on the campus of Brock University and the adjacent Glenridge Quarry Naturalization Site (GQNS), a park completed in 2003 on a former landfill site. Our long-term objective is to examine patterns of bee recolonisation of newly available foraging and nesting sites as well as demographic changes in bee populations over time. Our first goal was to provide a comprehensive description of the local bee community (Richards et al. Reference Richards, Rutgers-Kelly, Gibbs, Vickruck, Rehan and Sheffield2011), which was also the first such description of any bee community in the Niagara Peninsula. In 2003, the bee community at our study sites was composed of about 124 species and morphospecies representing five bee families, while abundance-based diversity estimators suggested local bee species richness might be as high as 148 species. We also found evidence that the bee community at our sites was markedly less diverse and exhibited higher levels of dominance (the most abundant species were proportionally more numerous) than another southern Ontario bee community in similar Carolinian habitat in the Caledon Hills (Grixti and Packer Reference Grixti and Packer2006). The differences between the two communities suggested that the relative paucity of species in Niagara might be due to greater levels of disturbance in our study sites or more specifically, shorter durations of time for bee communities to recover from major anthropogenic disturbances, especially in the former landfill sites.
Whereas our previous study focussed on describing the taxonomic composition of the local bee community, its guild composition, and its phenology (Richards et al. Reference Richards, Rutgers-Kelly, Gibbs, Vickruck, Rehan and Sheffield2011), our objective in the current study is to investigate the patterns of bee recolonisation of the former landfill sites by comparing bee assemblages at landfill sites to those in nearby “control” sites, representing likely sources of emigrants to the landfill sites. Our study design was experimental and local in focus, taking advantage of the reconstruction and planting of peripheral areas of the GQNS in 2000 (“recent” sites) and of central landfill areas in 2003 (“new” sites). By comparing the bee assemblages at these sites to those in “control” sites in old, relatively undisturbed meadows on the nearby campus of Brock University, we were able to investigate changes in bee assemblages attributable to the duration of recovery time. In accordance with the general predictions of the Intermediate Disturbance Hypothesis (Connell Reference Connell1978) and the patterns previously observed in bumblebees (Carvell Reference Carvell2002), we predicted that the highest bee abundance and species richness would be found in recently regenerated sites, that the lowest abundance and diversity would be found in newly regenerated sites, and that the older control sites would fall between these two extremes.
Methods
The data presented here are a subset of the data previously presented in Richards et al. (Reference Richards, Rutgers-Kelly, Gibbs, Vickruck, Rehan and Sheffield2011). The objective of our previous study was to obtain as complete a picture as possible of local bee community composition and phenology, and so we considered a pooled set of specimens collected in eight field sites representing meadows of different ages, not all of which were subject to equal collecting effort. In the current study, we use a subset of these data, focussing on differences in bee specimens collected at seven field sites representing old (40+ years), recent (three years), and newly planted (0 years) meadows, identically sampled from early May (week 3) to late September (week 23) 2003.
Our earlier study (Richards et al. Reference Richards, Rutgers-Kelly, Gibbs, Vickruck, Rehan and Sheffield2011) indicated that in 2003, the local bee community comprised at least 124 species and morphospecies, from five families (Andrenidae, Apidae, Colletidae, Halictidae, and Megachilidae). Halictidae was both the most abundant and the most speciose group. Nesting guilds included ground nesters, carpenters (bees that construct nests in woody substrates), hole nesters that do not construct their own burrows, and mason bees (Grixti and Packer Reference Grixti and Packer2006). Social species, primarily primitively eusocial halictids, were very common, with solitary and parasitic lifestyles also well represented. Bee flight activity began in late April and continued into October, with three peaks in abundance (early spring, late spring, and mid-summer) and a distinct lull in activity in late June to early July.
Field sites
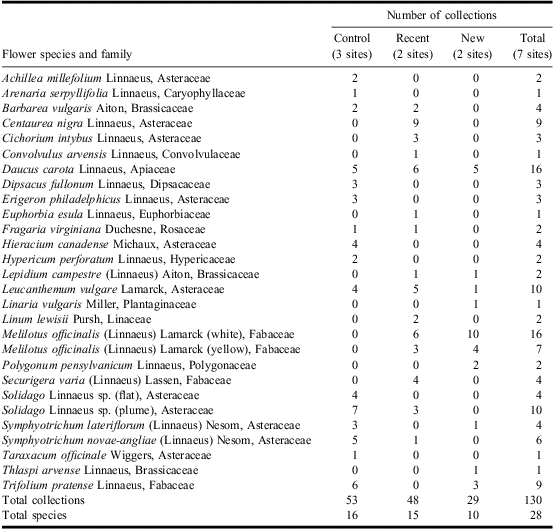
We examined bee abundance and diversity in seven field sites representing three regeneration durations (please see maps in Supplementary material, Figs. S1–S3). All field sites were at least 1 ha in area and the maximum distance between the most widely separated sites (which were control sites) was about 1100 m (straight line distance), well within flight distances of most of the species captured. The Brock University campus and the GQNS are almost contiguous, separated by about 300 m of roadway, campus residences, and a small shopping mall, so the bee community at Brock University was likely a major source of colonists to the new areas. Common flower species at each site are listed in Table 1.
Abundant flower species and the number of five-minute bee collections per flower species, a measure of blossom abundance at control, recent, and new sites in 2003.

Note that the number of collections shown is for the total for all sites within each meadow type.
Four sites on the Brock University campus were designated as “control” sites (BrN, latitude 43.113498, longitude −79.24716; BrS 43.112057, −79.246345; BrW 43.112871, −79.247761; and BrE, 43.113059, −79.244885; see Supplementary material, Fig. S2). These were relatively low disturbance meadow areas that bees could have occupied continuously for at least 40 years. These meadows were located on the southern edge of Brock University campus, and were used for farming prior to the 1960s, and were occasionally mowed and possibly sprayed with pesticides or herbicides before 1999, but by spring of 2003 had been protected from most anthropogenic disturbances for at least four years. However, one field site (BrN) was destroyed on 9 July 2003 by construction of a new parking lot, so it was replaced immediately with the BrW field site, directly adjacent to BrN, but separated by a protective row of trees. Data from the two sites were combined to create a continuous series (BrNW), so low disturbance control patterns were assessed in a total of three field sites (BrE, BrS, and BrNW). Bee assemblages in the control sites would have comprised both residents (bees nesting in or near the collection areas) and commuters (bees foraging in the collection areas but nesting elsewhere).
Regeneration sites were located at the GQNS, which has a long history of disturbance, having been a farm, then a limestone quarry and after being mined out, a major landfill site for 25 years. The landfill site was permanently closed on 1 January 2002. In peripheral areas of the GQNS, planting of native and nonnative flowers and shrubs began in 2000 and was mostly complete when we began our study in May 2003. In central areas of the landfill, massive landscape re-engineering continued until April and May of 2003, when the centre of the former landfill was planted. These activities thus created two habitat recovery zones, a peripheral zone in which major construction and other disturbance mostly ceased by 2000, and a central zone in which such disturbance ceased and plant growth commenced by May 2003.
Two peripheral collecting sites, Escarpment (Esc, latitude 43.125029, longitude −79.238627) and Residences (Res, 43.120299, −79.239571), were designated as “recent” sites. By 2003, these sites had been left to regenerate for about three years by the time that bee collections began in May 2003, although they were still subject to occasional traffic by heavy machinery. In 2003, the Esc site consisted of large areas of grass with patches of wildflowers, while the Res site had large areas of bare earth with patches of wildflowers. Nesting bees likely would have been eradicated from peripheral areas during the period when it was a quarry and landfill, but by 2003, the Esc and Res sites likely included both residents and commuters.
“New” sites were in grassy meadows created by capping the central landfill mound with 75 cm of clay, covering the clay with tons of soil, then planting it by hydro-seeding with a mixture of grass and wildflower seeds (mainly clovers) in spring 2003. Two field sites, Pond (Pon, 43.123742, −79.236174) and St. David's (StD, 43.121831, −79.234414), were located on the northern and eastern aspects of the covered waste mound. The soil was still mostly bare when we began bee collections in spring 2003, but by late spring (May and June), the ground was covered in dense mats of grass and clover about 5 cm high, and by July, much of the vegetation was over 2 m high. Bees were undoubtedly eradicated from the Pon and StD sites for a period of several decades while the quarry and the landfill were in operation. The sites only became usable by bees in 2003. The bee assemblage at these sites probably would have been comprised wholly or mostly of commuters, as nesting substrate was not available for any bees except ground nesters. The bee assemblage at these sites represents the earliest stages of recolonisation.
The locations of our sites, bound to the north by the forested Niagara Escarpment and the suburbs of southern St. Catharines, to the west by the Escarpment and several human-engineered lakes, to the east by major highways and more suburbs, and to the south by highways and farmland, make it very likely that bees living in relatively low disturbance meadows of Brock University, including a field on the east side (the 406 site described in Richards et al. Reference Richards, Rutgers-Kelly, Gibbs, Vickruck, Rehan and Sheffield2011), would have been the major source pool of bee colonists for new areas in the GQNS.
Collection methods
Bee abundance and species richness comparisons among sites were based on pan trap samples collected biweekly from 6 May to 26 September 2003 (weeks 3–23) and sweep net samples collected from 2 June to 26 September 2003 (weeks 7–23). Collection methods are described in detail and the bee samples collected with each method are compared in Richards et al. (Reference Richards, Rutgers-Kelly, Gibbs, Vickruck, Rehan and Sheffield2011). Pan trapping and sweep netting were used because these methods allowed us to completely standardise collection effort among sites over the entire collecting season. Pan traps were of three colours (blue, yellow, and white), and were laid out in an X, H, or similar shape, with 10 m between each trap (Supplementary material, Figs. S2–S3). Pan traps were set out before 0900 hours and collected after 1500 hours. Sweep netting was carried out twice per sampling day (morning and afternoon), with two people walking a predetermined route through the site, sweeping the vegetation continuously with long-handled nets for 30 minutes. A third collection method, referred to as flower collections, was used to estimate blossom availability in each site. Flower collections were carried out from 26 May to 25 September 2003 (weeks 6–23) whenever a patch of one flowering plant species was large enough that bees could be collected with an aerial net continuously for five minutes without sampling the same blossoms repeatedly. Thus, the number of collections per flower species provides an indirect measure of blossom availability, at least for flower species growing in large patches. Many of the most common flowering plants at our field sites are nonnative (Table 1; Richards et al. Reference Richards, Rutgers-Kelly, Gibbs, Vickruck, Rehan and Sheffield2011). Voucher specimens of bees are lodged in the Brock Bee Lab collection at Brock University and in the Packer Collection at York University, Toronto, Ontario, Canada. Voucher specimens of plants are lodged in the herbarium collection at Brock University.
Statistical analyses
To compare bee abundance among sites and regeneration levels, we used χ2-tests comparing observed abundance to expected abundance based on the null hypothesis that bees distributed themselves randomly across field sites, regardless of regeneration level.
A complication in comparing species richness among different sites is that differences in species richness among disturbance levels might arise due to processes that affect diversity more or less directly, or due to processes that affect bee abundance directly and then translate indirectly into differences in diversity. This can make it difficult to discern whether differences in species richness are due to processes influencing diversity per se, or whether they are due to differences in abundance. To separate the effects of abundance and species richness, we used a resampling method (Richardson and Richards Reference Richardson and Richards2008) to generate 95% confidence intervals for expected species richness in each site and disturbance level, based on observed abundance and the null hypothesis that bees were randomly distributed across field sites. Rarefaction curves and the abundance-based Chao1 estimator of species richness (Chao Reference Chao1984) were computed using the computer program EstimateS (Colwell Reference Colwell2009) as additional methods for comparing bee diversity among sites and disturbance levels. The Chao1 estimator is an abundance-based estimate of total species richness in a sample, including species that were present at a site but not actually collected.
Results
Effects of meadow age on bee abundance
A total of 9597 bee specimens, comprising 101 species and morphospecies (see Supplementary material, Table S1) was caught in pan trap and sweep samples from early May (week 3) to late September (week 23) 2003. The distribution of bees among sites (Fig. 1) was significantly different from random (χ2 = 3033.6, df = 6, P < 0.0001). Pooling across sites within regeneration levels, the distribution of bees among regeneration levels was also significantly different from random (χ2 = 2303.6, df = 2, P < 0.0001), with bees being most abundant in recent sites, followed by control sites, and then new sites.
Bee abundance based on pan trap and sweep net samples in seven field sites representing control, recent, and new sites at Brock University, St. Catharines, Ontario, Canada and the Glenridge Quarry Naturalization Site, Ontario, Canada in 2003.
The distribution of bees across regeneration levels differed significantly among the five bee families present at our study sites (χ2 = 132.5, df = 8, P < 0.0001; Fig. 2). Breaking these patterns down further, there were significant differences in the proportional representation of the 15 most common genera (genera with total abundance >25 individuals) among regeneration levels (Fig. 3). Most notably, the halictid, Augochlorella aurata (Smith) (Hymenoptera: Halictidae), was the most abundant species in the study, but was proportionally more frequent in recent sites and less frequent in new sites (see heading of Fig. 3 for statistics). Another halictid genus, Lasioglossum Curtis (Hymenoptera: Halictidae), was most abundant in control sites, whereas Halictus Latreille (Hymenoptera: Halictidae) was most abundant in new sites. Among apid genera, Ceratina Latreille (Hymenoptera: Apidae) was most frequent in recent sites and relatively infrequent in new sites, whereas Apis Linnaeus (Hymenoptera: Apidae) was most frequent in new sites. Among megachilids, Osmia Panzer (Hymenoptera: Megachilidae) was most frequent in control sites, and Megachile Latreille (Hymenoptera: Megachilidae) was more common in new sites. The colletid genus Hylaeus Fabricius (Hymenoptera: Colletidae) was more frequent in recent and new than in control sites, and Andrena Fabricius (Hymenoptera: Andrenidae) was somewhat more frequent in new sites.
Distribution of the five bee families among control, recent, and new sites at Brock University, St. Catharines, Ontario, Canada and the Glenridge Quarry Naturalization Site, Ontario, Canada in 2003.
Relative abundance of the 15 most abundant bee genera in control, recent, and new sites. Genera are ordered by total abundance across all sites. Relative abundance of every genus among regeneration levels differed significantly from even (Augochlorella χ2 = 1177, n = 2871; Ceratina χ2 = 1282, n = 1893; Halictus χ2 = 64.9, n = 1215; Hylaeus χ2 = 413, n = 1038; Lasioglossum χ2 = 321, n = 1053; Osmia χ2 = 130, n = 580; Apis χ2 = 226, n = 327; Megachile χ2 = 56.9, n = 132; Andrena χ2 = 12.6, n = 110; Hoplitis χ2 = 11.9, n = 65; Agapostemon χ2 = 40.4, n = 55; Augochlora χ2 = 34.5, n = 52; Heriades χ2 = 10.8, n = 52; Bombus χ2 = 8.0, n = 39; Anthidium χ2 = 20.8, n = 28; for all comparisons df = 2 and P < 0.01).
Effects of meadow age on bee richness
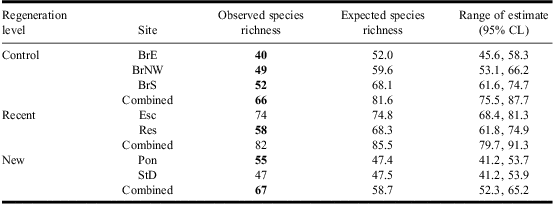
Species richness was highest in recent sites (82 species), but was almost identical in control (66 species) versus new sites (67 species; Table 2). We used the randomisation analysis to determine how many species would be expected in each site and regeneration level, given their observed levels of abundance. Species richness was significantly lower than expected in control sites, was about as expected in recent sites, and was higher than expected in new sites (Table 2). Since new sites had far lower bee abundance than control sites, this means that relative bee diversity was actually much higher in new areas than in control areas. This conclusion is supported by species accumulation and rarefaction curves (Figs. 4–5), which indicate different rates of species accumulation in control and new areas. Estimates of species richness using the abundance-based Chao1 species richness estimator was used to estimate total species richness, including species present but not captured. These suggest that underlying total species richness was 97.6 species per site in recent sites (95% confidence limits (CL) 87.2–128.6), 88.1 species in new sites (95% CL 74.7–125.0), and 78.0 species in control sites (95% CL 69.7–105.2). In contrast, the total species richness estimate for all seven sites pooled was 122.0 (95% CL 108.5–160.0).
Comparison of observed species richness versus expected species richness based on the resampling technique of Richardson and Richards Reference Richardson and Richards(2008).
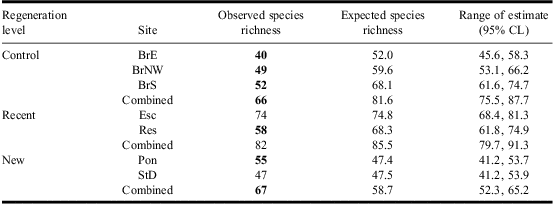
The expected species richness is the average based on 10 000 randomisations of the observed species abundance distribution. Observed values that fall outside the 95% confidence interval (indicated in boldface) indicate statistically significant differences from expectation.
BrE: Brock East, BrNW: Brock Northwest, BrS: Brock South, Esc: Escarpment, Res: Residences, Pon: Pond, StD: St. David's.
Species accumulation curves comparing species richness levels in control, recent, and new sites, based on pan trap and sweep samples. “Week” indicates time elapsed since mid-April 2003.
Rarefaction curves comparing species richness levels in control, recent, and new sites, based on pan trap and sweep samples. Species richness is estimated using Mao's Tau, calculated using the computer program EstimateS (Colwell Reference Colwell2009).
Floral diversity
Bees were collected from 28 different species of flowering plants in the seven sampling sites. The diversity of flowers growing in patches large enough for five-minute collections (see “Methods” section) was highest in control sites (16 species), followed by recent sites (15 species), and new sites (10 species; Table 1). There were eight plant species exclusive to control sites, five exclusive to recent sites, and three exclusive to new sites. Only two plant species (wild carrot, Daucus carota Linnaeus (Apiaceae), and oxeye daisy, Leucanthemum vulgare Lamarck (Asteraceae)) were found in all sites. Altogether, we performed 53 flower collections in the three control sites, 48 in the two recent sites, and 29 in the new sites. This suggests that overall there were more blossoms available for bees to forage on in recent sites. The number of flower collections per site (our measure of floral abundance) was significantly correlated with both bee abundance (Pearson r = 0.91, n = 7, P = 0.0046) and bee species richness (Pearson r = 0.84, n = 7, P = 0.0179; Fig. 6). However, floral diversity, as measured by the number of abundant floral species in each site, was not correlated with either bee abundance (Pearson r = 0.57, n = 7, not significant) or species richness (Pearson r = 0.24, n = 7, not significant).
Correlation between blossom abundance, as measured by the number of five-minute flower collections and bee abundance (open diamonds) versus species richness (closed triangles). Each individual point represents one site. Both trends are significant (statistics in text). Control sites are represented by grey symbols, recent sites by black and new sites by white.
Discussion
Bee abundance and diversity patterns differed according to meadow regeneration level, although not exactly as we had predicted. Based on the general predictions of the Intermediate Disturbance Hypothesis (Connell Reference Connell1978) and patterns observed in bumblebees (Carvell Reference Carvell2002), we had predicted that the highest bee abundance and species richness would be found in recent sites, the lowest abundance and diversity would be found in new sites, and that control sites would fall in between. This prediction was upheld for abundance as bees were most abundant in recent sites, followed by control, and then new sites. However, the pattern of bee species richness was slightly different than predicted, being highest in recent sites, followed by new, and then control sites. The differing patterns for bee abundance and diversity indicate that species richness in each site and regeneration level was not merely a function of the number of bees attracted to each area. In fact, the randomisation analysis indicated that control sites had lower species richness than expected based on abundance, while new sites had higher than expected species richness, so the composition of these two assemblages was significantly different. The species accumulation curve (Fig. 4) suggests that new sites had higher than expected species richness, because of greater species turnover, with new species being captured there at an almost constant rate throughout the summer (Fig. 4).
The ages of our sites in terms of availability to bees, suggest that recolonisation of the newly available sites began as soon as bees emerged from hibernation in spring 2003: in new sites, where there would have been no or very few bees in 2002, we found 67 bee species in 2003. Most of these were probably foraging commuters that arrived from nesting areas on the periphery of the GQNS (including the recent sites) or from older sites, such as those on the Brock campus. The three-year-old recent sites contained 82 species, suggesting that bee diversity continues to increase for several years following major disturbance, as habitat regenerates and naturalises. The control sites, which were much older, being at least 40 years old, contained only 66 species, suggesting that during some period of time between 3 and 40 years of relatively low disturbance, bee species richness declines as a result of competitive exclusion (Connell Reference Connell1978). It will be interesting in longitudinal studies of the regenerated sites to observe the time frame for this decline and to identify successional patterns.
Probably the most important proximate factor influencing bee abundance and diversity was blossom availability. Our rough measure of flowering plant diversity indicates that the three regeneration levels differed in terms of blossom availability, as indeed was expected. The recent sites had been deliberately planted with “native” wildflowers from local nurseries (where “native” generally means plants are from North America, not necessarily from the local region), whereas the new sites were more cheaply replanted by “hydro-seeding”, which involves spraying a liquid slurry of plant seeds, mostly grasses onto bare soil. Over all our sites, blossom availability was strongly correlated with bee abundance and species richness. The influence of floral abundance and diversity on bee abundance and diversity is well known (Gathmann et al. Reference Gathmann, Greiler and Tscharntke1994; Tscharntke et al. Reference Tscharntke, Gathman and Steffan-Dewenter1998; McIntyre and Hostetler Reference McIntyre and Hostetler2001; Steffan-Dewenter and Tscharntke Reference Steffan-Dewenter and Tscharntke2001; Carvell Reference Carvell2002; Potts et al. Reference Potts, Vulliamy, Dafni, Ne'eman, O'Toole and Roberts2003a, Reference Potts, Vulliamy, Dafni, Ne'eman and Willmer2003b). The attractiveness of the dense vegetation in our new sites at the end of the summer is likely the reason that these areas ended up with more bee species than the control sites, which had fewer flowers at that time. Throughout the summer, most of the bees in the new sites were likely commuters looking for foraging resources, rather than bees that were actually nesting there. The high numbers of Apis mellifera Linnaeus (Hymenoptera: Apidae) captured in new sites were likely attracted by the dense, tall stands of sweet white clover that covered these areas by mid to late summer.
Another important resource difference among regeneration levels was availability of nesting substrate. The most common nesting habits among bee species at our sites are ground and twig nesting (Richards et al. Reference Richards, Rutgers-Kelly, Gibbs, Vickruck, Rehan and Sheffield2011). Plenty of bare ground was available in new sites at the beginning of the study, although plant cover increased dramatically over the course of the summer. However, many ground-nesting bees, especially the sweat bees, which make up the greatest proportion of both individuals and species at our sites (Richards et al. Reference Richards, Rutgers-Kelly, Gibbs, Vickruck, Rehan and Sheffield2011), are philopatric, tending to nest close to their natal nests (Packer et al. Reference Packer, Sampson, Lockerbie and Jessome1989; Potts and Willmer Reference Potts and Willmer1997; Soucy Reference Soucy2002). As a result, it is very unlikely that many ground nesters actually nested in new sites in 2003, at least in the first half of the season. In 2003, no twig nesting could have occurred in any new sites since shrubs had not yet had time to grow to sufficient size to provide the dead, woody stems used for nesting by common local bees like Ceratina Latreille (Hymenoptera: Apidae), Hylaeus Fabricius (Hymenoptera: Colletidae), and Megachile Latreille (Hymenoptera: Megachilidae) (Vickruck et al. Reference Vickruck, Rehan, Sheffield and Richards2011). Indeed, megachilid bees and Ceratina were more frequent in control and recent sites where they would have found more nesting substrate.
Differences in nesting substrate might also help to explain bee abundance patterns in control and recent regeneration sites. While the diversity of nesting substrates was likely greatest in control and recent sites (because shrubs had more time to grow), plant ground cover was more extensive in these areas. Ground-nesting bee species, the most common guild in our sites (Richards et al. Reference Richards, Rutgers-Kelly, Gibbs, Vickruck, Rehan and Sheffield2011), would likely have found it more difficult to nest where grasses or flowering plants with dense root systems were growing. Moreover, the heavy clay soil would likely be more difficult to excavate in control sites, because they had not been tilled or mowed recently. Carvell (Reference Carvell2002) found a negative correlation between bumble bee abundance and the density of vegetation and leaf litter, and Potts et al. (Reference Potts, Vulliamy, Dafni, Ne'eman and Willmer2003b, Reference Potts, Vulliamy, Roberts, O'Toole, Dafni and Ne'Eman2005) found that the availability of nesting resources was closely linked to the abundance of the most common bee species in communities (including a very abundant, ground-nesting halictid).
We know very little of potential competitive interactions among the bee species at our sites. Certainly, the most abundant flower species at our sites attract multiple bee species (Richards et al. Reference Richards, Rutgers-Kelly, Gibbs, Vickruck, Rehan and Sheffield2011), so perhaps there is competition for food resources. We did not find any specialist foragers, which is not surprising given that the vegetation in all of our sites is dominated by abundant nonnative species and there was no attempt to restore endemic flowering plants and shrubs (some of the “native” flowers that were planted are native to North America, but not to southern Ontario). Local competition for nesting habitat and substrate has been experimentally demonstrated for the two abundant pygmy carpenter bees, Ceratina mikmaqi Rehan & Sheffield and C. calcarata Robertson (Hymenoptera: Apidae) (Vickruck et al. Reference Vickruck, Rehan, Sheffield and Richards2011), and we also know that hole-nesting species that do not carve their own nests also take advantage of burrows created by carpenter bees (Vickruck et al. Reference Vickruck, Rehan, Sheffield and Richards2011), hence appropriate substrate may be relatively scarce. The distributions of the five bee families and the 15 most abundant genera imply that there may be competition for both food and nesting resources. For instance, megachilids were the only bees in which the abundance order among regeneration levels was control > recent > new, and this pattern likely reflects their requirements for nesting substrate. The most common species in our sites, Osmia conjuncta (Cresson) (Hymenoptera: Megachilidae), nests in empty snail shells, and the other species are cavity nesters (Richards et al. Reference Richards, Rutgers-Kelly, Gibbs, Vickruck, Rehan and Sheffield2011). Appropriate nesting substrate for these bees was not available in new areas in 2003 and woody shrubs were more common in and near the control areas.
Conclusion
Our study represented a comparison of control, recent, and new sites at the same point in time and in the same bee community. The isolation of Brock University and the GQNS and the surrounding landscape of forested cliffs, lakes, highways, and suburbs, make it likely that the control sites at Brock provided much of the source pool for bees that emigrated to the recent and new sites at the GQNS, so the assemblage studied here can fairly be considered to represent a single, relatively isolated bee community. Because we studied three regeneration levels in the same season, we could rule out variable population dynamics or responses to local weather conditions as explanations for the differences we observed among sites. Based on the differences in age among our sites, we have inferred a possible time course for succession in which bee communities progress from initial colonisation of more or less empty habitat to a high diversity mix of pioneers and strong competitors within about three years. Subsequently, this early, high diversity community gives way to a lower diversity community from which pioneers have been competitively excluded. Our intention is to further test this hypothesis of succession using a longitudinal study focussed on the bee community at these same sites over a 5–10-year period, attempting to tease apart the demographic effects of succession and other local factors, such as weather. In addition, the recent closure and regeneration of two additional Niagara landfill sites in 2011 has presented us with the opportunity to replicate our observations in additional localities. This should be especially valuable for strengthening inferences about the identities of bees more likely to represent early versus late-stage colonists and to better quantify covariation between flowering plant and bee succession over time.
Acknowledgements
The authors thank Tom Onuferko and two anonymous reviewers for very helpful comments on the manuscript. Jason Gibbs, Cory Sheffield, Sheila Dumesh, Sheila Colla, Sandra Rehan, Jess Vickruck, Sam Droege, and Terry Griswold provided valuable assistance in identifying specimens collected in 2003. This research was supported by a Natural Sciences and Engineering Research Council of Canada (NSERC) post-graduate scholarship to A.R.K. and a NSERC Discovery grant to M.H.R.