INTRODUCTION
Wild meat consumption takes place in the context of complex economic, geographic, political and cultural realities. Wild meat can be less expensive than domestic meat (Fa et al. Reference Fa, Currie and Meeuwig2003) and can improve food security (regular availability of, access to and utilization of safe and nutritious food preferred by the consumer; USAID 1992; Pinstrup-Anderson Reference Pinstrup-Anderson2009). Wild meat can add important nutritional value (e.g. micronutrients; Powell et al. Reference Powell, Thilsted, Ickowitz, Termote, Sunderland and Herforth2015) to consumer diets by increasing dietary diversity (Sunderland et al. Reference Sunderland, Powell, Ickowitz, Foli, Pinedo-Vasquez, Nasi and Padoch2013) and decreasing hidden hunger (Sneyd 2013). This is important given that 925 million individuals were considered hungry in 2010 (UN SCN 2010). Wild meat also provides economic security or fallback income for the rural poor (Kumpel et al. Reference Kumpel, Milner-Gulland, Cowlishaw and Rowcliffe2010; Golden et al. Reference Golden, Bonds, Brashares, Rodolph Rasolofoniaina and Kremen2014 a). When wild meat resources become less available, some communities transition to other food sources within one generation (Bennett Reference Bennett2002) while poorer and/or remote communities have fewer alternatives. In urban areas, where wild meat can be a luxury good (Bennet Reference Bennett2002; Kumpel et al. Reference Kumpel, Milner-Gulland, Cowlishaw and Rowcliffe2010) or in higher demand (‘bushmeat as a normal good hypothesis’; Brashares et al. Reference Brashares, Golden, Weinbaum, Barrett and Okello2011), trade is possibly becoming more commercialized even as availability decreases (Lindsey et al. Reference Lindsey, Balme, Becker, Begg, Bento, Bocchino, Dickman, Diggle, Eves, Henschel, Lewis, Marnewick, Mattheus, Weldon McNutt, McRobb, Midlane, Milanzi, Morley, Murphree, Opyene, Phadima, Purchase, Rentsch, Roche, Shaw, van der Westhuizen, Van Vliet and Zisadza-Gandiwa2013).
Wild meat consumption is impacted by several micro- and macro-drivers. First, economic vulnerability can affect consumption rates (it can be the last resort of poorer people; Lindsey et al. Reference Lindsey, Balme, Becker, Begg, Bento, Bocchino, Dickman, Diggle, Eves, Henschel, Lewis, Marnewick, Mattheus, Weldon McNutt, McRobb, Midlane, Milanzi, Morley, Murphree, Opyene, Phadima, Purchase, Rentsch, Roche, Shaw, van der Westhuizen, Van Vliet and Zisadza-Gandiwa2013). Second, consumption can be influenced by cultural values (e.g. social status; deFrance Reference deFrance2009). Third, immigration can change consumption patterns over large scales (Poulsen et al. Reference Poulsen, Clark, Mavah and Elkan2009). Fourth, consumer behaviour is impacted by price and preference (higher prices decrease consumption unless wild meat is strongly preferred; Dostie et al. Reference Dostie, Haggblade and Randriamamonjy2002; Kumpel et al. Reference Kumpel, Milner-Gulland, Cowlishaw and Rowcliffe2010). Finally, consumption is affected by legal context (Lindsey et al. Reference Lindsey, Balme, Becker, Begg, Bento, Bocchino, Dickman, Diggle, Eves, Henschel, Lewis, Marnewick, Mattheus, Weldon McNutt, McRobb, Midlane, Milanzi, Morley, Murphree, Opyene, Phadima, Purchase, Rentsch, Roche, Shaw, van der Westhuizen, Van Vliet and Zisadza-Gandiwa2013). Wild meat consumption involves a continuum of scenarios from rural, subsistence-based consumption to commercial, international trade (Brashares et al. Reference Brashares, Golden, Weinbaum, Barrett and Okello2011) and is driven by a suite of micro- and macro-level drivers.
Wild meat consumption is occurring at unsustainable levels (Fa et al. Reference Fa, Currie and Meeuwig2003; Kumpel et al. Reference Kumpel, Milner-Gulland, Cowlishaw and Rowcliffe2010). Wild meat consumption (up to 4.5 million tonnes/year in the Congo Basin; Nasi et al. Reference Nasi, Taber and van Vliet2011) has resulted in population declines in larger-sized animals (Lindsey et al. Reference Lindsey, Balme, Becker, Begg, Bento, Bocchino, Dickman, Diggle, Eves, Henschel, Lewis, Marnewick, Mattheus, Weldon McNutt, McRobb, Midlane, Milanzi, Morley, Murphree, Opyene, Phadima, Purchase, Rentsch, Roche, Shaw, van der Westhuizen, Van Vliet and Zisadza-Gandiwa2013). In Central Africa, the supply of wild meat is expected to drop 81% by 2050 due to overhunting (Fa et al. Reference Fa, Currie and Meeuwig2003). In many areas, wild meat will not be available in the future (Bennett Reference Bennett2002); food insecurity and nutrient deficiencies are likely to increase unless alternates are found (Fa et al. Reference Fa, Currie and Meeuwig2003; Lindsey et al. Reference Lindsey, Balme, Becker, Begg, Bento, Bocchino, Dickman, Diggle, Eves, Henschel, Lewis, Marnewick, Mattheus, Weldon McNutt, McRobb, Midlane, Milanzi, Morley, Murphree, Opyene, Phadima, Purchase, Rentsch, Roche, Shaw, van der Westhuizen, Van Vliet and Zisadza-Gandiwa2013; Sunderland et al. Reference Sunderland, Powell, Ickowitz, Foli, Pinedo-Vasquez, Nasi and Padoch2013).
Wild meat enhances food security in areas where human poverty and malnutrition occur near wild habitats (Golden et al. Reference Golden, Fernald, Brashares, Rodolph Rasolofoniaina and Kremen2011; Sunderland et al. Reference Sunderland, Powell, Ickowitz, Foli, Pinedo-Vasquez, Nasi and Padoch2013; Powell et al. Reference Powell, Thilsted, Ickowitz, Termote, Sunderland and Herforth2015) such as in Madagascar. In Madagascar, over 90% of the population lives on <2 US$ per day (World Bank 2013) and 70% of the population consumes insufficient calories (<2133 kcal/day; Dostie et al. Reference Dostie, Haggblade and Randriamamonjy2002). In 2004, the prevalence of anaemia in non-pregnant women was 44.9% (up from 42.4% in 1996; UN SCN 2010). Fifty percent of deaths before the age of five are related to malnutrition, 47% of children aged five and under are stunted (chronic malnutrition) and 13% are wasted (acute malnutrition; Measure DHS 2005).
Many wild animals are consumed in Madagascar (Goodman & Raselimanana Reference Goodman and Raselimanana2003; Golden Reference Golden2009), despite national laws limiting hunting of these animals (Rakotoarivelo et al. Reference Rakotoarivelo, Razafimanahaka, Rabesihanaka, Jones and Jenkins2011). Consumption occurs for subsistence, following human–wildlife conflict or for luxury reasons; the reasons for consumption varies by species and region (Goodman & Raselimanana Reference Goodman and Raselimanana2003; Golden Reference Golden2009; Jenkins et al. Reference Jenkins, Keane, Rakotoarivelo, Rakotomboavonjy, Randrianandrianina, Razafimanahaka, Ralaiarimalala and Jones2011). However, the relative importance of these drivers has not been examined, especially in the urban context.
We assessed wild meat consumption in Madagascar over large spatial scales and across ethnic groups. Our first objective was to quantify the amount and clarify the purpose of consumption. In accordance with patterns observed in previous studies in other regions of Madagascar (Golden Reference Golden2009; Jenkins et al. Reference Jenkins, Keane, Rakotoarivelo, Rakotomboavonjy, Randrianandrianina, Razafimanahaka, Ralaiarimalala and Jones2011), we hypothesized that in central, west and northwest Madagascar most people would have eaten wild meat in their lifetime, a wide variety of animal groups would have been consumed, domestic meat (i.e. meat from farmed animals) would be preferred over and consumed more frequently than wild meat, the purpose of consumption would vary by animal group and wild meat consumption would be higher in areas with higher food insecurity.
Our second objective was to understand the micro- and macro-level drivers of wild meat consumption. Several variables (food security, ethnic beliefs, individual preferences, demographic/geographic variables) have been correlated with wild meat consumption (Poulsen et al. Reference Poulsen, Clark, Mavah and Elkan2009; Kumpel et al. Reference Kumpel, Milner-Gulland, Cowlishaw and Rowcliffe2010; Lindsey et al. Reference Lindsey, Balme, Becker, Begg, Bento, Bocchino, Dickman, Diggle, Eves, Henschel, Lewis, Marnewick, Mattheus, Weldon McNutt, McRobb, Midlane, Milanzi, Morley, Murphree, Opyene, Phadima, Purchase, Rentsch, Roche, Shaw, van der Westhuizen, Van Vliet and Zisadza-Gandiwa2013); we hypothesized that each variable would affect wild meat consumption, but that they would differ in relative importance.
Our third objective was to examine variation in wild meat consumption over time and space. Because of the long history of wild meat consumption in Madagascar (Perez et al. Reference Perez, Godfrey, Nowak-Kemp, Burney, Ratsimbazafy and Vasey2005; Jenkins et al. Reference Jenkins, Keane, Rakotoarivelo, Rakotomboavonjy, Randrianandrianina, Razafimanahaka, Ralaiarimalala and Jones2011), we hypothesized that wild meat consumption, frequency of consumption or price would not have varied over time. Nonetheless, because the 2009 coup d’état may have accelerated hunting of some animals (Schwitzer et al. Reference Schwitzer, Mittermeier, Johnson, Donati, Irwin, Peacock, Ratsimbazafy, Razafindramanana, Louis, Chikhi, Colquhoun, Tinsman, Dolch, LaFleur, Nash, Patel, Randrianambinina, Rasolofoharivelo and Wright2014), we hypothesized that consumption of specific types of wild meat would have increased in the years following the coup, and that this increase would have resulted from lax enforcement following the coup d’état. Because some larger-sized animals have been locally extirpated (Perez et al. Reference Perez, Godfrey, Nowak-Kemp, Burney, Ratsimbazafy and Vasey2005), we hypothesized that recent consumption would be of smaller-sized animals. Because regions or ethnic groups may differ in beliefs, preferences and taboos (Lambek Reference Lambek1992), we hypothesized that patterns of consumption would vary with regional and ethnic characteristics.
METHODS
Study site
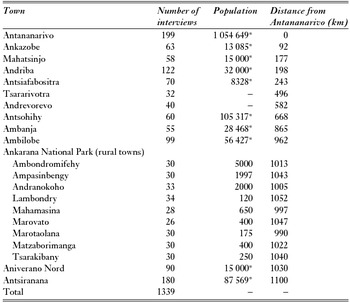
Data were collected (May–August 2013) in 12 urban (range: 6622–1 054 649 inhabitants) and nine rural towns (range: 120–5000 inhabitants) in central and northern Madagascar (Table 1). Towns were located along the 1100 km-long highway connecting the northern regional capital (Antsiranana) with the national capital (Antananarivo) in the centre of the country, which crosses several habitat types (Goodman & Benstead Reference Goodman and Benstead2003) and ethnic groups (CIA 1976). Rural towns were sampled around the perimeter of Ankarana National Park and were located within 20 km of the highway.
Towns included in the study and the sample size of interviews at each location. The national capital Antananarivo was the southernmost population centre included in this study while the regional capital Antsiranana was the northernmost. Population estimates retrieved from the Ilo (2003) database are indicated by (*); other population estimates were retrieved from elected officials.

Social surveys
Research design was approved by the Temple University (Philadelphia, USA) institutional review board (an ethical review board) and conducted following all applicable laws, with authorization from the Madagascar Ministry of Water and Forests, Madagascar National Parks and the highest-ranking locally elected official.
Data were collected using semi-structured interviews (Rietbergen-McCracken & Narayan Reference Rietbergen-McCracken and Narayan1998) of adult male and female heads-of-household. Sampling of households was systematic in rural towns and stratified-random in urban towns. No identifying (i.e. personal) information was collected. Interviews were conducted in the interviewee's language of choice (French or local Malagasy dialect) after verbal informed consent had been secured by an American/British researcher and a translator. Further details on sampling protocols are available in Reuter et al. (Reference Reuter, Gilles, Wills and Sewall2015).
During interviews, which lasted 11 ± 0.53 minutes (mean ± 95% confidence interval [CI]), data were collected on the consumption of wild and domestic meat only, not that of fish and non-meat proteins. Interview questions (Appendix S1) were designed to obtain systematic data on the interviewee's three-day diet recall (acquisition and consumption of meat within the previous three days; Jenkins et al. Reference Jenkins, Keane, Rakotoarivelo, Rakotomboavonjy, Randrianandrianina, Razafimanahaka, Ralaiarimalala and Jones2011), including preferred meat type, lifetime acquisition and consumption of wild meat (Jenkins et al. Reference Jenkins, Keane, Rakotoarivelo, Rakotomboavonjy, Randrianandrianina, Razafimanahaka, Ralaiarimalala and Jones2011), meat-related food taboos and changes in meat-eating habits over time. Given the relatively short interviews and the inclusion of questions on activities that are sometimes illegal, respondents may have under-reported sensitive information.
Analysis
Unless otherwise noted, results are presented as means ± 95% CIs. Information is aggregated for rural towns to protect anonymity. Sometimes, the results are delineated between lifetime wild meat habits and recent wild meat habits; lifetime wild meat habits include all data while recent data are from 2013 only (6–8 month period prior to interviews). Sometimes changes were examined along a continuum of human population. Human population data were retrieved from Ilo (2003) or from elected officials and were natural-log transformed prior to analyses to meet assumptions of normality. In one case, percentage data was arcsine transformed to meet assumptions of normality.
Initial questions on meat consumption were open ended. Responses on domestic meat included a wide diversity of species, though analyses focus on chicken, pig and zebu (a subspecies of cattle found throughout Madagascar). Detailed follow-up questions focused on wild mammal consumption. Because respondents typically could not identify exact species, but could differentiate between broader animal groups, data were aggregated into the following mammal groups: lemurs (Lemuroidea), bats (Chiroptera), tenrecs (Tenrecinae), fossa (Cryptoprocta ferox), mongoose (Herpestidae), rats and mice (Rodentia), civets (Viverridae), wild cat (Felis silvestris) and wild pig (Potamochoerus larvatus).
Hypotheses in objective one were tested with a Kruskal–Wallis Rank Sum Test (Steel–Dwass Multiple Comparisons post hoc Test) or a Pearson Chi-squared Test. Relationships between wild meat consumption and predictor variables were examined with regression. Hypotheses testing whether most people had eaten wild meat in their lifetime, whether a wide variety of animal groups would have been consumed and whether domestic meats were preferred over wild meat used towns as replicates. Hypotheses testing whether the purpose of consumption varied by animal group and whether wild meat consumption would be higher in areas with greater food insecurity used respondents as replicates where sample sizes were small and towns as replicates otherwise.
For objective two, a two-tier model estimation and selection approach was used to examine the relative importance of five variables in predicting recent wild meat consumption. The three predictor variables examined at the respondent level (micro-level drivers) were: prevalence of taboos, an index (0–9) indicating the number of mammal groups against which a respondent had a consumption taboo; access to meat, whether meat was consumed during the three-day diet recall (food security proxy); and meat preference (categorical variable: wild meat/domestic meat/no meat). The response variable, recent wild meat consumption (number of wild animals consumed in 2013, a 6–8 month time period) was log-transformed prior to analysis. Access to meat in the three-day diet recall is a measure of short-term/transitionary rather than long-term/permanent food security and therefore may not capture all dimensions of food security (USAID 1992; Pinstrup-Anderson Reference Pinstrup-Anderson2009). The use of a three-day recall is shorter than in some previous studies of food security (e.g. Hoddinott & Yohannes Reference Hoddinnot and Yohannes2002; but see McIntyre et al. Reference McIntyre, Tarasuk and Jinguang Li2007), but reflects sampling constraints; the geographic scope of the study prohibited data collection over multiple time points. In addition, diet recall in Madagascar decreases substantially after three days (Jenkins et al. Reference Jenkins, Keane, Rakotoarivelo, Rakotomboavonjy, Randrianandrianina, Razafimanahaka, Ralaiarimalala and Jones2011). Three-day diet recalls captured some aspects of food security in one visit without compromising data quality. All interviews were conducted during the dry season and reflect food availability during this season. The interview period corresponds with the time when rice, a Malagasy staple food, is most available and when prices are the lowest (Dostie et al. Reference Dostie, Haggblade and Randriamamonjy2002).
We examined how variables at the town level (macro-level drivers) impacted wild meat consumption. Predictor variables included those retained in the best model from respondent-level analyses, including prevalence of taboos (averaged at the town level) and meat preference (percentage of people within a town with a preference for wild meat). Two additional predictor variables were included: province (province in which a town was located; proxy for regional and ethnic characteristics); and town population (human population). Town population was log-transformed prior to analysis. The response variable was recent wild meat consumption (in 2013, averaged at the town level and log-transformed prior to analysis). Correlation coefficients suggested no pairwise correlations (|r| < 0.20) among these five variables.
We identified a set of candidate models and limited complexity to a maximum of two pairwise interactions. Candidate models were ranked using the small-sample-size corrected Akaike Information Criterion (AICc; Hurvich & Tsai Reference Hurvich and Tsai1989). The best model had the lowest AICc. ΔAICc (the difference in AICc values from the best model, where ΔAICc < 2 suggests substantial support for a model) and Akaike weights (wi ; the weight of evidence of a model relative to the other candidate models) were used to evaluate relative support for alternate models (Burnham & Anderson Reference Burnham and Anderson2002).
For objective three, wild meat prices were determined from 452 purchase records, reported during interviews across all urban and seven rural towns. The change of wild meat price over time was analysed (2005–2013 for bats, 2008–2013 for tenrecs and wild pigs). Prices were adjusted for inflation using two consumer price indices (Food Index and General Index, 2000 is the base year) from FAOSTAT (2013), and converted into base year prices (Malagasy Ariary) using the average index number for 2005. Price indices for 2005–2012 represented annual averages; 2013 price indices were averages from January to August 2013.
RESULTS
Amount and purpose of wild meat consumption
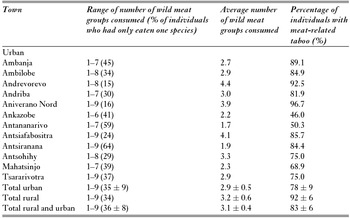
Most individuals across all towns had consumed wild meat at least once (78 ± 7%; Fig. S1 and Table S1). A diversity of mammals was consumed in each town (Table 2); tenrecs and bats were the most commonly consumed groups. Individuals consumed meat from 3.06 ± 0.36 wild animal groups (Table 2).
The range of mammalian wild meat groups consumed (by town), average number of wild animal groups consumed and the percentage of people having meat-related taboos in a town. Total rural includes the aggregated data (to protect anonymity) from nine rural towns around the Ankarana National Park.

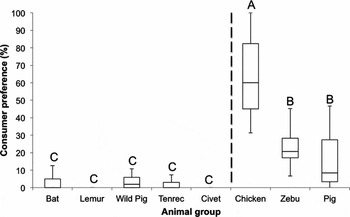
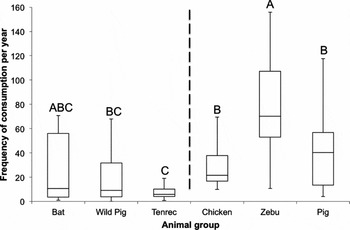
Most respondents expressed a preference for a type of meat (97 ± 2%); the remainder expressed no preference (2.02 ± 2.02%) or were vegetarian (0.05 ± 0.10%). Few respondents preferred wild meat (8 ± 3%), the three domestic meats were the most preferred (Fig. 1; Steel–Dwass Multiple Comparisons, p < 0.05). Individuals who preferred wild pigs and bats consumed them at the same frequency as domestic meats (Fig. 2).
Consumer preference (% of individuals who preferred a type of meat) of wild and domestic meat (wild meats on the left, domestic meats on the right; towns as replicates; letters indicate differences based on Steel–Dwass Multiple Comparisons, p < 0.05). Only wild meats that were listed as preferred are included.

Frequency of consumption of domestic and wild meat (towns as replicates) for individuals with a preference for these meats (wild meats on the left, domestic meats on the right; towns as replicates; letters indicate differences based on Steel–Dwass Multiple Comparisons, p < 0.05). Only animals whose meat was preferred by >20 respondents are shown.

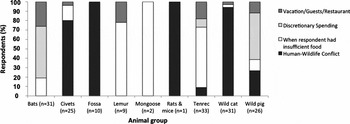
Mammals were hunted and consumed for differing reasons (Fig. 3). Three of the four carnivore groups were eaten primarily due to human–wildlife conflict (civets, fossa, wild cats; ≥80% of respondents). Other groups were consumed due to insufficient food resources (lemurs, mongoose, tenrecs; all ≥64%) or as a luxury item, purchased using discretionary income (bats, wild pigs; both ≥50%). The percentage of individuals who consumed wild meat due to human–wildlife conflict differed by animal group (Pearson Chi-square, degrees of freedom [DF] = 6, χ2 = 108.636, p < 0.0001; rats/mice and mongoose removed from analysis due to small sample sizes). The percentage of people who cited human–wildlife conflict as a reason for consuming wild meat decreased with the human population size of a town (regression, F (1,8) = 11.1232, p = 0.0103). By contrast, the percentage of people who cited a lack of sufficient food as the reason they consumed wild meat did not change with the human population of a town (regression, F (1,8) = 1.5679, p = 0.2459; percentage data arcsine transformed).
Reasons why respondents had consumed wild meat (respondents are replicates). ‘vacation/guests/restaurant’ = eaten when respondent was on vacation, hosting guests or eating at a restaurant; ‘discretionary spending’ = eaten when respondent could purchase meat; ‘when respondent had insufficient food’ = eaten when respondent had no other meat options; ‘human–wildlife conflict’ = eaten after animal consumed human food or was caught in traps used to protect farm animals and crops.

A town's food security (proportion reporting consuming meat during three-day diet recall) was inversely related to its respondents’ recent (6–8 months prior to interview) wild meat consumption (regression, F (1,19) = 5.2469, p = 0.0336; R2 = 0.216). The percentage of people who cited a lack of sufficient food as the reason behind the consumption of wild meat differed significantly by animal group (Pearson Chi-square, DF = 6, χ2 = 54.265, p < 0.0001; rats/mice and mongoose removed from analysis for small sample size). Lemurs (regression, F (1,19) = 6.9750, p = 0.0161), tenrecs (regression, F (1,19) = 8.8948, p = 0.0077) and wild pigs (regression, F (1,19) = 6.6373, p = 0.0185) were consumed at higher frequencies in 2013 in food-insecure towns, but all others were not (p-values > 0.20).
Micro- and macro-level drivers of wild meat consumption
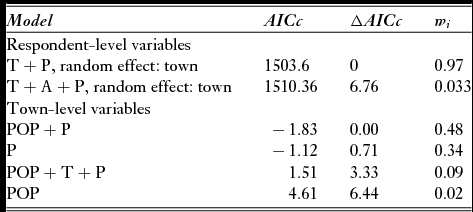
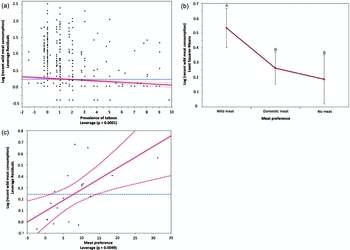
Recent wild meat consumption at the respondent level was best explained by a model with the predictor variables prevalence of taboos and meat preference (Table 3 and Table S2) but not the variable access to meat. When examining the best model, both variables were predictors of recent wild meat consumption at the respondent level (multiple regression; R2 = 0.25; prevalence of taboos, p < 0.0001; meat preference [wild meat–no meat], p < 0.0001; meat preference [domestic meat–no meat], p = 0.018; Fig. 4).
Results of model selection with the corrected Akaike information criterion (AICc), the difference from the best model (ΔAICc) and the Akaike weight (wi ). Only the top models (ΔAICc < 7) are shown here; the full list of all models is in Table S2. A = Access to meat; L = Province (location); P = Preference for meat; POP = Town population; T = Prevalence of taboos.

Plots of recent wild meat consumption against (a) prevalence of taboos among individuals (leverage plot), (b) individuals’ meat preferences (least squares means) and (c) meat preference at town level (leverage plot). Fitted lines show results of multiple regression analysis.

At the town level, recent wild meat consumption was best explained by the variables town population and meat preference (Table 3 and Table S2), but not the variables prevalence of taboos or province. However, a second model that also ranked highly (ΔAICc = 0.71) only retained the variable meat preference. Examination of the best model showed that only meat preference was a significant predictor of wild meat consumption at the town level (multiple regression; R2 = 0.42; town population, p = 0.7194; meat preference, p = 0.0049; Fig. 4).
Variation in wild meat consumption over time and space
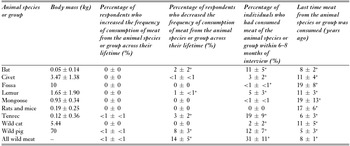
Respondents had consumed wild meat in every decade since the 1940s and many (31 ± 11%) had consumed wild meat in the 6–8 months prior to the interview (Table 4). Most respondents had not changed their rates of wild meat consumption over their lifetimes (85 ± 5%; Table 4). Some had decreased (14 ± 5%) and almost none had increased their consumption (<1 ± <1%; Table 4). On average, respondents had last eaten wild meat 4 ± 3 years ago (Table 4).
Changes in wild meat consumption, rates of recent consumption (6–8 months prior to the interview) and the average duration since last consumption. Body mass estimate for wild cats was retrieved from Brockman et al. (2008). All other body size estimates were calculated from Garbutt (2007), using the average of the maximum mass recorded for each species in an animal group. Averages ± 95% confidence interval, with towns as replicates. *Significant difference from zero, one sample t-test, p < 0.05.

Prices for wild meat had not changed over the previous 6–9 years. The price of a whole bat did not change from 2005 to 2013 when adjusted for inflation (General Index: mixed effects model, regression, p = 0.9461; Food Index: mixed effects model, regression, p = 0.9141). Inflation-adjusted prices likewise did not change from 2008–2013 for tenrec (price per whole tenrec; General Index: mixed effects model, regression, p = 0.6989; Food Index: mixed effects model, regression, p = 0.7311) or wild pig (General Index, price per ‘piece’: mixed effects model, p = 0.7890; price per kg: p = 0.10; Food Index, price per ‘piece’: mixed effects model, regression, p = 0.7923; price per kg: p = 0.1094, Fig. S2).
Consumption of lemurs, bats, tenrecs, wild pig and civets had declined in recent years (Table 4). Nonetheless, consumption of some of these groups was not uncommon; more than 10 and 20% of respondents had consumed bats, tenrecs and wild pigs in the previous 6–8 months (Table 4) and during the 2010–2013 period, respectively (Fig. S1 and Table S1).
Changes in wild meat consumption were unrelated to the 2009 coup d’état. Instead, other reasons were mentioned which varied by animal group (Fig. S3). When respondents stopped eating wild meat for religious reasons, it was usually after adopting Muslim or Adventist beliefs (n = 21 of 34 respondents interviewed). When respondents cited medical reasons as a motivation to reduce consumption, it often involved concerns about high cholesterol (n = 8 of 31). In some cases (n = 39), women adopted their husbands’ taboos after marriage or childbirth. Very few respondents (n = 2) stopped eating wild meat because they felt it was bad for the environment.
Of the 11 (of 1339) respondents who reported increasing their consumption of wild meat, five stopped following previously held taboos, two remarried and no longer followed ex-partners’ taboos and four changed their religions to ones that permitted consumption of wild meat.
The majority (61 ± 5%) of records of wild meat consumption were of smaller-sized animals (<0.5 kg; Table 4). The last consumption of larger-sized (≥0.5 kg) groups of wild animals by a respondent occurred on average ≥11 years ago, except in wild pigs (last consumed 5 ± 3 years ago; Table 4).
Finally, while patterns of wild meat consumption were broadly similar across the three provinces, the percentages of individuals who had taboos against wild meat, consumed wild meat following the 2009 coup d’état and decreased the frequency of consumption of wild meat across their lifetime were lower among respondents in the central highland province of Antananarivo than in the more northern provinces of Mahajunga or Antsiranana (Table S3).
DISCUSSION
Amount and purpose of wild meat consumption
Occasional consumption of wild meat was high and consumption occurred in all towns (urban and rural) and spanned political and ethnic boundaries. Bats and tenrecs were the most commonly consumed groups of wild animals, and people with a stated preference for bats and wild pigs consumed them at frequencies similar to those of chicken and domestic pig (Fig. 2). Nonetheless, consistent with Jenkins et al. (Reference Jenkins, Keane, Rakotoarivelo, Rakotomboavonjy, Randrianandrianina, Razafimanahaka, Ralaiarimalala and Jones2011), few individuals (8 ± 3%) preferred wild meat, and wild meat was preferred less than chicken, pig or zebu (Fig. 1).
Consistent with Jenkins et al. (Reference Jenkins, Keane, Rakotoarivelo, Rakotomboavonjy, Randrianandrianina, Razafimanahaka, Ralaiarimalala and Jones2011), the purpose of wild meat consumption varied by animal group (Fig. 3), and lemurs, tenrecs and mongoose were consumed when insufficient food was available. Carnivores were consumed opportunistically following human–wildlife conflict, while bats and wild pigs were consumed when discretionary income was available, suggesting a luxury purpose.
Micro- and macro-level drivers of wild meat consumption
Drivers of wild meat consumption were evident at both respondent and town scales. At the micro level, a person's taboos against wild meat and meat preferences predicted consumption. At the macro level, meat preference was the strongest predictor of consumption (Table 3 and Fig. 4). Access to meat was not retained in the models as a strong predictor of consumption. Other factors not included in our model may influence wild meat consumption (price, Dostie et al. Reference Dostie, Haggblade and Randriamamonjy2002; economic status, Lindsey et al. Reference Lindsey, Balme, Becker, Begg, Bento, Bocchino, Dickman, Diggle, Eves, Henschel, Lewis, Marnewick, Mattheus, Weldon McNutt, McRobb, Midlane, Milanzi, Morley, Murphree, Opyene, Phadima, Purchase, Rentsch, Roche, Shaw, van der Westhuizen, Van Vliet and Zisadza-Gandiwa2013); however, simple models explained a high amount of the variation in the data (respondent level R2 = 0.25, town level R2 = 0.42) for sometimes illegal and occasional consumption of nine wild mammalian groups.
Our results are consistent with other sub-Saharan urban areas (Lindsey et al. Reference Lindsey, Balme, Becker, Begg, Bento, Bocchino, Dickman, Diggle, Eves, Henschel, Lewis, Marnewick, Mattheus, Weldon McNutt, McRobb, Midlane, Milanzi, Morley, Murphree, Opyene, Phadima, Purchase, Rentsch, Roche, Shaw, van der Westhuizen, Van Vliet and Zisadza-Gandiwa2013), but different from poorer rural areas in Madagascar where consumption is linked with food security (Golden et al. Reference Golden, Fernald, Brashares, Rodolph Rasolofoniaina and Kremen2011). These differences illustrate the ‘continuum’ described in Brashares et al. (Reference Brashares, Golden, Weinbaum, Barrett and Okello2011) where the poorest rural communities consume wild meat for subsistence (examined in Madagascar by Golden et al. Reference Golden, Fernald, Brashares, Rodolph Rasolofoniaina and Kremen2011), semi-urban communities undertake a mixture of subsistence and commercial hunting (our rural towns) and urban communities undertake primarily commercial hunting (our urban towns). Given that the interview period corresponded with a high availability of rice (Dostie et al. Reference Dostie, Haggblade and Randriamamonjy2002), the drivers of wild meat consumption at both the individual and town level in Madagascar may differ when foods are more scarce. It should be noted that our proxy for food security (access to meat in the three days prior to the interview) captures only one aspect of food security. Therefore, additional research would be beneficial to increase understanding of how other facets of food security impact the consumption of wild meat.
Variation in consumption over time and space
Contrary to recent reports (Schwitzer et al. Reference Schwitzer, Mittermeier, Johnson, Donati, Irwin, Peacock, Ratsimbazafy, Razafindramanana, Louis, Chikhi, Colquhoun, Tinsman, Dolch, LaFleur, Nash, Patel, Randrianambinina, Rasolofoharivelo and Wright2014), most (85 ± 5%) people had not changed their rate of wild meat consumption and a substantial minority (14 ± 5%) had decreased it. In addition, meat prices had not varied over the previous 6–9 years (Fig. S2), which, though not definitive, suggests that demand may not have changed.
Taboos affected wild meat consumption. Most (83 ± 6%) respondents had meat-related taboos (Table 2) and, consistent with Jones et al. (Reference Jones, Andriamarovololona and Hockley2008), respondents with more taboos consumed less wild meat (Fig. 4). However, in contrast to suggestions that taboos are breaking down in Madagascar (Jones et al. Reference Jones, Andriamarovololona and Hockley2008; Jenkins et al. Reference Jenkins, Keane, Rakotoarivelo, Rakotomboavonjy, Randrianandrianina, Razafimanahaka, Ralaiarimalala and Jones2011), only five of 1339 respondents increased wild meat consumption because they stopped following a taboo. Meat-related taboos are not unique to Madagascar; religious, philosophical and theoretical hypotheses have been used to explain consumption norms (reviewed by Morris Reference Morris1994). In Madagascar taboos can be regional, village or family based, or impact just a few individuals (Lambek Reference Lambek1992). It remains unclear whether taboos influence wild meat consumption because respondents fear supernatural repercussions or because they wish to avoid social disapproval (Jones et al. Reference Jones, Andriamarovololona and Hockley2008).
Respondents did not cite changes in enforcement following the 2009 coup d’état as being related to wild meat consumption. Rather, respondents cited changing taste preferences (lemur and tenrec consumption); acquisition of new taboos following marriage, childbirth or a change in religion (wild pigs); and reduced availability of animals to hunt (bats; Fig. S3).
Conservation and food security implications
Our research provides new insights into previous discussions of sustainability of wild meat consumption in Madagascar. Past research has described wild meat hunting in Madagascar as unsustainable (Golden et al. Reference Golden, Fernald, Brashares, Rodolph Rasolofoniaina and Kremen2011), but our research adds to evidence that the sustainability of wild meat hunting may be mediated in part by animal body size. For example, larger-sized animals are more desirable to hunt (Garcia & Goodman Reference Garcia and Goodman2003), and our finding that recent consumption emphasized smaller-sized animals (bats and tenrecs; Fig. S1) suggests that larger-sized animals have become so rare that they are no longer hunting targets. Similar patterns have been observed on other continents (Wright et al. Reference Wright, Stoner, Beckman, Corlett, Dirzo, Muller-Landau, Nunez-Iturri, Peres and Wang2007). There are other reasons why smaller-sized species might be preferentially hunted (e.g. opportunistic hunting on farms may target small species; larger animals may need larger habitat patches not found near towns; it may take more effort to hunt larger species); further studies are needed to better understand the trends observed in this study. Some reports indicate that smaller-sized animals are also being hunted unsustainably in Madagascar (bats; Goodman Reference Goodman2006), though apart from bats, which have slow reproductive rates, small-sized animals can sometimes sustain moderate hunting pressure (Nielsen Reference Nielsen2006).
Given the context of heightened conservation programming in Madagascar (Schwitzer et al. Reference Schwitzer, Mittermeier, Johnson, Donati, Irwin, Peacock, Ratsimbazafy, Razafindramanana, Louis, Chikhi, Colquhoun, Tinsman, Dolch, LaFleur, Nash, Patel, Randrianambinina, Rasolofoharivelo and Wright2014), it is notable that environmental concerns were rarely cited as a reason for decreased wild meat consumption (Fig. S3). This may indicate that past conservation programs have not been entirely effective. Unsustainable hunting could be addressed through better enforcement and education (Keane et al. Reference Keane, Ramarolahy, Jones and Milner-Gulland2011) of existing wildlife regulations, implementation of new biologically relevant laws (Rakotoarivelo et al. Reference Rakotoarivelo, Razafimanahaka, Rabesihanaka, Jones and Jenkins2011) and using taboos to increase community compliance (Westerman & Gardner Reference Westerman and Gardner2013).
In addition, alternative food security programs could be instituted to assist both rural and urban communities in the dietary transition away from wild meats. Increased food security is linked with increased education rates and gender equality, reduced child mortality, improved maternal health and an ability to overcome infectious diseases (UN SCN 2010; IFPRI 2014). One potential solution would be to increase production of domestic animals as an alternative to wild meat (Golden et al. Reference Golden, Bonds, Brashares, Rodolph Rasolofoniaina and Kremen2014 b). Alternatively, the promotion of plant-based proteins and plants high in key micronutrients (Pimentel & Pimentel Reference Pimentel and Pimentel2003) could provide a means to improve nutrition among Malagasy people with religious and ethnic backgrounds that restrict the meats they can consume (Walsh Reference Walsh2007). A third option might be the development of agroforestry systems that promote productivity and complementarity in food production, even within small land areas (Styger et al. Reference Styger, Rakotoarimanana, Rabevohitra and Fernandes1999). However, alternative and additional food production systems should limit clearing and/or degradation of natural systems that serve as a source of nutritional benefits (Sunderland et al. Reference Sunderland, Powell, Ickowitz, Foli, Pinedo-Vasquez, Nasi and Padoch2013). Insights into the development of such programs may be gained from initiatives employing community-based conservation and integrated conservation and development approaches (Clarke & Jupiter Reference Clarke and Jupiter2010).
ACKNOWLEDGEMENTS
Thanks to T.E. Janvier, S. Hanitriniaina, J. Randrianarivelo, T.R. Belalahy and C. Barat for serving as translators. Thanks to M. Ritter for assistance in analysing historical wild meat price data and to host communities for their hospitality and assistance with the research. This research was completed with administrative assistance from the Madagascar Institute for the Conservation of Tropical Environments. Any opinion, findings and conclusions or recommendations expressed in this material are those of the authors and do not necessarily reflect the views of the National Science Foundation. This material is based upon work supported by the National Science Foundation Graduate Research Fellowship under Grant No. (DGE-1144462) to KER, a National Science Foundation grant (DEB-1257916) to BJS, an Explorers Club Grant to KER and a Temple University Faculty Senate grant to BJS.
ETHICAL STANDARDS
The authors assert that all procedures contributing to this work comply with the ethical standards of the relevant national and institutional committees on human experimentation and with the Helsinki Declaration of 1958, as revised in 2008.
Supplementary material
To view supplementary material for this article, please visit http://dx.doi.org/10.1017/S0376892916000059