



%20--%3e%3c!DOCTYPE%20svg%20PUBLIC%20'-//W3C//DTD%20SVG%201.0//EN'%20'http://www.w3.org/TR/2001/REC-SVG-20010904/DTD/svg10.dtd'%3e%3csvg%20version='1.0'%20id='Layer_1'%20xmlns='http://www.w3.org/2000/svg'%20xmlns:xlink='http://www.w3.org/1999/xlink'%20x='0px'%20y='0px'%20width='64px'%20height='64px'%20viewBox='5.5%20-3.5%2064%2064'%20enable-background='new%205.5%20-3.5%2064%2064'%20xml:space='preserve'%3e%3cg%3e%3ccircle%20fill='%23FFFFFF'%20fill-opacity='0'%20cx='37.785'%20cy='28.501'%20r='28.836'/%3e%3cpath%20fill='%23595959'%20d='M37.441-3.5c8.951,0,16.572,3.125,22.857,9.372c3.008,3.009,5.295,6.448,6.857,10.314%20c1.561,3.867,2.344,7.971,2.344,12.314c0,4.381-0.773,8.486-2.314,12.313c-1.543,3.828-3.82,7.21-6.828,10.143%20c-3.123,3.085-6.666,5.448-10.629,7.086c-3.961,1.638-8.057,2.457-12.285,2.457s-8.276-0.808-12.143-2.429%20c-3.866-1.618-7.333-3.961-10.4-7.027c-3.067-3.066-5.4-6.524-7-10.372S5.5,32.767,5.5,28.5c0-4.229,0.809-8.295,2.428-12.2%20c1.619-3.905,3.972-7.4,7.057-10.486C21.08-0.394,28.565-3.5,37.441-3.5z%20M37.557,2.272c-7.314,0-13.467,2.553-18.458,7.657%20c-2.515,2.553-4.448,5.419-5.8,8.6c-1.354,3.181-2.029,6.505-2.029,9.972c0,3.429,0.675,6.734,2.029,9.913%20c1.353,3.183,3.285,6.021,5.8,8.516c2.514,2.496,5.351,4.399,8.515,5.715c3.161,1.314,6.476,1.971,9.943,1.971%20c3.428,0,6.75-0.665,9.973-1.999c3.219-1.335,6.121-3.257,8.713-5.771c4.99-4.876,7.484-10.99,7.484-18.344%20c0-3.543-0.648-6.895-1.943-10.057c-1.293-3.162-3.18-5.98-5.654-8.458C50.984,4.844,44.795,2.272,37.557,2.272z%20M37.156,23.187%20l-4.287,2.229c-0.458-0.951-1.019-1.619-1.685-2c-0.667-0.38-1.286-0.571-1.858-0.571c-2.856,0-4.286,1.885-4.286,5.657%20c0,1.714,0.362,3.084,1.085,4.113c0.724,1.029,1.791,1.544,3.201,1.544c1.867,0,3.181-0.915,3.944-2.743l3.942,2%20c-0.838,1.563-2,2.791-3.486,3.686c-1.484,0.896-3.123,1.343-4.914,1.343c-2.857,0-5.163-0.875-6.915-2.629%20c-1.752-1.752-2.628-4.19-2.628-7.313c0-3.048,0.886-5.466,2.657-7.257c1.771-1.79,4.009-2.686,6.715-2.686%20C32.604,18.558,35.441,20.101,37.156,23.187z%20M55.613,23.187l-4.229,2.229c-0.457-0.951-1.02-1.619-1.686-2%20c-0.668-0.38-1.307-0.571-1.914-0.571c-2.857,0-4.287,1.885-4.287,5.657c0,1.714,0.363,3.084,1.086,4.113%20c0.723,1.029,1.789,1.544,3.201,1.544c1.865,0,3.18-0.915,3.941-2.743l4,2c-0.875,1.563-2.057,2.791-3.541,3.686%20c-1.486,0.896-3.105,1.343-4.857,1.343c-2.896,0-5.209-0.875-6.941-2.629c-1.736-1.752-2.602-4.19-2.602-7.313%20c0-3.048,0.885-5.466,2.658-7.257c1.77-1.79,4.008-2.686,6.713-2.686C51.117,18.558,53.938,20.101,55.613,23.187z'/%3e%3c/g%3e%3c/svg%3e)
%20--%3e%3c!DOCTYPE%20svg%20PUBLIC%20'-//W3C//DTD%20SVG%201.0//EN'%20'http://www.w3.org/TR/2001/REC-SVG-20010904/DTD/svg10.dtd'%3e%3csvg%20version='1.0'%20id='Layer_1'%20xmlns='http://www.w3.org/2000/svg'%20xmlns:xlink='http://www.w3.org/1999/xlink'%20x='0px'%20y='0px'%20width='64px'%20height='64px'%20viewBox='5.5%20-3.5%2064%2064'%20enable-background='new%205.5%20-3.5%2064%2064'%20xml:space='preserve'%3e%3cg%3e%3ccircle%20fill='%23FFFFFF'%20fill-opacity='0'%20cx='37.637'%20cy='28.806'%20r='28.276'/%3e%3cg%3e%3cpath%20fill='%23595959'%20d='M37.443-3.5c8.988,0,16.57,3.085,22.742,9.257C66.393,11.967,69.5,19.548,69.5,28.5c0,8.991-3.049,16.476-9.145,22.456%20C53.879,57.319,46.242,60.5,37.443,60.5c-8.649,0-16.153-3.144-22.514-9.43C8.644,44.784,5.5,37.262,5.5,28.5%20c0-8.761,3.144-16.342,9.429-22.742C21.101-0.415,28.604-3.5,37.443-3.5z%20M37.557,2.272c-7.276,0-13.428,2.553-18.457,7.657%20c-5.22,5.334-7.829,11.525-7.829,18.572c0,7.086,2.59,13.22,7.77,18.398c5.181,5.182,11.352,7.771,18.514,7.771%20c7.123,0,13.334-2.607,18.629-7.828c5.029-4.838,7.543-10.952,7.543-18.343c0-7.276-2.553-13.465-7.656-18.571%20C50.967,4.824,44.795,2.272,37.557,2.272z%20M46.129,20.557v13.085h-3.656v15.542h-9.944V33.643h-3.656V20.557%20c0-0.572,0.2-1.057,0.599-1.457c0.401-0.399,0.887-0.6,1.457-0.6h13.144c0.533,0,1.01,0.2,1.428,0.6%20C45.918,19.5,46.129,19.986,46.129,20.557z%20M33.042,12.329c0-3.008,1.485-4.514,4.458-4.514s4.457,1.504,4.457,4.514%20c0,2.971-1.486,4.457-4.457,4.457S33.042,15.3,33.042,12.329z'/%3e%3c/g%3e%3c/g%3e%3c/svg%3e)
1. Introduction
The wide range of time and length scales involved in the dynamics shaping the Earth's surface are a challenge for modelling. Rocks at high temperature and under high stress deform by creep and, over long time scales ( ${\geq }10^4$ years), can be approximated as fluids (Kohlstedt, Evans & Mackwell Reference Kohlstedt, Evans and Mackwell1995). This means that fluid mechanical approaches can offer useful insights into the geophysics of plate tectonics (England & McKenzie Reference England and McKenzie1982). Two of the challenges when modelling geophysical systems such as mountain belts and oceanic trenches are that many of the materials forming these structures are inhomogeneous and possess a complex rheology. Nonetheless, if averaged over sufficiently large spatial scales, a simple rheology with few fitting parameters can often give insights into the dynamics (Jaquet, Bauville & Schmalholz Reference Jaquet, Bauville and Schmalholz2014; Ball et al. Reference Ball, Penney, Neufeld and Copley2019).
Many mountain ranges are formed when tectonic plates collide, resulting in the large-scale deformation of rock that produces topographic variations. Shortening creates steep topographic gradients, whereas gravitational forces act to reduce contrasts in elevation, resulting in an evolving system that is governed by the balance of external forcing and gravity. The dynamics of mountain building then depends on how these rocks respond to the applied forces, namely their effective rheology (averaged over the length scales of deformation), and also on the nature of the boundary conditions that the rocks are subject to. Studies by England & McKenzie (Reference England and McKenzie1982) and Perazzo & Gratton (Reference Perazzo and Gratton2010) serve as examples of viscous Newtonian crustal deformation models that incorporate such effects by also making use of a thin-layer approximation.
This paper examines accretionary wedges, which are a type of mountain range that forms in subduction zones. These are convergent margins between tectonic plates where one plate is subducted beneath another. There, sediments are scraped off the subducting oceanic crust by the overlying continental plate and compressed to form a mountain range. These sediments are, in general, poorly consolidated so are much more susceptible to deformation than their surroundings. As a result, in subduction zones oceanic sediments are accreted at the plate boundary (Moore & Silver Reference Moore and Silver1987) and have small-scale folding relative to crustal thickness, while the underlying rocks remain effectively rigid. This is in contrast to the largest mountains like the Himalayas or Andes, where the crust deforms by folding and faulting throughout the entire thickness of the convergent margin (Decelles et al. Reference Decelles, Robinson, Quade, Ojha, Garzione, Copeland and Upreti2001). Examples of accretionary wedges include the Nankai accretionary wedge (Strasser et al. Reference Strasser2009), Barbados Ridge accretionary complex (Westbrook et al. Reference Westbrook, Ladd, Buhl, Bangs and Tiley1988), Kuril and Aleutian wedges (Emerman & Turcotte Reference Emerman and Turcotte1983), Makran accretionary prism and the Indo-Burman range (Ball et al. Reference Ball, Penney, Neufeld and Copley2019). Accretionary wedges can be 20–200 km in length and typically have an elevation of a few km (Westbrook et al. Reference Westbrook, Ladd, Buhl, Bangs and Tiley1988; Ball et al. Reference Ball, Penney, Neufeld and Copley2019; Noda et al. Reference Noda, Koge, Yamada, Miyakawa and Ashi2020). The speed of the colliding plates ranges from a few mm yr $^{-1}$ up to tens of mm yr
 $^{-1}$, meaning that the time scale for the formation of these wedges is of the order of 10 Myr (Strasser et al. Reference Strasser2009; Escalona & Mann Reference Escalona and Mann2011; Ball et al. Reference Ball, Penney, Neufeld and Copley2019).
There are two main types of theoretical models of accretionary wedges. The first type of model tries to capture the brittle behaviour of rocks by using a Mohr–Coulomb rheology (Davis, Suppe & Dahlen Reference Davis, Suppe and Dahlen1983; Dahlen Reference Dahlen1990; Nishiura, Furuichi & Sakaguchi Reference Nishiura, Furuichi and Sakaguchi2021). In these models, the wedge is always at a critical stress, which instantaneously dictates its geometry. The wedge evolution is therefore determined by the temporal variation of the boundary conditions. Wang & Hu (Reference Wang and Hu2006) have attempted to include elasticity in addition to a Mohr–Coulomb rheology, obtaining a dynamic model in which the geometry of the wedge does not only depend on its stress state. The second type of model are viscous, often Newtonian, wedge models (Emerman & Turcotte Reference Emerman and Turcotte1983; Ball et al. Reference Ball, Penney, Neufeld and Copley2019) that are based on the observation that rocks at high pressures exhibit creeping behaviour which may be modelled as a continuum process (Rutter Reference Rutter1983). These models aim to capture the effective accretionary wedge rheology averaged over large length scales, since at these scales any inhomogeneity in deformation due to faulting or variations in composition becomes less relevant. Continuum models determine the wedge shape dynamically by balancing the external forcing and the deformation rate of the material. Viscous wedge models have the advantage of being more amenable to analytical solution, and therefore offer first-order insights into the factors controlling the deformation of such wedges. However, these models do not allow for the material to retain any topography without continued active deformation in the case of commonly used Newtonian or power-law viscous rheologies. Also, at smaller spatial scales, viscous models cannot capture the observed faulting behaviour of rocks as a result of brittle deformation.
Another way to explore the dynamics of accretionary wedges is via analogue experimental models. The majority of these models use granular materials, since they tend to reproduce the short-wavelength fold and fault structures seen in real mountains. There are few similar studies considering purely viscous mountain building, as seen by their scarcity in the extensive review done by Graveleau, Malavieille & Dominguez (Reference Graveleau, Malavieille and Dominguez2012) on analogue mountain building experiments. Buck & Sokoutis (Reference Buck and Sokoutis1994) looked into surface extension that can sometimes happen when two masses of viscous fluid collide, while Rossetti, Faccenna & Ranalli (Reference Rossetti, Faccenna and Ranalli2002) conducted analogue mountain formation experiments with spatially dependent fluid viscosity.
Lithospheric rheology is thought to possess both brittle and ductile features (Burov Reference Burov2011). In this paper, we study a two-dimensional viscoplastic fluid system that serves as a model of an accretionary wedge, where a uniform fluid layer on top of a horizontal base approaches a vertical backstop at a constant speed. The model is inspired by previous Newtonian and power-law models (Emerman & Turcotte Reference Emerman and Turcotte1983; Gratton & Perazzo Reference Gratton and Perazzo2009; Ball et al. Reference Ball, Penney, Neufeld and Copley2019) which aim to capture the effective mountain rheology over long length scales, and to extract the first-order controls on mountain deformation. We generalise this approach by including a yield stress in our description of the effective rock rheology. This does not recover the precise rheology of rocks but results in richer phenomenology that begins to roughly parametrise brittle–ductile transition of the crust, a feature that may be significant to wedge dynamics in the Nankai (Karig Reference Karig1990) and Makran accretionary wedges (Peterson, Barnhart & Li Reference Peterson, Barnhart and Li2018). Although a viscoplastic fluid below the yield stress does not show brittle behaviour because it cannot fault, our aim is to explore a continuum model where a fluid has both solid-like behaviour and depth-dependent viscosity. We also anticipate that a viscoplastic rheology may be able to capture some of the behaviour of the granular models of accretionary wedges (Davis et al. Reference Davis, Suppe and Dahlen1983; Dahlen Reference Dahlen1990; Nishiura et al. Reference Nishiura, Furuichi and Sakaguchi2021).
Our viscoplastic model has similarities to many problems previously studied in fluid mechanics. For example, Balmforth & Craster (Reference Balmforth and Craster1999) showed that a two-dimensional, thin-layer viscoplastic Bingham flow generally has a slowly deforming pseudo-plug region, resolving the problem of self-consistency of the Bingham constitutive relation (Liu & Mei Reference Liu and Mei1990). Chambon, Ghemmour & Laigle (Reference Chambon, Ghemmour and Laigle2009), Chambon, Ghemmour & Naaim (Reference Chambon, Ghemmour and Naaim2014), Freydier, Chambon & Naaim (Reference Freydier, Chambon and Naaim2017) and Liu, Balmforth & Hormozi (Reference Liu, Balmforth and Hormozi2019) studied a modified problem of a slow viscoplastic surge flowing down a slope, while Liu et al. (Reference Liu, Balmforth, Hormozi and Hewitt2016) relaxed the thin-layer assumption by looking at the slumping of viscoplastic columns numerically. A similar model was also considered by Perazzo & Gratton (Reference Perazzo and Gratton2008), who looked at a boundary-driven Newtonian model in the context of ridge and rift formation, and found a few asymptotic power-law behaviours for the fluid shape. Recent work by Lister & Hinton (Reference Lister and Hinton2022) considered scraping of a Newtonian and viscoplastic fluid layer in two and three dimensions, and derived steady-state regimes of the resulting wedge. Thin-film viscoplastic flows are also relevant in industrial applications, such as blade-coating (Maillard et al. Reference Maillard, Mézière, Moucheront, Courrier and Coussot2016), cleaning of soil layers (Glover et al. Reference Glover, Brass, Bhagat, Davidson, Pratt and Wilson2016) and 3-D printing (Jalaal, Stoeber & Balmforth Reference Jalaal, Stoeber and Balmforth2021).
We note that a similar theoretical and experimental study has also been done by Taylor-West & Hogg (Reference Taylor-West and Hogg2024). Their work parallels that described below, and also considers the leakage of a viscoplastic fluid through a gap between the scraping plate and the base. Together with the work by Lister & Hinton (Reference Lister and Hinton2022) this highlights the recent interest in the scraping of viscoplastic fluids in various contexts. This study expands on these previous theoretical and experimental works, and importantly links the problem to the geophysical context, indicating how the model may provide insights to the study of accretionary wedges. In addition, we present a more systematic characterisation of a larger number of experiments. The experiments reported here differ from and complement the work of Taylor-West & Hogg (Reference Taylor-West and Hogg2024) by having a no-slip bottom boundary and a larger tank, thereby achieving conditions closer to those assumed in our theoretical model and which are directly relevant to the geophysical setting. The fluid used in the experiments also has a higher yield stress, and we were able to run experiments with a thicker initial fluid layer, thereby achieving higher Bingham numbers. These experiments contribute to a more complete understanding of the dynamics of the experimental wedge and how it differs from the simple theoretical model.
A thin-film viscoplastic wedge model is described in § 2. In § 3 we detail the full evolution of the wedge, calculated first numerically, and highlight the early- and late-time analytical behaviour in a series of asymptotic regimes in § 4, which have been derived before by Perazzo & Gratton (Reference Perazzo and Gratton2008), Lister & Hinton (Reference Lister and Hinton2022) and Taylor-West & Hogg (Reference Taylor-West and Hogg2024). A model for a Herschel–Bulkley fluid is outlined in § 5, which we test against our experimental observations in § 6. Finally, in § 7 we discuss the results and their application to mountain ranges, and we make some broad concluding remarks in § 8.
2. Model set-up
Accretionary wedges form in subduction zones where the overriding plate scrapes the sediment off the underthrusting plate to produce an increase in surface topography (figure 1a). Since these sediments are, in general, much more easily deformed than the underlying tectonic plate, we approximate the underthrusting plate as rigid. The simplest model geometry for such a system, for example considered by Emerman & Turcotte (Reference Emerman and Turcotte1983) and Ball et al. (Reference Ball, Penney, Neufeld and Copley2019), and which we use here, consists of a horizontal surface with a horizontal layer of weak sediment representing the underthrusting plate and a vertical backstop representing the strong sediment of the overlying tectonic plate.
(a) Schematic cross-section of an accretionary wedge formed at a subduction zone. The continental plate forms an effectively rigid backstop. (b) Model geometry of the formation of an accretionary wedge. The horizontal base and vertical backstop represent the oceanic and continental plates in (a), respectively. Height  $h(x, t)$ denotes the sediment surface position, while
 $Y(x, t)$ is the yield surface height.

We consider a thin layer of an initially static viscoplastic fluid of depth  $h_\infty$ resting on a rough rigid horizontal base fixed at
 $z = 0$. The base moves at a speed
 $U$ in the
 $-\boldsymbol {\hat x}$ direction towards a rigid vertical backstop. Here we fix the horizontal coordinate of the backstop at
 $x = 0$, thereby forcing the fluid to collect into a wedge of thickness
 $h(x, t)$ in the
 $x > 0$,
 $z > 0$ quarter-plane (figure 1b). The flow is assumed to be two-dimensional, have no slip at the base and a free surface at the top. Similar thin-layer viscoplastic flow models are discussed in detail by Liu & Mei (Reference Liu and Mei1990), Balmforth & Craster (Reference Balmforth and Craster1999), Balmforth et al. (Reference Balmforth, Craster, Rust and Sassi2006) and Taylor-West & Hogg (Reference Taylor-West and Hogg2024).
The flow of rocks on Earth is well approximated by Stokes flow since inertia is negligible. For most scenarios, the horizontal extent of typical accretionary wedges is hundreds of kilometres while the height is only a few kilometres (Ruh Reference Ruh2020), so that we may describe the flow using the lubrication approximation. Hence, the vertical force balance is hydrostatic and it is the horizontal gradient in the pressure that balances the vertical gradient of shear stress.
To model the deformation of accretionary wedges we must also consider the effective rheology of the sediments which are being deformed. Here, we assume a Bingham constitutive relation, which is the simplest rheology that crudely incorporates both the solid and ductile behaviour of rocks. The constitutive law for a Bingham fluid of yield stress  $\tau _y$ and plastic viscosity
 $\mu$ in the lubrication limit takes the form
 \begin{equation} \mu \frac{\partial u}{\partial z} = \left\{ \begin{array}{@{}ll@{}} 0, & \left| \tau_{xz} \right| \le \tau_y, \\ \tau_{xz} - \text{sgn} \left (\tau_{xz} \right) \tau_y, & \left| \tau_{xz} \right| > \tau_y. \end{array} \right. \end{equation}
Here  $u(x, z, t)$ is the horizontal fluid velocity in the frame of the backstop. If the shear stress
 $\tau _{xz}$ exceeds the yield stress, the fluid flows with constant plastic viscosity
 $\mu$. It is worth noting that in general the plastic viscosity may depend on the shear rate, but for simplicity of the following analysis, we treat it as constant. If the applied shear stress is below the yield stress, the material behaves as a solid plug. However, a detailed analysis of the constitutive relation (2.1) by Balmforth & Craster (Reference Balmforth and Craster1999) showed that in almost all similar contexts a true static plug does not form. Instead, there are regions present in the fluid that deform much more slowly than the surrounding fluid but which have significant diagonal deviatoric stress components. These regions are called pseudo-plugs and, to leading order, they can be considered to be solid and unyielded. Here we will examine the leading-order deformation of the wedge, leaving an investigation of the detailed dynamics of deformation in the pseudo-plug to future studies. In the lubrication approximation, the shear stress is found to increase with depth, meaning that the fluid wedge is composed of a pseudo-plug top layer on top of a viscously deforming layer. We therefore define a yield surface to be at the base of the pseudo-plug at a height
 $z = Y(x, t)$.
Given the model description above, it can be summarised by the following set of equations (Lister & Hinton Reference Lister and Hinton2022; Taylor-West & Hogg Reference Taylor-West and Hogg2024):
 \begin{equation} h_t = \left[ U h + \frac{\rho g Y^2 ( 3 h - Y )}{6 \mu} h_x \right]_{x},\end{equation}
where
 \begin{gather} Y = \max \left( 0, h - \frac{\tau_y}{\rho g \left| h_x \right|} \right), \end{gather}
 $$\begin{gather} q ={-} U h - \frac{\rho g Y^2 ( 3 h - Y )}{6 \mu} h_x = 0, \quad \text{at}\ x = 0, \end{gather}$$
 $$\begin{gather}h = h_\infty, \quad \text{as}\ x \rightarrow \infty, \end{gather}$$
 $$\begin{gather}h = h_\infty, \quad \text{at} \ t = 0, \end{gather}$$
where from now on subscripts  $x$ and
 $t$ denote partial differentiation with respect to space and time, respectively,
 $\rho$ is the fluid density,
 $g$ is the gravitational acceleration and
 $q$ is the vertically integrated fluid flux. Equation (2.2a) expresses the conservation of the fluid mass, with the flux composed of the advective term
 $U h$ and a diffusive-like term associated with the shear deformation. The yield stress rheology is described by (2.2b) in which the maximum function accounts for the case in which the entire fluid thickness is unyielded, as is the case before the onset of deformation. We also impose zero flux through the backstop, (2.3a), so that all the fluid remains in the region
 $x > 0$. This, together with the no-slip condition at the base implies the existence of a boundary layer in the vicinity of
 $x = 0$, where the vertical and horizontal velocities are comparable and hence the lubrication approximation is no longer applicable. However, the no-flux condition (2.3a) may still be imposed as a constraint on local mass conservation. In the far field we assume that the sediment remains undeformed and that it is initially of uniform depth, as expressed by conditions (2.3b) and (2.3c).
We first determine a few general properties of the model solutions. From (2.2) we have that when  $h_x = 0$, then
 $h_t = 0$ also. That is, a finite region of yield-stress fluid with initially horizontal surface can only start deforming at its edges, because there is an insufficient horizontal pressure gradient (and hence shear stress) in the interior to cause the fluid to yield. As a result, the information about the presence of the backstop must propagate at a finite speed, implying that at large enough distance
 $x$ the fluid surface remains horizontal. It is therefore useful to define a wedge nose position
 $x_n (t)$ that is the smallest horizontal coordinate value which satisfies
 $h(x, t) = 1 \ \forall \, x \geq x_n (t)$. Then, by integrating the evolution equation (2.2a) from
 $x = 0$ to
 $x \rightarrow \infty$, and applying the boundary conditions (2.3), we get that
 \begin{equation} \frac{\mathrm{d}}{\mathrm{d} t} \int_0^{x_n (t)} [h(x, t) - h_\infty] \,\mathrm{d}\kern0.06em x = \frac{\mathrm{d} V}{\mathrm{d} t} = U h_\infty, \end{equation}
following Taylor-West & Hogg (Reference Taylor-West and Hogg2024), where  $V$ is the total wedge volume, neglecting fluid below
 $h = h_\infty$. Equation (2.4) is an expression of global conservation of mass, which states that the wedge mass growth is equal to the fluid influx
 $U h_\infty$. Since
 $h(x_n, t) = h_\infty$, (2.4) can be simplified to
 \begin{equation} \int_0^{x_n (t)} h_t\, \mathrm{d}\kern0.06em x = U h_\infty. \end{equation}
The most interesting case of the model system is where all the deformation of the fluid happens in a wedge that lies between the backstop at  $x = 0$ and the nose at
 $x = x_n(t)$, while the fluid surface for
 $x > x_n(t)$ is horizontal and static. If the initial state of the system is a small downsloping (
 $h_x < 0$) wedge for
 $0 \leq x < x_n$, it can be shown (see Appendix A) that the evolving wedge remains downsloping, with the flow confined to
 $x \leq x_n$ and with a horizontal fluid surface for
 $x > x_n$. We also see this behaviour in the numerical solutions presented in § 3. Therefore, in what follows, we only consider solutions that have the form
 \begin{equation} \left. \begin{array}{@{}ll@{}} Y(x, t) > 0,\ h_x(x, t) < 0, & \text{at } 0 \leq x < x_n(t), \\ Y(x, t) = 0,\ h(x, t) = h_\infty, & \text{at } x \geq x_n(t). \end{array} \right\} \end{equation}
It can be shown (see Appendix A) from continuity of  $h(x, t)$ and
 $q(x, t)$ that the yield surface
 $Y(x, t)$ must also be continuous. As a result, at the wedge nose
 $x_n$ where the yield surface goes from being positive to being zero, (2.2b) implies that the fluid surface slope must jump from
 $|h_x| = \tau _y / \rho g h_\infty$ to
 $h_x = 0$. Hence (Taylor-West & Hogg Reference Taylor-West and Hogg2024),
 \begin{equation} \left. h_x \right|_{x^-_n} ={-}\frac{\tau_y}{\rho g h_\infty}, \end{equation}
where the minus superscript expresses the limit from below. Conditions (2.5) and (2.7) are two alternative ways to fix the new unknown  $x_n$.
2.1. Non-dimensionalisation
We make the model described above non-dimensional by introducing dimensionless variables (denoted by the tilde diacritic):
 \begin{equation} h = h_\infty \tilde h, \quad x = \frac{\rho g h_\infty^3}{3 \mu U} \tilde x, \quad t = \frac{\rho g h_\infty^3}{3 \mu U^2} \tilde t, \end{equation}
in a manner similar to Perazzo & Gratton (Reference Perazzo and Gratton2008), Lister & Hinton (Reference Lister and Hinton2022) and Taylor-West & Hogg (Reference Taylor-West and Hogg2024). The fluid depth is scaled by the far-field thickness, while the other characteristic scales may be found by balancing the advective flux and the flux associated with gravitational slumping. The time scale is then given by the rate of advection over the horizontal length scale. With this rescaling the governing equations (2.2) may be rewritten as
 \begin{equation} \tilde h_{\tilde t} ={-} {\tilde q}_{\tilde x} = \left[ \tilde h + \frac{\tilde Y^2 ( 3 \tilde h - \tilde Y )}{2} \tilde h_{\tilde x} \right]_{\tilde x}, \end{equation}
where
 \begin{equation} \tilde Y = \max \left( 0, \tilde h + \frac{Bi}{\tilde h_{\tilde x}} \right). \end{equation}
Here, we have written  $| \tilde h_{\tilde x} | = - \tilde h_{\tilde x}$ since all the solutions considered here will have
 $\tilde h_{\tilde x} \leq 0$. The evolution of the accretionary wedge is now determined solely by a Bingham number
 \begin{equation} Bi \equiv \frac{\tau_y h_\infty}{3 \mu U}, \end{equation}
which is the ratio of the yield stress to the characteristic viscous shear stress in the system. We also rewrite the boundary, initial and integral conditions, (2.3), (2.5) and (2.7), as
 $$\begin{gather} \tilde q ={-} \tilde h - \frac{\tilde Y^2 ( 3 \tilde h - \tilde Y )}{2} \tilde h_{\tilde x} = 0, \quad \text{at} \ \tilde x = 0, \end{gather}$$
 $$\begin{gather}\tilde h = 1, \quad \text{at} \ \tilde x = \tilde x_n(\tilde t), \end{gather}$$
 $$\begin{gather}\tilde h_{\tilde x} ={-}Bi, \quad \text{at} \ \tilde x = \tilde x_n(\tilde t), \end{gather}$$
 $$\begin{gather}\tilde h \rightarrow 1, \quad \text{as}\ \tilde t \rightarrow 0. \end{gather}$$
An additional global mass conservation condition can be derived from (2.11):
 \begin{equation} \int_0^{\tilde x_n} \tilde h_{\tilde t} \,\mathrm{d} \tilde x = 1. \end{equation}
From considerations described earlier in this section, we change the boundary condition as  $x \rightarrow \infty$ to one at
 $x = \tilde x_n(\tilde t)$, with condition (2.11c) serving to fix the new variable
 $x_n$. The model equations above are not self-consistent if one sets the initial condition
 $\tilde h = 1$ at
 $\tilde t = 0$, since then the whole system is initially unyielded, and the no-flux condition (2.11a) is not satisfied. Thus, we instead modify the original initial condition by initialising the system at some small time
 $0 < \tilde t \ll 1$ and a corresponding small yielding downsloping wedge satisfying
 $\tilde h - 1 \ll 1$,
 $\tilde h_{\tilde x} \leq -Bi$ at
 $0 \leq \tilde x < \tilde x_n$. In §§ 3, 4, 5.2 and 5.3 we drop the diacritical marks from dimensionless variables for simplicity of notation.
3. Numerical study
3.1. Numerical methods
Equations (2.9) and (2.11) are solved using a Crank–Nicolson finite difference scheme with a non-uniform grid spacing and adaptive time stepping, using an approach similar to that of Ball et al. (Reference Ball, Penney, Neufeld and Copley2019). The fluid flux, which has both advective and diffusive terms, is discretised using the Il'in method (Il'in Reference Il'in1969; Clauser & Kiesner Reference Clauser and Kiesner1987). The fluid height  $h$ is evaluated at the centres of the grid bins, while the flux
 $q$ is computed at the bin boundaries. The fluid height can then be evolved by using a discrete version of the mass conservation equation
 $h_t + q_x = 0$. We start time integration from a small parabolic wedge of length
 $x_n$ that satisfies the boundary conditions (2.11a)–(2.11c). The domain of computation spans a region longer than
 $x_n$ and uses the boundary condition
 $h = 1$ at the far end instead of (2.11b) and (2.11c). As the fluid wedge grows, we extend the spatial domain by stretching the mesh and remapping to the new mesh points using linear interpolation. In order to treat the regions with
 $Y > 0$ and
 $Y = 0$ in the same manner and make the numerical scheme more well-behaved, we regularise the yield surface height equation (5.2b) using the approximation
 \begin{equation} Y = \frac{1}{2} \left[ \left( h - \frac{Bi}{|h_x|} + \epsilon_1 \right) + \left( h - \frac{Bi}{|h_x|} - \epsilon_1 \right) \tanh\left( \frac{1}{\epsilon_2} \left\{ h - \frac{Bi}{|h_x|} \right\} \right) \right], \end{equation}
where  $\epsilon _1,\ \epsilon _2 \ll 1$. The case
 $Y = 0$ in (5.2b) is replaced by a small non-zero yield surface height
 $\epsilon _1$ (Jalaal et al. Reference Jalaal, Stoeber and Balmforth2021), while the tanh function regularises the sharp transition between the cases
 $h - Bi / | h_x | > 0$ and
 $h - Bi / | h_x | < 0$. Here we use
 $\epsilon _1 = \epsilon _2 = 0.001$ after checking that reducing these values has negligible impact on the numerical results. We observed that the results converge as the spatial and temporal steps are reduced and ensured they are small enough for the numerical scheme to be stable.
3.2. Numerical results
The evolution of the computed fluid topography for  $Bi = 1$ is shown in figure 2. The solution has a well-defined nose position at which fluid surface transitions almost discontinuously (given the regularisation (3.1)) from sloping to horizontal with height
 $h = 1$ according to (2.11c). The initial horizontal fluid surface remains undisturbed until the nose of the wedge passes the location. We also see that close to the nose the yield surface becomes nearly vertical.
Bingham fluid surface height  $h$ (black) and yield surface height
 $Y$ (blue) at
 $t = 0.021, 0.23, 1.5, 10$ for
 $Bi = 1$. Darker lines correspond to later times.

In figure 3 we present the evolution of the wedge thickness, length and yield surface height for a range of Bingham numbers. We observe a power-law behaviour in all these quantities at early and late times, suggesting asymptotically self-similar evolution as  $t \rightarrow 0\text { and } t \rightarrow \infty$. There is some non-power-law evolution during the very first few time steps (omitted in figure 3), which quickly transitions to power-law behaviour. We derive the corresponding power-law scaling exponents in § 4, where we also show that for low
 $Bi$ there is an approximate self-similar behaviour at intermediate time values. These theoretically predicted exponents are shown in figure 3 and accurately match the numerical results.
(a) Evolution of the wedge height (black and grey solid lines) and the yield surface height (blue dashed lines) at the backstop for a Bingham fluid at various  $Bi$ values. (b) Evolution of the change in wedge height at the backstop (black and grey solid lines) and the wedge length (red dashed lines) for a Bingham fluid at various
 $Bi$ values. In both panels, the triangles show analytically predicted asymptotic power-law dependence with the following exponents (derived in § 4):
 $1/2$ for the early-time regime,
 $1/4$ and
 $3/4$ for the late-time regime and
 $1/3$,
 $2/3$ and
 $1/6$ for the very-late-time regime.

Individual fluid surface profiles in figure 4 show a distinct difference in evolution at low and high Bingham numbers. At low  $Bi$ the yield surface remains close to the fluid surface for a long time. For example, in the case of
 $Bi = 0.0032$, this is seen at least until
 $t = 11\,000$ (figure 4a,b), meaning that the flow is quasi-Newtonian with a thin pseudo-plug layer at the top. Only after the wedge has grown much larger than
 $h_\infty$ does the yield surface start to grow at a slower rate than the fluid surface (figure 4c) until the yield surface height becomes a small fraction of
 $h$. This results in a predominantly unyielded, quasi-static wedge. On the other hand, the flow at high Bingham numbers (figure 4d,e) is always quasi-static, as the yielded layer is much thinner than the total fluid thickness. In what follows, we use terms early time and late time to respectively denote the regimes where the maximum fluid thickness increase
 $h_0-1$ is much less and much greater than 1, where
 $h_0$ is the fluid thickness at the backstop. In figure 4(b,c) we see two late-time regimes that occur one after another, distinguished by a significant or negligible yield surface height. We call the latter regime the very-late-time regime.
Examples of numerically obtained states that are close to asymptotic solutions for  $n = 1$. Dashed lines show self-similar asymptotic predictions outlined in § 4. (a)
 $Bi = 0.0032$,
 $t = 0.014$, corresponding to the early-time quasi-Newtonian regime. The asymptotic prediction for fluid surface is obtained by solving (4.2), which is used in conjunction to (2.9b) to obtain the yield surface. (b)
 $Bi = 0.0032$,
 $t = 11\,000$, corresponding to the late-time quasi-Newtonian regime. (c)
 $Bi = 0.0032$,
 $t = 7.2 \times 10^{11}$, corresponding to the very-late-time quasi-static regime. (d)
 $Bi = 40$,
 $t = 9.0 \times 10^{-5}$, corresponding to the early-time quasi-static regime. The asymptotic predictions are obtained in the same way as for (a). (e)
 $Bi = 40$,
 $t = 10$, corresponding to the very-late-time quasi-static regime.

We gain more insight into the self-similar regimes by plotting the numerically fitted power-law exponent,  $\alpha$, of
 $h_0 - 1\sim t^\alpha$ as a function of time and the Bingham number (figure 5a). The exponent is obtained by finding a gradient of
 $\log (h_0(t) - 1)$ with respect to
 $\log (t)$ in a narrow time window. The width of this window is kept fixed in
 $\log (t)$ space as the mean time value is changed. From the description in the last paragraph, the behaviour of the wedge height at the backstop
 $h_0$ distinguishes the late-time regime from the early-time one. Similarly, the fraction of the wedge thickness taken up by the yielded layer at the backstop
 $Y_0 / h_0$ is a good descriptor of how quasi-static or quasi-Newtonian the wedge is. Hence, we can use the isolines of
 $h_0$ and
 $Y_0/h_0$ (respectively black and red solid lines in figure 5a) to demarcate the boundaries between different regimes. Indeed, we see that the power exponent
 $\alpha$ tends to change its value close to these lines, indicating a change in self-similar behaviour, while far from the lines the exponent stays the same, meaning that the system is asymptotically close to one of the self-similar states. We also note that at sufficiently late times the system always reaches the quasi-static regime. With increasing
 $Bi$, this very-late-time quasi-static regime is reached at earlier times, until for
 $Bi \gtrsim 1$, the quasi-Newtonian regime is not observed at all. The dashed lines show approximate analytical regime boundaries that are derived in § 4. They match the numerically obtained boundaries very well, given the fact that the transitions between the asymptotic regimes are smooth and occur over a large interval of
 $Bi$ and
 $t$ values.
(a) Regime diagram of the model solutions for  $n = 1$, showing how the power scaling exponent,
 $\alpha$, of
 $h_0 - 1 \sim t^\alpha$, depends on
 $Bi$ and time. Dashed lines (black, separating the early and late regimes; red, separating quasi-static and quasi-Newtonian regimes) denote analytically predicted boundaries between the regimes, while the solid lines mark the numerically obtained boundaries. Markers correspond to computed states shown in figure 4. White areas are difficult to access numerically and so we were able to do only a limited number of computations there. (b) Analytically obtained regime diagram showing where different self-similar regimes are expected to hold for the Bingham fluid (
 $n = 1$).

4. Early- and late-time asymptotic regimes
The numerical solutions described in § 3 exhibit three distinct regimes of  $Bi$-dependent asymptotically self-similar behaviour at early, late and very late times. Here, we summarise the results found by Lister & Hinton (Reference Lister and Hinton2022) and Taylor-West & Hogg (Reference Taylor-West and Hogg2024) (listed in table 1) in the context of the numerical results described in § 3. Figure 5(b) shows a summary of the analytical predictions of where the different regimes can be found. For example, the late quasi-Newtonian regime is expected to be found at times
 $t \gg 1$ and
 $t \ll Bi^{-4}$.
Summary of the asymptotic regimes. The late quasi-static wedge has been considered before in various contexts by Liu & Mei (Reference Liu and Mei1990), Balmforth, Craster & Sassi (Reference Balmforth, Craster and Sassi2002), Lister & Hinton (Reference Lister and Hinton2022) and Taylor-West & Hogg (Reference Taylor-West and Hogg2024). Lister & Hinton (Reference Lister and Hinton2022) also derived the late quasi-Newtonian regime by considering scraping of a Newtonian fluid, while Taylor-West & Hogg (Reference Taylor-West and Hogg2024) obtained the late quasi-Newtonian and both early regimes.

The early-time wedge is characterised by a fluid surface that is still close to the initial state,  $h - 1 \ll 1$. Under this approximation, the system can be shown to evolve in a self-similar fashion with a square-root growth with time (see Appendix B):
 $$\begin{gather} h \simeq 1 + t^{1/2} f(\eta), \end{gather}$$
 $$\begin{gather}\eta = t^{{-}1/2} x, \end{gather}$$
 $$\begin{gather}x_n \simeq t^{1/2} \eta_n, \end{gather}$$
where the wedge shape  $f(\eta )$ is determined by solving
 $$\begin{gather} \frac{1}{2} (f - \eta f') ={-} \left[ - f' + \frac{Bi^3}{2 f'^2} \right]', \end{gather}$$
 $$\begin{gather}- 1 - f' - \frac{3 Bi}{2} + \frac{Bi^3}{2 f'^2} = 0, \quad \text{at} \ \eta = 0, \end{gather}$$
 $$\begin{gather}f = 0, \quad \text{at} \ \eta = \eta_n(t), \end{gather}$$
 $$\begin{gather}f' ={-}Bi, \quad \text{at}\ \eta = \eta_n(t), \end{gather}$$
 $$\begin{gather}f \rightarrow 0, \quad \text{as}\ t \rightarrow 0. \end{gather}$$
A similar but slightly less approximate set of early-time equations was also found by Taylor-West & Hogg (Reference Taylor-West and Hogg2024). We solve (4.2) to obtain the self-similar predictions in figure 4(a,d).
For low Bingham number, we expect that the yield surface nearly coincides with the fluid surface, giving the balance from (2.9b):
 \begin{equation} h \simeq Y \gg \frac{Bi}{ \left| h_x \right|}, \end{equation}
and leading to the result in row 1 of table 1:
 \begin{equation} h(x, t) = 1 + \left[ \left( \operatorname{erf} \left\{ \frac{x}{2 t^{1/2}} \right\} - 1 \right) \frac{x}{t^{1/2}} + \frac{2}{\sqrt {\rm \pi}} {\rm e}^{- x^2 / (4 t)} \right] t^{1/2}. \end{equation}
This fluid surface shape was obtained by Perazzo & Gratton (Reference Perazzo and Gratton2008) as an early-time asymptotic solution in their study of a Newtonian ridge model. A purely Newtonian wedge would extend (with infinitesimal amplitude) towards infinity. However, far from the origin where the slope is small, the yield surface height reaches zero. Thus, the exact low- $Bi$ solution has compact support, and we can estimate the nose position by the position where the
 $Bi = 0$ solution (4.4) satisfies the nose boundary condition (2.11c). For large
 $x_n$ we find that
 \begin{equation} x_n \simeq 2 \left[ t \ln \left( {\frac{2}{\sqrt{\rm \pi} Bi}} \right) \right]^{1/2}. \end{equation}
In the early-time, high- $Bi$ limit, we expect that the yield surface is low (
 $Y \ll h$), so that the yield surface equation (5.2b) may be approximated as
 \begin{equation} 0 \simeq 1 + \frac{Bi}{h_x}, \end{equation}
from which the linear, early-time, large- $Bi$ solution stated in row 2 of table 1 may be derived. The results of the computations shown in figure 4(d) are consistent with this result. That is, a quasi-static wedge forms which grows slowly due to the incoming mass. There is a thin yielded layer of thickness
 $Y \ll h$ that allows for this growth to happen. The constant slope
 $h_x \simeq -Bi$ in this solution resembles the critical taper theory models that use a Mohr–Coulomb rheology (Davis et al. Reference Davis, Suppe and Dahlen1983; Dahlen Reference Dahlen1990), where instead the role of the coefficient of friction is played here by the Bingham number.
We now look into the case of a thick ( $h |_{x=0} \gg 1$) wedge for which the yield surface nearly coincides with the fluid surface:
 \begin{equation} h \simeq Y \gg \frac{Bi}{ \left| h_x \right|}. \end{equation}
An asymptotic solution in this limit is given in row 3 of table 1. We see such quasi-Newtonian behaviour in the numerically computed state shown in figure 4(b), where almost all of the fluid column is yielded and behaves like a Newtonian fluid covered by a thin pseudo-plug crust. This regime is analogous to the Newtonian wedge model studied by (Emerman & Turcotte Reference Emerman and Turcotte1983), which is unsurprising given that the pseudo-plug contribution to the flux and its effect on the underlying yielded wedge have been neglected. Note that the time derivative term in the evolution equation (2.9a) is negligible compared with the two flux divergence terms, resulting in a growth where the wedge shape and size are purely determined by its total mass.
In a similar manner to the early quasi-Newtonian regime, this is an almost fully yielded wedge with a thin pseudo-plug crust at the top. The crust is itself slowly deforming as it is not a perfect plug, though this does not affect the leading-order shape of the fluid surface. The addition of plasticity, as seen in figure 5(b), constrains this regime to be present for time values bound from above as well as below, in contrast to the purely Newtonian model by Emerman & Turcotte (Reference Emerman and Turcotte1983), in which this regime extends indefinitely. Also, the time bounds of this regime in our model suggest that the late-time quasi-Newtonian regime appears only when the Bingham number is low, as seen in § 3.
Finally, we consider a regime where the wedge has grown to be much thicker than the initial layer, and for which equation (5.2b) has the dominant balance:
 \begin{equation} h \simeq \frac{Bi}{ \left| h_x \right|} \gg Y. \end{equation}
In other words, the whole wedge is unyielded to leading order. This leads to a self-similar solution stated in the last row of table 1. A numerically computed state close to this regime is shown in figure 4(c,e). This is a mostly unyielded wedge with a thin yielded region at the base similar to the early quasi-static regime.
A similar square-root shape as in the last row of table 1 was first obtained in a purely plastic ice sheet model by Nye (Reference Nye1951). The same shape is also taken up by a heap of slumping Bingham fluid at late times (Liu & Mei Reference Liu and Mei1990). A similar plastic limit for a viscoplastic slump on a slope was considered by Balmforth et al. (Reference Balmforth, Craster and Sassi2002), while Lister & Hinton (Reference Lister and Hinton2022) and Taylor-West & Hogg (Reference Taylor-West and Hogg2024) found this solution as a steady-state regime for high  $Bi$ when there is a narrow gap between the base and the backstop. Maillard et al. (Reference Maillard, Mézière, Moucheront, Courrier and Coussot2016) also considered a quasi-static assumption to derive
 $h_0^2 \propto x_n$, which they observed in their gel scraping experiments. We note that in our model without the gap, this regime is reached in the late-time limit regardless of the Bingham number. For low
 $Bi$ values the late-time quasi-Newtonian regime discussed is also observed. Thus, the quasi-Newtonian regime precedes the quasi-static regime.
The conditions under which all the asymptotic regimes are observed were derived by Taylor-West & Hogg (Reference Taylor-West and Hogg2024) and are summarised in figure 5(b). The numerically obtained regime diagram in figure 5(a) closely matches these analytical predictions.
5. Herschel–Bulkley model
5.1. Herschel–Bulkley fluid model
The model of the Bingham fluid wedge can be generalised by instead considering a Herschel–Bulkley constitutive relation (Frigaard Reference Frigaard2019). This incorporates shear-thinning behaviour which is more applicable to strain localisation in tectonic environments. The dimensional constitutive relation expressed in the lubrication approximation limit is therefore of the form
 \begin{equation} \frac{\partial u}{\partial z} = \left\{ \begin{array}{@{}ll@{}} 0, & \left| \tau_{xz} \right| \le \tau_y, \\ K^{{-}1/n} \text{sgn} (\tau_{xz}) ( |\tau_{xz}| - \tau_y )^{1/n} , & \left| \tau_{xz} \right| > \tau_y. \end{array} \right. \end{equation}
Here  $K$ is the consistency, which determines the magnitude of deformation given the shear stress, and
 $n$ is the power-law index which describes the extent to which the fluid is shear thinning. In this study we assume that
 $n \in (0,1]$. For
 $n = 1$ the Herschel–Bulkley relationship recovers the Bingham relationship with
 $K = \mu$. Conversely, as
 $n \rightarrow 0$, the fluid becomes more shear thinning, with the
 $n \rightarrow 0$ case corresponding to a perfectly plastic material.
The flux associated with the shear of a Herschel–Bulkley fluid was derived by Balmforth et al. (Reference Balmforth, Craster, Rust and Sassi2006), while Taylor-West (Reference Taylor-West2023) derived a set of non-dimensional governing equations for the Herschel–Bulkley fluid that are analogous to (2.9) and (2.11) and describe the evolution of the wedge height and the yield surface. In the notation used here, the Herschel–Bulkley wedge is determined by
 $$\begin{gather} \tilde h_{\tilde t} ={-} \tilde q_{\tilde x} = \left[ \tilde h + Bi^{1/n-1} \frac{\tilde Y^{1/n+1} ( (2n+1) \tilde h - n \tilde Y )}{(n+1) ( \tilde h - \tilde Y )^{1/n-1}} \tilde h_{\tilde x} \right]_{\tilde x}, \end{gather}$$
 $$\begin{gather}\tilde Y = \max \left( 0, \tilde h - \frac{Bi}{ \left| \tilde h_{\tilde x} \right|} \right). \end{gather}$$
The flux condition at the origin, the nose conditions and the initial condition are respectively described by
 $$\begin{gather} \tilde q ={-} \tilde h - Bi^{1/n-1} \frac{\tilde Y^{1/n+1} ( (2n+1) \tilde h - n \tilde Y )}{(n+1) ( \tilde h - \tilde Y )^{1/n-1}} \tilde h_{\tilde x} = 0, \quad \text{at} \ \tilde x = 0, \end{gather}$$
 $$\begin{gather}\tilde h = 1, \quad \text{at} \ \tilde x = \tilde x_n, \end{gather}$$
 $$\begin{gather}\tilde h_{\tilde x} ={-}Bi, \quad \text{at} \ \tilde x = \tilde x_n, \end{gather}$$
 $$\begin{gather}\tilde h \rightarrow 1, \quad \text{as}\ \tilde t \rightarrow 0. \end{gather}$$
The statement of conservation of global mass can be derived from (5.3), and may be written as
 \begin{equation} \int_0^{\tilde x_n} \tilde h_{\tilde t} \,\mathrm{d} \tilde x = 1. \end{equation}
Here
 \begin{equation} Bi \equiv \left[ \frac{n h_\infty}{(2 n + 1) U} \right]^n \frac{\tau_y}{K} \end{equation}
is the equivalent Bingham number for a Herschel–Bulkley fluid. The corresponding non-dimensionalisation scales are equivalently
 \begin{equation} h = h_\infty \tilde h, \quad x = \left[ \frac{n}{(2 n + 1) U} \right]^n \frac{\rho g h_\infty^{n+2}}{K} \tilde x, \quad t = \left[ \frac{n}{(2 n + 1) U} \right]^n \frac{\rho g h_\infty^{n+2}}{K U} \tilde t. \end{equation}
5.2. Asymptotic regimes
A study of self-similar regimes can similarly be undertaken for the Herschel–Bulkley fluid model described by (5.2) and (5.3). This results in the change of some of the power-law exponents and prefactors, but the nature of the regimes and their qualitative position in the  $Bi$–
 $t$ space remain unchanged. Hence, below we only state the key results for the Herschel–Bulkley rheology that differ from the Bingham model. The behaviour corresponding to the quasi-Newtonian regime in the case of
 $n = 1$ is called the quasi-power-law regime in the case of
 $n < 1$.
The early-time power-law dependence for height and length remain  $h - 1 \sim t^{1/2}$ and
 $x_n \sim t^{1/2}$. However, the early quasi-power-law wedge takes a different shape than for
 $n = 1$. On the other hand, the shape of the early quasi-static wedge is unaffected by varying power law index
 $n$ and stays linear, since it is determined by the quasi-static condition
 $Y \simeq 0$ that remains the same for the Herschel–Bulkley fluid. The yield surface height in this regime generalises to
 \begin{equation} Y(x, t) = \left[ \left( \frac{1 + n}{1 + 2n} \right)^n \left( 2 Bi^{{-}1} (x_n - x) \right)^{1/2} \right]^{1/(1 + n)}, \end{equation}
assuming  $Y \ll n$.
The shape of the fluid surface in the late-time quasi-Newtonian regime is governed by the balance of advective and diffusive fluxes, so that in the case of general Herschel–Bulkley rheology the corresponding quasi-power-law solution is different from that for  $n = 1$:
 $$\begin{gather} h(x, t) = [(2+n) (x_n - x)]^{1/(2+n)}, \end{gather}$$
 $$\begin{gather}x_n = \frac{\left[ (3 + n) t \right]^{(2+n)/(3+n)}}{2 + n}. \end{gather}$$
Gratton & Perazzo (Reference Gratton and Perazzo2009) studied a similar model a using power-law viscous rheology and obtained solutions that match (5.8) for the quasi-power-law regimes of our model.
The late quasi-static regime, in a manner similar to the early quasi-static regime, exhibits only a yield surface shape that is different for the Herschel–Bulkley rheology:
 \begin{equation} Y = \left[ \left( \frac{n+1}{2n+1} \right)^n Bi^{{-}1/(2 n)} (2 (x_n - x))^{1/2} \right]^{1/(1+n)}. \end{equation}
In terms of the regime location in the  $Bi$–
 $t$ space (figure 5b), only the boundary between the late quasi-power-law and the late quasi-static regime shifts from
 $t \sim Bi^{-4}$ to
 ${t \sim Bi^{-(1 + 3/n)}}$. In other words, for this specific non-dimensionalisation, a shear-thinning wedge spends more time being quasi-power-law before becoming quasi-static.
5.3. Numerical results
Figure 6 compares the numerically computed state of the system for Bingham ( $n = 1$) and shear-thinning Herschel–Bulkley (
 $n = 0.386$) rheologies. Since the rheological power exponent affects the fluid velocity and thus the flux for a given wedge geometry, the yield surface shape is seen to be different for different
 $n$ values. In the case where the fluid flow is quasi-static (figure 6d,e), the shape of the fluid surface is governed by the yielding surface in (5.2b) being close to the base, which does not depend on
 $n$. As a result, figure 6(c–e) shows surface shapes insensitive to
 $n$. On the other hand, when most of the fluid layer is yielded, the wedge topography depends heavily on
 $n$, as discussed earlier in this subsection. In figure 6(a) we observe that for low
 $Bi$ the shear-thinning wedge is shorter and has a much steeper yield surface than the Bingham wedge. This difference in wedge aspect ratio carries on into the late quasi-power-law regime (figure 6b), with the shear-thinning wedge being shorter, which is a consequence of the
 $x_n (t)$ time power exponent in (5.8a) being lower for lower
 $n$ in (5.8b). The last important difference in the system with the shear-thinning rheology is that for low
 $Bi$ it reaches the very-late-time regime at much later times than the system with
 $n = 1$. This is clearly seen in figure 6(c), where the Bingham wedge is already close to the very-late-time quasi-static regime, while the shear-thinning wedge is still quasi-power-law, with little separation between the yield surface and the fluid surface. Indeed, for
 $n = 0.386$ and
 $Bi = 0.0032$, we would expect for the transition time to be
 ${\sim }Bi^{-(1 + 3/n)} \sim 10^{22}$, which we cannot readily access numerically.
Fluid surfaces (in black) and yield surfaces (in blue) compared for  $n = 1$ (solid lines) and
 $n = 0.386$ (dashed lines): (a–c)
 $Bi = 0.0032$ and times
 $0.22, 2.6 \times 10^4 \text { and } 6.3 \times 10^{9}$, respectively; (d,e)
 $Bi = 40$ and times
 $0.0011$ and
 $14$, respectively.

6. Experimental study
6.1. Experimental methods
To examine the behaviour of a physical fluid wedge we conduct a series of experiments using a commonly available viscoplastic fluid. We used ultrasound gel (Anagel^{TM}) as the experimental fluid because it is commercially available in large quantities and has a similar composition to Carbopol, which is commonly used for yield-stress fluid experiments. As described in the next subsection, the gel can be accurately described by a Herschel–Bulkley constitutive relation. In order to remove bubbles, the gel was mixed in 3 litre beakers for about two hours by incrementally raising the mixing head from the bottom of the beaker to its top.
We reproduce the geometry of our model in a square tank with a movable vertical backstop, as shown in figure 7. The tank has a length of  $150\,\text {cm}$, width of
 $20\,\text {cm}$ and height of
 $20\,\text {cm}$ and is made of acrylic glass. A computer-controlled stepper motor can move the backstop at a fixed speed
 $0.10\,\text {mm}\,\text {s}^{-1} \leq U \leq 6.00\,\text {mm}\,\text {s}^{-1}$. The gap between the backstop and the base is small enough for the leakage to be negligible. At the opposite end of the tank there is a plate that is set at the height of the initial fluid layer. To ensure that the gel does not slip with respect to the base of the tank, we covered the base with 60 grit waterproof aluminium oxide sandpaper. We verified that there is no slip by slowly inclining a sandpaper-covered plate with a lump of gel on top and observing that the upstream contact line did not move after the gel started flowing (Maillard et al. Reference Maillard, Mézière, Moucheront, Courrier and Coussot2016). Instead of sliding, we observed slumping-like flow with the contact area between the base and the fluid not changing. During the experiments we used a green line laser to illuminate a sheet of the gel of around
 $1.5\,\text {mm}$ in thickness. The laser light was let through a narrow 5 mm width slit cut along the centreline of the sandpaper base.
A schematic diagram of the experimental set-up.

Experiments were done by filling the tank with a uniform layer of gel of thickness  $h_\infty$ and moving the backstop at a fixed speed
 $U$. The system was imaged every 2–4 s by a Nikon digital SLR camera D7000, allowing us to extract the fluid surface shape over time. We placed the camera far enough from the tank for the distortion of images to be negligible.
6.2. Rheometry
Since ultrasound gel is not a commonly used experimental material, we did a rheological study to determine its constitutive relation. Haist et al. (Reference Haist2020) have looked into various ways to measure the rheology of ultrasound gel and fitted a Bingham constitutive relation. However, they found that their results depend quite heavily on the measurement set-up.
Rheological measurements were done using a Kinexus Pro+ rheometer by NETZSCH with a parallel-plate geometry. Rough plates were used to reduce the potential for slip. The diameter of the plates was  $40\,\text {mm}$, and a gap of
 $1\,\text {mm}$ was kept in all of the measurements. We conducted decreasing shear strain-rate ramps, following a procedure similar to that in Dinkgreve et al. (Reference Dinkgreve, Paredes, Denn and Bonn2016). Initially, the gel was pre-sheared at
 $100\,\text {s}^{-1}$ for
 $30\,\text {s}$ and then left to rest for
 $30\,\text {s}$ to ensure that all the tests started with the same initial shear state. Immediately afterwards, a logarithmic shear rate ramp lasting for
 $2\,\text {min}\ 40\, \text {s}$ was imposed from
 $100\,\text {s}^{-1}$ down to
 $10^{-5}\,\text {s}^{-1}$. We checked that making the ramp last longer did not affect the results, meaning that the ramp is slow enough for the gel to be in a quasi-steady shear state. Running the shear rate ramp in reverse showed little thixotropy. Using parallel plates results in a spatially varying stress field during the measurement, which we take into account by applying the Weissenberg–Rabinowitsch correction (Rabinowitsch Reference Rabinowitsch1929; Mendes, Alicke & Thompson Reference Mendes, Alicke and Thompson2014) in a similar manner to Varges et al. (Reference Varges, Costa, Fonseca, Naccache and Mendes2019) and Haist et al. (Reference Haist2020). All values of shear rate and stress are assessed at the rim of the rheometer plates.
The results of three such shear ramps are presented in figure 8. The measured stress–strain-rate curve is found to be less reproducible for different gel samples at shear rates below around  $1\,\text {s}^{-1}$, even though the samples were taken from the same location in the bulk of the gel. However, the results above
 ${\sim }1\,\text {s}^{-1}$ have very low variability and match the Herschel–Bulkley model very well. The discrepancy at low shear rates is likely due to wall slip in the rheometer (Magnin & Piau Reference Magnin and Piau1990; Barnes Reference Barnes1995; Mendes et al. Reference Mendes, Alicke and Thompson2014) since we observe that the apparent yield stress at low shear rates decreases with decreasing plate gap thickness.
Decreasing shear-rate ramp measurement results for three different samples taken from the same gel pack. At low shear rates (grey area) the different samples give rather different stresses, which we hypothesise is due to wall slip. Herschel–Bulkley model fit (red line) at high shear rates (white area) is consistent for different samples. The variable values are given at the rim of the rheometer plates.

We obtain the Herschel–Bulkley parameters by fitting this model to an increasing number of data points, starting from the highest shear rate. We minimise the total error in the fitting parameters,
 \begin{equation} \Delta = \sqrt{\left( \frac{\Delta n}{n} \right)^2 + \left( \frac{\Delta \tau_y}{\tau_y} \right)^2 + \left( \frac{\delta K}{K} \right)^2}, \end{equation}
with respect to the number of data points used for the fit and use the corresponding number of data points to get the best estimate of  $\tau _y$,
 $n$ and
 $K$. Figure 8 shows an example of a fit (red line) obtained by this method.
We repeated shear-rate ramp measurements for different gel samples taken from the same source in order to estimate the random uncertainty in the measured rheological parameters. The resultant uncertainties of the rheological parameters are presented in table 2. They were found to be dominant over the uncertainty associated with the high- $\dot \gamma$ misfit of the Herschel–Bulkley model. We also checked that the gel temperature has a negligible effect on the measurement results in a temperature range of
 $17.5\unicode{x2013}25.0\,^{\circ }\text {C}$.
Experimental parameters and associated uncertainties.

6.3. Experimental results
In total 13 experiments were conducted, as summarised in table 2. We varied the initial layer thickness  $h_\infty$ and the scraping speed
 $U$ and measured the gel rheology after every experimental session. Low-
 $h_\infty$ experiments (1–3, 7, 8) allow us to reach larger dimensionless times, but result in a steeper fluid surface slope (0.35 on average) and hence a larger anticipated deviation away from the lubrication approximation. On the other hand, experiments with larger
 $h_\infty$ have a lower gel surface slope of around 0.16 and provide more data points in the early-time regime. With our set-up and ultrasound gel as the experimental fluid it is impossible to explore the dynamics associated with low Bingham numbers, which makes the quasi-power-law regimes inaccessible.
Experiments done by Taylor-West & Hogg (Reference Taylor-West and Hogg2024) were similar but had a few important differences. They used hair gel as an experimental fluid. Although its main ingredient (Carbopol) is the same as in ultrasound gel, hair gel has a lower yield stress and a higher consistency, thereby making it more difficult to achieve higher  $Bi$. Also, their experiments did not try to eliminate basal slip but instead took it into account by considering a slip law with carefully chosen parameters. Nevertheless, such basal slip is often one of the key sources of experimental uncertainty.
Figure 9(a) shows a characteristic image of the illuminated fluid wedge during an experiment, while figures 9(b) and 9(c) show pictures of the wedge at the end of experiments 1 and 13, respectively. An image sequence of a full experiment is shown in movie 1 available at https://doi.org/10.1017/jfm.2024.908. These images were used to measure the fluid surface height by detecting where a green channel intensity value exceeded a chosen threshold intensity. When devising the detection algorithm, we also took into account occasional bright reflections, brightly illuminated bubbles, shadows in gel illumination and longitudinal variations in illumination intensity, some of which can be seen in figure 9(a). The wedge nose position  $x_n$ is defined experimentally as the horizontal coordinate where the fluid surface height falls below a predefined threshold. For nose positions we therefore measured the initial horizontal surface shape, obtaining its mean height
 $h_\infty$ with an associated standard deviation. Then we chose the height threshold for
 $x_n$ to be two standard deviations above the mean initial height. On average, this threshold
 $\Delta h_{th}$ was found to be
 $1.6$ mm or
 $7\,\%$ above the initial gel surface height.
(a) A single experimental image with laser illumination;  $h_{\infty } = 3.85\,{\rm cm}$,
 $U = 0.5\,{\rm mm}\,{\rm s}^{-1}$ (exp. 11). Brightness and contrast enhanced. (b) Photograph of the gel wedge immediately after experiment with
 $h_\infty = 1.00\,{\rm cm}$,
 $U = 0.5\,{\rm mm}\,{\rm s}^{-1}$ (exp. 1). Creases are clearly visible. Transverse variation in fluid surface height is noticeable. (c) Photograph of the gel wedge immediately after experiment with
 $h_\infty = 3.90\,{\rm cm}$,
 $U = 2.0\,{\rm mm}\,{\rm s}^{-1}$ (exp. 13). The flow is closer to a quasi-two-dimensional one than in experiment 1.

The dominant sources of experimental uncertainty are in the measurements of  $x_n$ and
 $h_\infty$ (table 2). The uncertainty in the wedge nose position is due to the fact that the predicted nose discontinuity in the fluid surface slope is smoothed out in the experiments, requiring us to use the threshold
 $\Delta h_{th} \approx 0.07 h_\infty$ as described in the previous paragraph. The arbitrariness of this threshold sets the uncertainty in dimensional
 $x_n$, and we estimate it to be
 \begin{equation} \Delta x_n = 0.5 \frac{\Delta h_{th}}{\left| h_x (x_n^-) \right|} = \frac{\Delta h_{th} \rho g h_\infty}{2 \tau_y}, \end{equation}
where we used (2.7) as an estimate for the slope at the nose. We also note that at late times the experiments exhibit a boundary layer close to the backstop. This introduces an uncertainty of around  $5\,\%$ in the experimental determination of the dimensional
 $h_0$ when comparing it with the modelled surface height at the backstop, as it is not clear where the height needs to be measured to best represent the theoretical (dimensional)
 $h_0$.
Two sets of measured gel surface profiles in the frame of the moving backstop are shown in figure 10(a) for a lower  $h_\infty$ experiment and figure 10(b) for higher
 $h_\infty$ (note the truncated vertical axis). We observe that the wedge length and height grow monotonically with time. As seen from the decreasing spacing between surface profiles, the growth of the wedge height slows down with time. The fluid surface slope at the measured nose position is generally lower than that predicted by the thin-layer model, as shown by the blue lines. This was similarly reported by Taylor-West & Hogg (Reference Taylor-West and Hogg2024). However, the observed slope increases quite rapidly just above the nose of the wedge, reaching values similar to those predicted. Irrespective of the experimental parameter values, crease-like features formed in the gel surface as the wedge was growing, which were also observed by Maillard et al. (Reference Maillard, Mézière, Moucheront, Courrier and Coussot2016).
(a) Measured fluid surface profiles (black) for  $h_\infty = 0.95\,{\rm cm}$,
 $U = 4.0\,{\rm mm}\,{\rm s}^{-1}$ (exp. 8). The surface is plotted every
 $7\,\text {s}$. (b) Measured fluid surface profiles for
 $h_\infty = 3.90\,{\rm cm}$,
 $U = 2.0\,{\rm mm}\,{\rm s}^{-1}$ (exp. 13). The surface is plotted every
 $14\,\text {s}$. Note that the vertical axis starts from a non-zero value. Blue lines indicate surface slope at the wedge nose as predicted by (2.7). The aspect ratio in both plots is exaggerated. The profiles are truncated at the measured nose position or at the edge of the imaging area.

As shown in figure 11, the dimensionless experimental wedge height and length measurements have a reasonably good agreement with the model predictions. The results are plotted versus  $Bi\ \tilde t$, because
 $\tilde t \sim Bi^{-1}$ corresponds to the predicted transition between the early- and the late-time regimes. Experiments run at different
 $U$ and
 $h_\infty$ are combined together, with red and blue markers indicating the low- and high-
 $h_\infty$ experiments, respectively, while the black lines show the model predictions. Because the predictions depend weakly on the Bingham number, we only plot them for the smallest and largest
 $Bi$ value achieved in the experiments. The scatter of points within the two groups of experiments is rather weak, indicating that experiments are quite reproducible even when the scraping speed
 $U$ is varied. The maximum wedge height in all of the experiments (figure 11a) has a better match with the model predictions at later times than at the start. In particular, the wedge height in the high-
 $h_\infty$ experiments is
 ${\approx }12\,\%$ lower than predicted, which is not explained by the uncertainty in the
 $\tilde{h}_0$ measurement. The heights for small
 $h_\infty$ at earlier times are also too low, which is likely due to uncertainty in the
 $\tilde h_0$ measurement as indicated by the cyan error bars. Towards the end of the experiments, the wedge height is of the predicted size, but also increases at a faster rate than predicted. The experimentally observed wedge length matches the model predictions for a wide range of time values (figure 11b) and shows a universal trend irrespective of the experimental parameters. The early-time length may be slightly above the theoretical predictions, but is within the range of the experimental uncertainty.
Experimental results of the dimensionless (a) wedge height  $\tilde h_0$ (height change
 $\tilde h_0 - 1$ in the inset) and (b) length for all the experiments compared with the model predictions at
 $n = 0.37$ and
 $Bi = 1.84, 8.16$ (black lines). Blue points denote higher-
 $h_\infty$ experiments, while red points mark the lower-
 $h_\infty$ experiments. The horizontal axis shows dimensionless time
 $\tilde t$ multiplied by
 $Bi$, because
 $Bi\ \tilde t \approx 1$ is when the transition from early to late times is expected to happen. Cyan and magenta error bars denote uncertainty for the lower- and higher-
 $h_\infty$ experiments, respectively. The uncertainty in
 $Bi\ \tilde{t}$ is of the order of the marker size.

In figure 12 we show rescaled fluid surface profiles according to the modelled universal self-similar profiles for experiments 1 and 12. The profiles appear to collapse to a universal shape for both late times (figure 12a,b) and the early times (figure 12c). For the early-time profiles of the high thickness experiment we do see a linear trend as predicted, but the surface slope corresponds to a Bingham number that is approximately half of the measured one. Surface profiles of other experiments (not shown here) have a similar linear shape at early times but also behave as if the Bingham number was lower. The predicted late-time shape is matched very well for small- $h_\infty$ experiments (figure 12a), and a similar behaviour is seen in other small-
 $h_\infty$ experiments. The large-
 $h_\infty$ experiments (figure 12b) did not reach late enough times for the late-time asymptotic regime, but they match well the computed intermediate shape (dashed line).
Experimental profiles of the gel surface scaled to the predicted universal self-similar shapes. (a)  $h_\infty = 1.00\,{\rm cm}$,
 $U = 0.5\,{\rm mm}\,{\rm s}^{-1}$ (exp. 1) for the late-time regime. Surface profiles are plotted every 40 s and get darker with increasing time. Dashed line indicates the asymptotic self-similar shape (row 4 of table 1). (b)
 $h_\infty = 3.85\,{\rm cm}$,
 $U = 0.5\,{\rm mm}\,{\rm s}^{-1}$ (exp. 12) for the late-time regime. Surface profiles are plotted every 20 s and get darker with increasing time. Dashed line indicates theoretically predicted surface shape at the end of the experiment. (c)
 $h_\infty = 3.85\,{\rm cm}$,
 $U = 0.5\,{\rm mm}\,{\rm s}^{-1}$ (exp. 12) for the early-time regime. Surface profiles are plotted every 8 s and get darker with decreasing time. Only the first few profiles are shown. Dashed line shows the early-time asymptotic self-similar prediction (row 2 of table 1) at
 $Bi$ value that best fits the experimental data.

The experimental wedge has some features that are not taken into account by our model. The wedge surface has prominent creases (figure 9b) that have smooth crests but very sharp troughs where the fluid surface slope is seemingly discontinuous. The creases formed in all experiments. In both images in figures 9(b) and 9(c) the surface shape is quasi-two-dimensional, as assumed in our model. However, there is also some three-dimensionality caused by sidewall shear. Specifically, close to the backstop the gel thickness is lower at the centre than near the sidewalls, while close to the wedge nose the central thickness is higher than at the sidewalls. This effect is more prominent in the low- $h_\infty$ experiments and may result in a lower measured surface slope at the central plane. We also see that the wedge has a rather steep slope, which might make the lubrication approximation less reliable.
Another feature that is not accounted for in our theory is the positive fluid surface slope next to the backstop. As observed by Taylor-West & Hogg (Reference Taylor-West and Hogg2024), this is a consequence of limited slip with respect to the backstop resulting in a boundary layer at  $x = O(h)$ where the lubrication approximation breaks down. Our experimental profiles in figure 10(b) indeed show that the width of this boundary layer with positive slope increases approximately linearly with the wedge height. Other experiments have the boundary layer contaminated by the creases or the whole of it being too close to the backstop to measure, which makes it difficult to draw more quantitative conclusions.
Here we examine some preliminary particle image velocimetry (PIV) results to better understand the deformation of the experimental wedge. Figure 13 shows a snapshot of an experiment at  $U = 7\,{\rm mm}\,{\rm s}^{-1}$ and
 $h_\infty = 1.30\,\text {cm}$. This experiment differs from those studied in § 6 because there is no sandpaper on the tank base and the surface slope is much steeper due to fast scraping speed
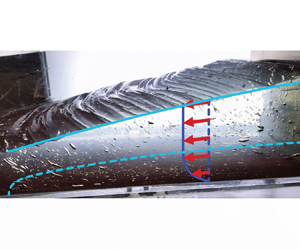
 $U$. However, the measured fluid velocity is still predominantly horizontal and some key features of the wedge dynamics are uncovered by plotting the fluid velocity magnitude. The top part of the wedge (in white) is effectively unyielded and moves together with the backstop, while the horizontal layer beyond the nose of the wedge (in black) forms another slowly deforming region that is at rest in the laboratory frame. This is very similar to the scraping experiments of Maillard et al. (Reference Maillard, Mézière, Moucheront, Courrier and Coussot2016) in a very similar geometry but with a small gap between the base and the backstop. A yield surface separates the top pseudo-plug from the deforming layer below, as predicted by the simple thin-layer model. However, the model fails close to the nose of the wedge where the yield surface intersects the surface of the fluid. As seen from the steep gradient in
 $|\boldsymbol {u}|$, the nose of the wedge is the most rapidly deforming part of the fluid surface, indicating that the creases likely form one at a time close to the nose of the wedge and then get advected into the pseudo-plug at the upper part of the wedge. Surface crease formation requires relatively high strain rates somewhere in the fluid surface and indicates that there are likely important compressional stresses not accounted for in the present lubrication analysis. These stresses lead to a localised area of high strain rate at the nose of the wedge which results in the periodic creasing and deformation of the surface. As a result, there must be a part of the fluid surface that does not belong to the pseudo-plug and hence the yield surface must at some point cross the fluid surface. We therefore predict that even in an experiment with a shallower fluid surface and no basal slip the qualitative features of figure 13 will remain.
Magnitude of the fluid velocity with respect to the base at  $h_\infty = 1.30\,\text {cm}$,
 $U = 7\,{\rm mm}\,{\rm s}^{-1}$ and
 $t = 40.5\,\text {s}$ in an experimental set-up without sandpaper base.

7. Discussion
The viscoplastic wedge model possesses similarities to both dominant types of accretionary wedge models. At low Bingham numbers, the system is in the quasi-Newtonian regime recovering the dynamical evolution seen in a Newtonian model (Emerman & Turcotte Reference Emerman and Turcotte1983) where the whole wedge is deforming as a response to the incoming fluid and gravity. Our model also has some striking similarities to the granular Coulomb models (Davis et al. Reference Davis, Suppe and Dahlen1983; Dahlen Reference Dahlen1990), especially in the quasi-static regimes attainable at high  $Bi$. The
 $Y |_{x_n} = 0$ boundary condition predicts a fixed surface slope at the nose of the wedge that is controlled by the yield stress. In the early quasi-static regime this boundary condition implies that the whole wedge has a constant slope. This is similar to the Coulomb models where the wedge slope is instead controlled by the coefficient of friction between grains. We also note that, similarly to Coulomb models, the quasi-static regimes of our viscoplastic model have a shape that is instantaneously determined by the fluid mass and the boundary conditions because the system is everywhere close to the yield stress.
The experiments present a few features that deviate from our simple theory. The fluid surface slope at the nose is always lower than predicted by the  $Y |_{x_n} = 0$ boundary condition, as if the system effectively possessed a lower yield stress. This can be seen in figures 10 and 12(c), and was similarly observed by Taylor-West & Hogg (Reference Taylor-West and Hogg2024). Our thin-layer analysis predicts a discontinuity in the surface slope at the wedge nose, which is hardly observed in the experiments. Instead, we see a sudden but not discontinuous change in
 $h_x$, making it difficult to determine the nose position
 $x_n$ from our experimental results. In reality, the predicted discontinuity in
 $h_x$ is smoothed out because the lubrication approximation predicts a sudden change in the slope over distances much shorter than the horizontal scale of the flow, but not necessarily shorter than the thickness of the fluid layer (Lister & Hinton Reference Lister and Hinton2022). We also note that in figure 10 there is a rapid increase in the slope as one moves from the measured
 $x_n$ position upwards, suggesting that our
 $x_n$ values may be in the middle of the smoothed-out jump in the surface slope. The fact that some of the experiments had a surface slope comparable to unity also suggests that the experiments may not always fully satisfy the lubrication approximation.
The early-time height of the wedge in the high- $h_\infty$ experiments is significantly lower than predicted. A possible reason for this mismatch is three-dimensional effects, which result in lower backstop thickness at the centre of the flow rather than at the sidewalls. We estimate the topographic variation of fluid height across the width of the tank to be up to a few per cent (figure 9). We also cannot discard the possibility of some slip being present even on sandpaper, since our experiments were much longer than the slip tests described in § 6. Given that some of the experiments in figure 11 had scraping speeds as low as
 $0.25\,{\rm mm}\,{\rm s}^{-1}$, even very slow slip may have affected the results by making the wedge more shallow. An elastic response of the wedge material should also have negligible influence on the experimental results. Taylor-West & Hogg (Reference Taylor-West and Hogg2024) found that the Deborah number, which is the ratio of the elastic relaxation time scale to the experimental time scale, is
 ${<}2.4 \times 10^{-4}$ for their experimental set-up. Because our experimental parameters are of similar orders of magnitude and both experimental fluids are primarily composed of carbomer, we anticipate that the Deborah number in our experiments is also negligible. There is likely some strain in the wedge that is associated with the elastic deformation needed to start flowing above the yield stress, but we do not expect it to result in any significant strain rate in the system.
In the experiments, we observed surface creases that have only been reported in this geometry by Maillard et al. (Reference Maillard, Mézière, Moucheront, Courrier and Coussot2016) and Taylor-West & Hogg (Reference Taylor-West and Hogg2024). The creases formed irrespective of the chosen  $U$ and
 $h_\infty$ values and, given the preliminary PIV data in figure 13, they seem to form close to the nose of the wedge. The measured surface profiles in figure 10 show that new creases appear below those that have formed before, which is consistent with the PIV results. Also, the creases seem to stay relatively fixed in the backstop frame, which also matches the PIV measurements indicating that the upper part of the wedge forms a large pseudo-plug. Similar creases with sharp troughs were also seen in numerical simulations of a viscoplastic column collapse by Liu et al. (Reference Liu, Balmforth, Hormozi and Hewitt2016), suggesting that the instability seen in our experiments might be a result of purely plastic failure. Importantly, the creases also resemble short-wavelength features that are associated with fold-thrust belts in geophysical accretionary wedges such as the Makran accretionary prism (Grando & McClay Reference Grando and McClay2007) and Indo-Burman Ranges (Maneerat & Bürgmann Reference Maneerat and Bürgmann2022). Many similar topographic features are also seen in analogue granular experiments (Graveleau et al. Reference Graveleau, Malavieille and Dominguez2012). Even though a viscoplastic fluid rheology does not exhibit brittle behaviour and thus cannot produce tectonic faults, the presence of a yield stress allows for the stress to localise, recovering topographic structures similar to those seen in faulting rock. We also note the presence of pseudo-plug and deforming layers in our model roughly parametrises the brittle–ductile transition, which may also be an important feature in real accretionary wedges (Karig Reference Karig1990; Peterson et al. Reference Peterson, Barnhart and Li2018).
The fact that the viscoplastic wedge model is able to recover some of the behaviour of both continuum and granular models suggests that it might give useful insights into the evolution and effective rheology of real accretionary wedges. Plausible Bingham numbers for the effective rheology of mountains can be determined by considering a simple yield stress estimate. The stress drop during an earthquake, if it releases all the accumulated stress, represents the deviatoric stress supported by the crust to the depth at the base of the fault. If we consider such an earthquake that ruptures the full depth of the brittle layer, which in our model corresponds to the pseudo-plug layer, then the stress drop is analogous to the deviatoric stress supported at the yield surface, i.e. the yield stress. As a first-order estimate, the stress drop during an earthquake is in the range of 1–100 MPa (Turcotte & Schubert Reference Turcotte and Schubert2014). Using some parameters of Indo-Burman Ranges considered by Ball et al. (Reference Ball, Penney, Neufeld and Copley2019): an average sediment thickness of  $h_\infty = 3.6\,\text {km}$, convergence speed
 $U = 3.8\,\text {mm}\,\text {yr}^{-1}$, viscosity
 $\mu = 5 \times 10^{19}\,\text {Pa}\,\text {s}$ and density
 $\rho = 2.6 \times 10^3\,\text {kg}\,\text {m}^{-3}$ and assuming a Bingham rheology suggests
 $Bi \in (0.2, 20)$, an evolution time scale in (2.8a–c)
 $\rho g h_\infty ^3 / 3 \mu U^2 \approx 20 \times 10^6\,\text {yr}$ and a length scale of
 ${\approx }70\,\text {km}$. Therefore, depending on the precise yield stress value, the Bingham number can range from low to high and hence we predict that accretionary wedges could be in both quasi-Newtonian and quasi-static regimes. The regime would also depend on the age of an accretionary wedge because the time scale estimate of
 $20 \times 10^6\,\text {yr}$ is comparable to typical time scales of tectonic processes. For example, Ball et al. (Reference Ball, Penney, Neufeld and Copley2019) estimated from various sources (Byrne, Sykes & Davis Reference Byrne, Sykes and Davis1992; Dolati Reference Dolati2010) that the Makran accretionary prism has been growing for 30–90 Myr. More insights could be gained by looking at the measured surface topography of a specific wedge as has been done by Ball et al. (Reference Ball, Penney, Neufeld and Copley2019). As shown in table 1 and figure 5, we predict that different asymptotic regimes should possess distinct power-law shapes. Therefore, fitting the modelled shape to one measured in real mountains would constrain the Bingham number, providing quantitative insights into the effective continuum rheology of rocks.
Future studies may experimentally explore the lower-Bingham-number region of the regime diagram in figure 5(a) to determine the behaviour of a quasi-Newtonian flow. This could be done by considering a lower-yield-stress fluid with a relatively higher consistency  $K$ so that the ratio
 $\tau _y / K$ is lower. By looking at (5.5), decreasing
 $h_\infty / U$ is another possibility to reduce the Bingham number, but this would result in steep fluid surface slopes which cannot be accurately described by using lubrication analysis. Likewise an interesting extension of the current work would be an analysis of compressional or extensional flows in these settings, which is likely necessary to describe the form of the creases observed in the experiments.
8. Conclusions
We have studied a thin-film viscoplastic fluid model of an accretionary wedge, a type of mountain range where sediments are scraped off by converging tectonic plates. The model system can be described by a single dimensionless Bingham number which, for the Bingham constitutive relation, takes the form  $Bi = {\tau _y h_\infty }/{3 \mu U}$. In the limits of large or small
 $Bi$ and time we described the resulting asymptotically self-similar behaviour of the model solutions. The asymptotic regimes obtained have distinct power-law behaviours that can be used to make quantitative comparisons with real accretionary wedges. Indeed, the profiles obtained in this study show that a Bingham rheology recovers profiles reminiscent of both the Coulomb model of accretionary wedges and the viscous model. Importantly, our model also provides insight into where and when these regimes might emerge.
We tested the model experimentally for high Bingham numbers using an ultrasound gel. The quasi-static regime predictions for the wedge height and length were generally observed together with the collapse of the fluid surface profiles to early- and late-time universal shapes. The main mismatch with our theory was observed in the fluid surface slope close to the wedge nose, which we attribute to the failure of the lubrication approximation.
The viscoplastic model rheology results in a yield surface separating the pseudo-plug layer from the viscously deforming layer. As a result, the model enables a rough parametrisation of the brittle–ductile transition of the crust, which may be relevant to accretionary wedges such as the Makran (Peterson et al. Reference Peterson, Barnhart and Li2018). Our experiments also exhibit short-length-scale creases that resemble features seen in real accretionary wedges, which in geophysical analogue models were only observed before by using granular materials. We therefore hope that these types of analytical and experimental models can be used to infer effective accretionary wedge rheology and evolution from their surface topography.
Supplementary movie
Supplementary movie is available at https://doi.org/10.1017/jfm.2024.908.
Acknowledgements
We are grateful to A. Pluck who contributed to designing the experimental set-up and also built it. We thank M. Hallworth, D. Thomas-McEwen, J. Milton, D. Page-Croft and S. Dalziel who helped with subsequent set-up modifications and provided general support throughout the experimental study. We also greatly appreciate the contribution of N. Balmforth and four anonymous referees during the editorial process.
Funding
E.R. is supported by the Natural Environment Research Council (grant number NE/S007164/1). T.V.B. is supported by Leverhulme Trust Early Career Fellowship (ECF-2022-584). C.E.P. is supported by a postdoctoral fellowship from the Resilience to Nature's Challenges 2 programme.
Declaration of interests
The authors report no conflict of interest.
Appendix A. Derivation of some solution properties for  $n = 1$

Let us study the continuity properties of the solutions  $h(x, t)$,
 $Y(x, t)$ with
 $x$. We work in dimensionless variables of the model with the Bingham constitutive relation, which were defined in (2.8a–c).
Consider parts of the solution domain where
 \begin{equation} Y > 0. \end{equation}
Then (2.9b) gives
 \begin{equation} h_x = \text{sgn} \left( h_x \right) \frac{Bi}{h - Y}. \end{equation}
After substituting (A2) to the flux expression (2.9a),
 \begin{equation} q ={-}h - \text{sgn} \left( h_x \right) \frac{Bi\ Y^2 (3 h - Y)}{2 (h - Y)}. \end{equation}
One can show that, given  $h$,
 $q$ and
 $\text {sgn} ( h_x )$ values, this equation has at most one valid solution for the yield surface height
 $Y$. Therefore, since
 $h$ and
 $q$ are continuous,
 $Y$ must also be continuous in the regions of the solution where condition (A1) holds. From (2.9b),
 $h_x$ is also continuous in those regions. Note that a change in
 $\text {sgn} ( h_x )$ results in a discontinuous jump in
 $q$ in (A3) and thus cannot happen.
Continuity of  $Y$ when
 $Y > 0$ means that
 $Y$ is continuous globally, since elsewhere it is equal to zero and must approach that value continuously. A corollary of this is that
 \begin{equation} |h_x| \rightarrow \frac{Bi}{h}\quad \text{as}\ Y \rightarrow 0. \end{equation}
For the wedge nose position in particular we conclude
 \begin{equation} h_x \rightarrow -Bi \quad \text{as}\ x \rightarrow x_n^- , \end{equation}
which is a useful boundary condition when studying the asymptotic regimes of the model. Note, however, that the global continuity of  $Y$ does not imply global continuity of
 $h_x$. In particular, the fluid surface slope need not be continuous at a point where
 $Y = 0$. This is seen in the solutions studied in §§ 3 and 4, where
 $h_x$ jumps from
 $-Bi$ to zero at
 $x = x_n$.
The last result that we show is that if initially  $h_x \leq 0$ everywhere, then this must hold for all subsequent times. Notice first that
 $h_x(x = 0) < 0$ is always true in order to satisfy the no-flux boundary condition (2.11a). Hence, only the interior points of the fluid surface could potentially acquire a positive slope. Since
 $h_t$ is finite,
 $h_x$ can become positive only at a point where
 $h_x = 0$ and
 $h_{x t} > 0$. The first of these two requirements implies
 $Y = 0$ and thus using (2.9a),
 $h_t = h_x$. The second requirement then gives
 \begin{equation} 0 < h_{x t} = h_{x x}. \end{equation}
But,  $h_x = 0$ and
 $h_{x x} > 0$ mean that the fluid surface slope as a function of
 $x$ changes sign, so, provided we are at an interior point
 $x > 0$, a point with a positive slope already exists, giving a contradiction. Therefore,
 $h_x \leq 0$ holds for all
 $(x, t)$ as long as it holds at the initial state.
Appendix B. Derivation of the early-time wedge shape
At early times the fluid surface is still close to the initial state described at the end of § 2.1,  $\delta h \equiv h - 1 \ll 1$. In this limit the governing equations may be linearised and, after substituting the yield surface height in (2.9b) into the no-flux boundary condition (2.11a), we get
 \begin{align} q &={-}h - \frac{1}{2} \left( 2 h^3 + \frac{3 Bi\ h^2}{h_x} - \frac{Bi^3}{h_x^3} \right) h_x \nonumber\\ &\simeq{-}1 - h_x - \frac{3 Bi}{2} + \frac{Bi^3}{2 h_x^2} = 0, \quad \text{at} \ x = 0. \end{align}
The fluid flux for small wedge height perturbation  $\delta h \ll 1$ is therefore determined only by the surface slope. Hence, boundary condition (B1) determines the slope at the boundary in terms of the Bingham number only, which can be expressed by the scaling relation
 \begin{equation} \frac{\delta h}{x_n} \sim \phi(Bi), \end{equation}
where  $\phi (Bi)$ is a function satisfying (B1). Global mass conservation, (2.5), provides the second scaling relation:
 \begin{equation} \frac{\delta h\ x_n}{t} \sim 1. \end{equation}
Relations (B2) and (B3) suggest the following self-similar solution exists at early times:
 $$\begin{gather} h \simeq 1 + t^{1/2} f(\eta), \end{gather}$$
 $$\begin{gather}\eta = t^{{-}1/2} x, \end{gather}$$
 $$\begin{gather}x_n \simeq t^{1/2} \eta_n. \end{gather}$$
Substituting (B4) into the governing equations (2.9) and keeping the terms with leading-order powers of  $t$, the shape of the wedge is given by
 \begin{equation} \frac{1}{2} (f - \eta f') = \left[ 1 + \frac{1}{2} \left( 1 + \frac{Bi}{f'} \right)^2 \left( 2 - \frac{Bi}{f'} \right) f' \right]'. \end{equation}
This expression can be heavily simplified, and, after substituting (B4) into the boundary and initial conditions (2.11b), (2.11c), (2.11d) and (B1), the early-time problem becomes
 $$\begin{gather} \frac{1}{2} (f - \eta f') ={-} \left[ - f' + \frac{Bi^3}{2 f'^2} \right]', \end{gather}$$
 $$\begin{gather}- 1 - f' - \frac{3 Bi}{2} + \frac{Bi^3}{2 f'^2} = 0, \quad \text{at} \ \eta = 0, \end{gather}$$
 $$\begin{gather}f = 0, \quad \text{at} \ \eta = \eta_n(t), \end{gather}$$
 $$\begin{gather}f' ={-}Bi, \quad \text{at} \ \eta = \eta_n(t), \end{gather}$$
 $$\begin{gather}f \rightarrow 0,\quad \text{as}\ t \rightarrow 0. \end{gather}$$


 Open access

