1. Introduction
The erosion and transport of immersed granular materials subjected to a fluid flow is a fundamental and complex problem in hydraulics, coastal engineering and geomorphology. Approximately 150 years ago, the French engineer Du Boys (Reference Du Boys1879) was the first to present a rational approach to sediment transport in gravel-bed rivers, as reported by Hager (Reference Hager2005). In steady or statistically steady flows, the threshold is now usually characterised by a critical Shields number,
 $\textit{Sh}_c$
, which describes the ratio of the drag force of the fluid to the apparent weight of the particles (Shields Reference Shields1936). Most studies investigating
 $\textit{Sh}_c$
values have been conducted in laboratory settings under uniform shear and pressure-driven current conditions (White Reference White1940; Buffington & Montgomery Reference Buffington and Montgomery1997; Miller, McCave & Komar Reference Miller, McCave and Komar1977; Loiseleux et al. Reference Loiseleux, Gondret, Rabaud and Doppler2005; Ouriemi et al. Reference Ouriemi, Aussillous, Medale, Peysson and Guazzelli2007). Various field observations have also validated Shields-type criteria for rivers, estuaries and desert dunes (Iversen & White Reference Iversen and White1976; Garcia Reference Garcia1999; Charru, Andreotti & Claudin Reference Charru, Andreotti and Claudin2013), and further laboratory investigations have highlighted the onset of bedform initiation under turbulent flows (Franklin & Charru Reference Franklin and Charru2011; Franklin Reference Franklin2015). Beyond these threshold estimates, continuum and two-phase flow models have also been developed to capture sediment transport and bedform dynamics under laminar or turbulent shear (Chauchat & Médale Reference Chauchat and Médale2010; Charru et al. Reference Charru, Bouteloup, Bonometti and Lacaze2016; Chauchat et al. Reference Chauchat, Cheng, Hsu, Calantoni, Armenio and Greco2017).
Many natural and industrial flows are impulsive or highly unsteady, such as burst-like gusts, breaking waves, flow induced by a propeller and the vortical wake of swimming organisms. In such situations, peak shear stresses arise on the granular bed from localised, short-lived jets and vortices, which are not captured by the classical steady-flow threshold. This motivates the need for well-controlled model configurations in which the transient forcing can be characterised quantitatively and related to erosion onset.
The present study is motivated by a simple and well-defined unsteady wall-bounded flow: a disk translating normally to a nearby boundary. This kinematics generates: (i) a squeeze or suction flow in the thin gap; and (ii) starting and stopping vortices shed from the disk rim. These two flow ingredients have been quantified for a disk translating normally towards or away from a rigid wall using particle image velocimetry (PIV) and numerical simulations (Steiner et al. Reference Steiner, Morize, Delbende, Sauret and Gondret2025). Here, we replace the rigid wall with a granular bed and ask whether these flow scalings can predict the onset, timing and spatial distribution of erosion. More broadly, this set-up captures key ingredients of many impulsive wall-bounded flows in which thin-gap radial motion and vortex shedding coexist.
Unsteady, vortex-driven erosion is important in different situations. For instance, burrowing bivalves and razor clams fluidise sand by pulsed suction flows (Winter, Deits & Hosoi Reference Winter, Deits and Hosoi2012) and batoid fishes shed starting vortices that excavate pits for feeding or cover (Williamson & Roshko Reference Williamson and Roshko1988). Another example is the scouring processes around obstacles such as bridge piers or offshore wind turbine masts, where the horseshoe vortices act at the foot of the structures and wake vortices act downstream, underscoring the coexistence of distinct scour modes governed by local transient vortex structures (Roulund et al. Reference Roulund, Sumer, Fredsøe and Michelsen2005; Manes & Brocchini Reference Manes and Brocchini2015; Auzerais et al. Reference Auzerais, Jarno, Ezersky and Marin2016; Lachaussée et al. Reference Lachaussée, Bertho, Morize, Sauret and Gondret2018).
Localised erosion and sediment resuspension by isolated vortices and transient jets have been considered in different studies. Impinging turbulent jets on a granular bed produce localised erosion when their centreline velocity exceeds a critical value (Badr, Gauthier & Gondret Reference Badr, Gauthier and Gondret2016; Brunier-Coulin, Cuéllar & Philippe Reference Brunier-Coulin, Cuéllar and Philippe2017; Sharma et al. Reference Sharma, Gong, Azadi, Sauret and Gondret2022), and this flow configuration is used to characterise soil stability in the so-called Jet Erosion Test (Hanson & Cook Reference Hanson and Cook2004). When a vortex ring hits a granular bed, it can also erode grains and create craters (Munro, Bethke & Dalziel Reference Munro, Bethke and Dalziel2009; Bethke & Dalziel Reference Bethke and Dalziel2012; Masuda et al. Reference Masuda, Yoshida, Ito, Furuya and Sano2012; Yoshida & Sano Reference Yoshida and Sano2014).
Another important flow configuration is encountered in footstep situations (Zhang et al. Reference Zhang, Ahmadi, Qian and Ferro2008; Kubota & Higuchi Reference Kubota and Higuchi2013), where a rapid radial outflow or inflow develops in the thin gap between the body and the bed, together with a pressure impulse and the azimuthal shear of one or more vortex rings. Human foot motions, such as walking and foot tapping, resuspend particulate matter on the floor and redistribute it, thereby increasing particle concentration in the air and affecting indoor air quality.
A closely related flow is dust resuspension during the approach and collision of an object onto a dusty wall (Mädler & Koch Reference Mädler and Koch1999; Eames & Dalziel Reference Eames and Dalziel2000). The flow induced by a disk approaching a dusty wall has been investigated as a simplified model for resuspension due to human walking motion (Khalifa & Elhadidi Reference Khalifa and Elhadidi2007; Kubota, Hall & Higuchi Reference Kubota, Hall and Higuchi2009). These studies highlight that a high-velocity flow is ejected from the gap perimeter and spreads radially outward as a decelerating wall jet, promoting particle detachment, while a vortex structure developing outside the gap contributes to lifting and dispersing already resuspended particles (Khalifa & Elhadidi Reference Khalifa and Elhadidi2007; Kubota et al. Reference Kubota, Hall and Higuchi2009). Further studies of free-falling disks emphasise the role of near-wall shear beneath the disk rim in controlling the resuspended region (Sajadi et al. Reference Sajadi, Saidi, Ahmadi, Kenney and Taylor2013; Elhadidi & Khalifa Reference Elhadidi and Khalifa2013).
Steiner et al. (Reference Steiner, Morize, Delbende, Sauret and Gondret2025) have recently performed PIV measurements and numerical simulations for the sinusoidal translation of a disk towards or away from a solid wall. This study has shown that a disk approaching a solid bottom wall drives an outward squeezing flow in the disk–wall gap that is maximum at the edge of the disk and that occurs during the decelerating part of the disk motion. In the opposite case, where the disk moves away from the solid wall, the inward suction flow in the disk–wall gap is maximum with the same velocity value, but occurs during the accelerating part of the disk motion. In both cases, the vortices are reinforced by the wall compared with the unbounded case characterised by Steiner et al. (Reference Steiner, Morize, Delbende, Sauret and Gondret2023). Owing to the contrasting flow fields – and hence wall stresses – induced by a disk moving towards or away from a wall shown by Steiner et al. (Reference Steiner, Morize, Delbende, Sauret and Gondret2025), we anticipate corresponding differences in both the onset and the spatial distribution of erosion in the case where a disk approaches or moves away from the granular bed.
For reference, in steady boundary-layer configurations, classical studies report that the critical Shields number for erosion
 $\textit{Sh}_c$
depends on the flow regime, with values in laboratory settings ranging from
 $\textit{Sh}_c \simeq 0.13 \pm 0.01$
in the laminar regime to typically
 $0.04$
in the turbulent regime (White Reference White1940; Miller et al. Reference Miller, McCave and Komar1977; Buffington & Montgomery Reference Buffington and Montgomery1997; Loiseleux et al. Reference Loiseleux, Gondret, Rabaud and Doppler2005; Ouriemi et al. Reference Ouriemi, Aussillous, Medale, Peysson and Guazzelli2007). In addition, recent experiments show that the transition to sediment transport can be ‘blurred’ by turbulent fluctuations, with the density of grains transported downstream that does not vanish sharply at a well-defined
 $\textit{Sh}_c$
(Salevan et al. Reference Salevan, Clark, Shattuck, O’Hern and Ouellette2017). Instead, a cross-over region is found somewhere below at
 $\textit{Sh}_c \simeq 0.02$
, as also reported by Lajeunesse, Malverti & Charru (Reference Lajeunesse, Malverti and Charru2010).
In the present study, we report experimental measurements of the erosion threshold for a granular bed subjected to an unsteady flow induced by a translating parallel disk in both directions towards and away from the bed. The paper is organised as follows. Section 2 details the experimental apparatus, the varying control dimensional parameters and the dimensionless control parameters, as well as the experimental methods for determining the critical velocity at which the first grains get eroded and the phenomenology of what is observed. Section 3 considers the erosion in the gap between the disk and the granular bed induced by the radial squeezing or suction flow from the approaching or leaving disk, while § 4 characterises the erosion from vortices after the approaching disk motion has stopped. In all cases, we rationalise our experimental findings with the scalings outlined by Steiner et al. (Reference Steiner, Morize, Delbende, Sauret and Gondret2025) for both the radial squeezing/suction flow and the vortex flow. Section 5 summarises the main findings and outlines remaining questions.
2. Experimental methods
2.1. Experimental set-up
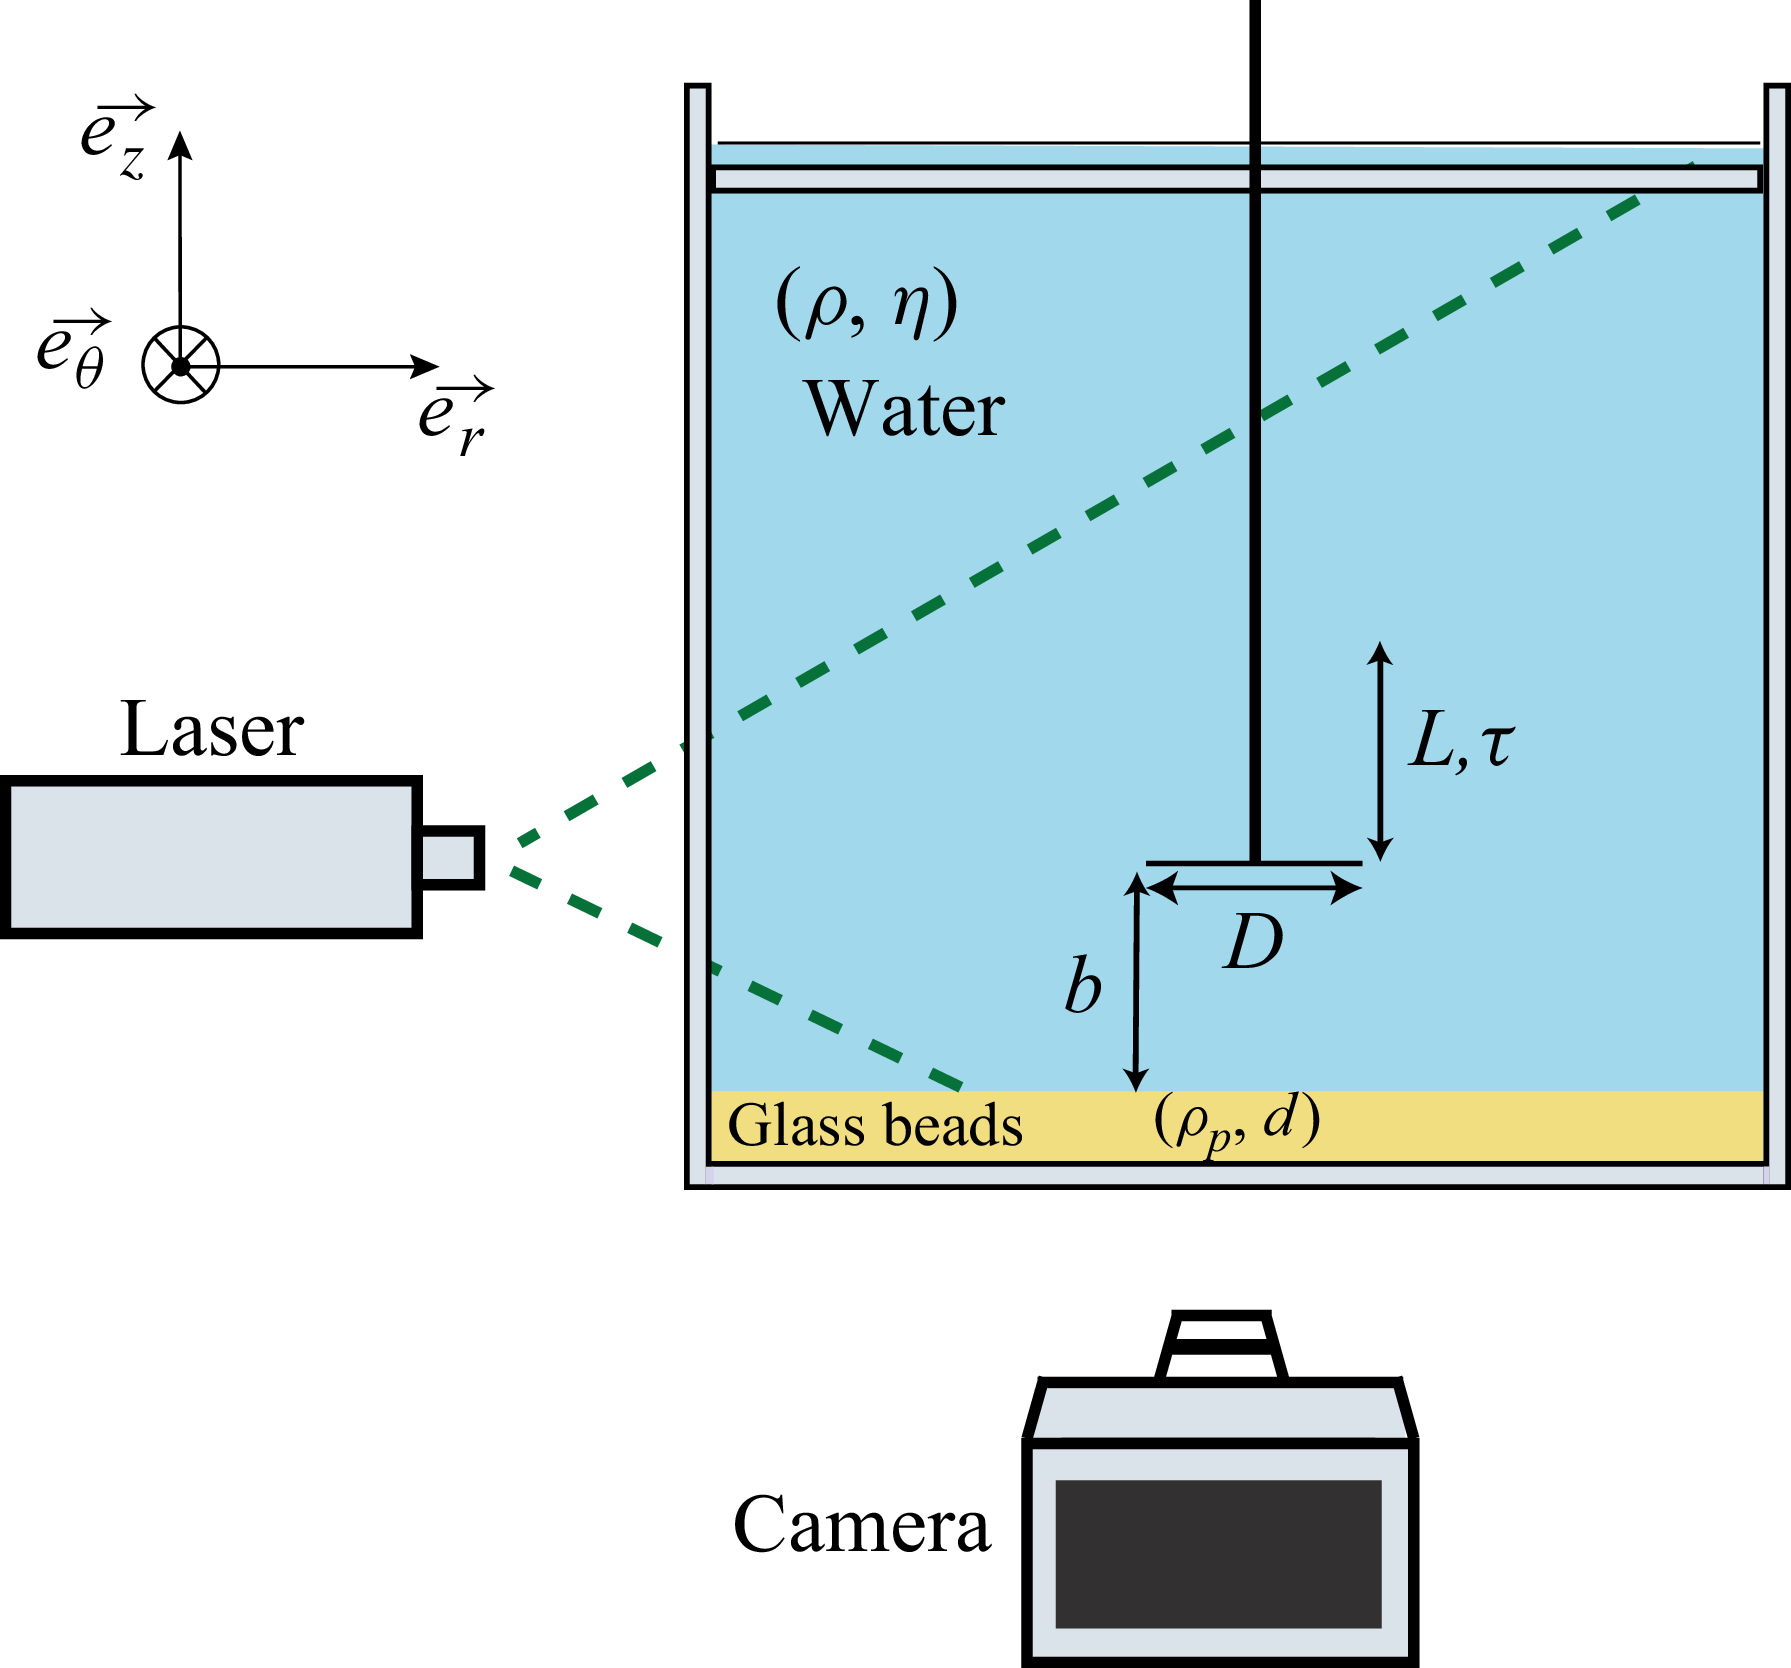
A schematic of the experimental set-up is shown in figure 1. This set-up has been used in previous studies of fluid flows around a translating disk (Steiner et al. Reference Steiner, Morize, Delbende, Sauret and Gondret2023, Reference Steiner, Morize, Delbende, Sauret and Gondret2025). In summary, the experiments were performed in a square glass tank (side
 $40\,\textrm {cm}$
and height
 $60\,\textrm {cm}$
) with the water level set to
 $40\;\mathrm{cm}$
. A transparent acrylic lid was placed a few millimetres beneath the free surface to suppress surface waves. At the bottom, a
 $1\,\textrm {cm}$
thick, horizontally levelled bed of glass beads (mean diameter
 $d\simeq 250 \pm 50\,{\unicode{x03BC}} \textrm {m}$
, density
 $\rho _{p}=2500\,{\textrm {kg}\,\textrm {m}^{-3}}$
) was prepared. Before each erosion experiment, the surface was smoothed with a straight edge to ensure a repeatable packing and a flat surface. While we do not measure the exact packing fraction for each preparation, we estimated the practical reproducibility of the bed preparation by repeating some threshold measurements under the same control parameters, and the resulting standard deviation of the measured critical velocity of the disk at the onset of erosion is typically 5 %–10 %, which includes the variability due to bed preparation.
Schematic of the experimental set-up: a rigid disk of diameter
 $D$
translates vertically over a stroke
 $L$
in time
 $\tau$
, either descending to the minimum gap
 $b$
or ascending from it.

A circular rigid PVC disk with a diameter
 $D \in [5,\, 15]\,\textrm {cm}$
, small enough compared with the tank dimensions so that lateral wall effects remain negligible and with a small thickness
 $e=2\,\textrm {mm}$
(
 $e/D \leqslant 0.04$
), was attached to a vertical shaft (1 cm diameter) driven by an AC servomotor (ECMA-C20807RS, Delta Electronics). An eccentric cam converts the continuous rotation of the motor into a sinusoidal translation of the vertical shaft. The stroke length
 $L$
has been varied here in the range
 $2\leqslant L \leqslant 5.2\,\textrm {cm}$
, and the minimum distance
 $b$
between the disk and the granular bed in the range
 $0.2 \leqslant b \leqslant 2\,\textrm {cm}$
.
Throughout this study, the motion of the disk is a single translation over the time
 $\tau$
, during which the servomotor performs half a revolution at constant angular velocity
 $\pi /\tau$
, so that the disk accelerates and decelerates sinusoidally. The disk therefore travels the prescribed distance
 $L$
in a time
 $\tau$
and then comes to rest. Introducing the dimensionless time
 $t^{\ast }=t/\tau$
, the prescribed vertical position
 $h$
and velocity
 $V$
of the disk are
 \begin{equation} h(t^{\ast })=b+\frac {L}{2}\!\left [1\mp \cos (\pi t^{\ast })\right ]\!,\quad V(t^{\ast })=\pm V_{m}\sin (\pi t^{\ast }), \quad 0\leqslant t^{\ast }\leqslant 1, \end{equation}
with
 $V_{m}=\pi L /(2\tau )$
the maximum translational velocity at mid-stroke
 $L/2$
and mid-time
 $t^{\ast }=1/2$
. The upper (respectively lower) sign applies when the disk starts from the bottom (respectively top) position.
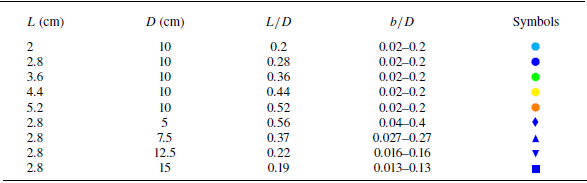
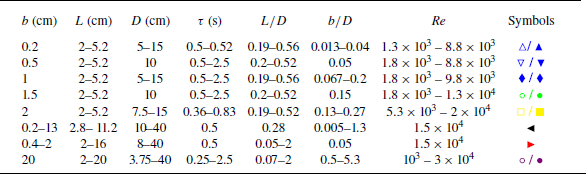
The parameter ranges explored across all experiments are summarised in table 1, along with the corresponding data symbols used in the figures. The first five sets of experiments correspond to the same disk diameter,
 $D = 10$
cm, with different stroke lengths,
 $L$
, and the data will be represented by different-coloured circles. The last four sets of experiments, together with the second set, correspond to different
 $D$
values for the same
 $L = 2.8$
cm, and the data will appear as blue symbols of different shapes.
Ranges of the parameters
 $L$
and
 $D$
explored in the different sets of experiments together with the corresponding symbols used in the figures.

2.2. Control parameters and non-dimensional groups
The problem is fully characterised by the geometric and kinematic parameters
 $(D,\,L,\,b,\,V_{m})$
of the disk motion, the density
 $\rho$
and dynamic viscosity
 $\eta$
of the fluid, and the grain parameters
 $(\rho _{p},d)$
together with the gravitational acceleration
 $g$
. Thus, the six following independent dimensionless parameters can be considered:
 \begin{equation} \textit{Re}_D=\frac {\rho \, V_{m}\,D}{\eta },\quad \frac {L}{D},\quad \frac {b}{D},\quad \frac {\Delta \rho }{\rho },\quad {Ar}=\dfrac {\rho \,\Delta \rho \,g\,d^{3}}{\eta ^{2}},\quad \textit{Sh}=\dfrac {\rho V_{m}^{2}}{\Delta \rho \,g\,d}, \end{equation}
where
 $\Delta \rho = \rho _p - \rho$
is the grain-fluid density difference. In the present study, the density ratio is constant at
 $\Delta \rho / \rho \simeq 1.5$
with
 $\rho =10^3 \,{\textrm {kg}\,\textrm {m}^{-3}}$
the density of water. The Archimedes number
 ${Ar} \simeq 230$
indicates that grain settling occurs in the inertial regime. The remaining dimensionless groups cover the following ranges: with
 $\eta =10^{-3} \,\textrm {Pa s}$
the dynamic viscosity of water, the Reynolds number
 $\textit{Re}_D$
spans
 $10^3 \lesssim \textit{Re}_D\lesssim 10^{5}$
, the relative stroke of the disk lies within
 $0.19 \lesssim L/D \lesssim 0.56$
, the normalised gap
 $b/D$
ranges from 0.013 to 0.4, and the Shields number Sh based on the driving fluid inertial forces varies approximately in the range
 $10^{-2} \lesssim \textit{Sh} \lesssim 10^2$
. The range of
 $\textit{Re}_D$
ensures that the disk-generated vortical flow is mostly in the inertial regime, while the broad variation of
 $b/D$
together with the variation of
 $L/D$
allows us to investigate the respective roles of the different flow features on the erosion threshold.
2.3. Determination of the erosion threshold
Two complementary procedures were used to identify the onset of erosion of the granular bed. First, direct visualisation was employed: for a set of control parameters
 $(L,\,D,\,b)$
, the disk velocity
 $V$
was increased by decreasing the translation time
 $\tau$
. The threshold of erosion corresponds to the critical value
 $\tau _c$
at which the very first grains were observed to be eroded from the bed. The corresponding maximum velocity
 $V_{m}^{\,c}=\pi L/(2\tau _{c})$
is taken as the erosion threshold. Each erosion threshold was measured three times in independent experiments, and the resulting standard deviation of the critical velocity was typically approximately 5 %–10 %.
A second method used relied on laser profilometry: the threshold was defined as the smallest
 $V_{m}$
for which the mean depth change exceeded
 $10\,\%$
of the initial layer thickness. Although the absolute values obtained by the two methods differed slightly, they are consistent for comparative purposes. Erosion thresholds generated by the radial flow before the disk stops (during both approach and retreat) were determined by direct visualisation in §§ 3.1 and 3.2, whereas the laser-profilometry criterion was applied exclusively in § 4 to the vortex-driven erosion that develops after the disk has stopped, whose strongly unsteady and fluctuating nature precludes a reliable threshold from instantaneous images.
Pictures taken at nine successive dimensionless times
 $t^{\ast }=t/\tau$
illustrating the erosion of a granular bed induced by the flow generated when a disk of diameter
 $D = 10\,\textrm {cm}$
translates along the stroke length
 $L = 2.8\,\textrm {cm}$
during the travel time
 $\tau \simeq 0.21\,\textrm {s}$
down to the minimum/final gap distance
 $b = 0.5\,\textrm {cm}$
from the granular bed (
 $V_m = 21$
cm s–1
 $\simeq 2V_m^c$
).

2.4. Phenomenology
Figure 2 presents a time-lapse sequence from an experiment performed well above the erosion threshold, illustrating the two distinct mechanisms by which erosion arises when the disk moves downward.
The first mechanism occurs when erosion takes place while the disk is still moving (
 $t^{\ast }\lt 1$
). As the disk approaches the bed, the fluid trapped beneath is expelled radially. The resulting outward radial flow, confined in the thin gap, shears the grains near the edge of the disk where the velocity is the largest (Steiner et al. Reference Steiner, Morize, Delbende, Sauret and Gondret2025). Here, between
 $t^{\ast } \simeq 0.4$
and
 $t^{\ast } \simeq 1$
, a small ridge forms at
 $r\simeq D/2$
(see Box 1 in figure 2 at
 $t^*=0.84$
) and drifts outward, revealing that only a narrow annulus of grains is eroded while the disk is in motion. At the same instant, the starting vortex is already visible in the wake of the disk, but its core is sufficiently far from the bed for the outward flow beneath the disk to remain predominantly radial and axisymmetric. Therefore, the first erosion threshold is governed by the wall shear generated by this squeezing flow in the gap.
The second mechanism is through vortex-driven erosion after the disk stops (
 $t^{\ast }\gt 1$
). Indeed, once the stroke ends, the starting vortex detaches, flows around the disk and impinges on the bed. The interaction of this vortex with the edge of the disk detaches a counter-rotating stopping vortex. Together, they form a dipole that translates parallel to the surface of the granular bed. In the present example, from
 $t^{\ast }=1.12$
to
 $1.68$
, grains are entrained simultaneously outward by the starting vortex and inward by the stopping vortex, producing the bidirectional transport highlighted in the panels at
 $t^{\ast }=1.40$
and
 $1.68$
. The amount of suspended granular material grows until the vortices weaken, and by
 $t^{\ast }=2.52$
, they can no longer sustain the grains in suspension, which then resettle onto the bed. Because the circumferential velocities in the starting and stopping vortex after the disk stops are comparable and larger than the outward flow velocity before the disk stops, the erosion mechanism by the impact of a vortex ring dipole typically imposes a higher wall stress than the squeezing radial flow. It therefore controls a separate and smaller erosion threshold.
Time lapse showing the erosion of the granular bed produced by the unidirectional upward translation over the stroke length
 $L = 5.2\ \mathrm{cm}$
and time
 $\tau \simeq 0.4\ \mathrm{s}$
of a disk of diameter
 $D = 10\ \mathrm{cm}$
starting from its minimal position
 $b = 0.5\ \mathrm{cm}$
during the first accelerating phase (
 $0 \leqslant t^\ast \leqslant 0.5$
) up to the disk velocity
 $V_m = 20$
cm s−1
 $\simeq 2.5 V_m^c$
.

When the disk moves away from the granular bed, a single erosion mechanism is observed, as the initial vortex ring forms beneath the translating disk and therefore never impinges directly on the bed. The erosion threshold associated with the resulting radial inflow is nevertheless modified compared with the approaching-disk case, as the confined vortex increases both radial inflow and wall shear stress.
A representative experiment is shown in figure 3, where the disk velocity is set well above the critical value
 $V_m^c$
, allowing each stage to be clearly visible during the disk motion (
 $0 \lt t^\ast \lt 1$
). At the very early time
 $t^{*}=0.1$
, a few grains already start to lift off, forming a mound near the granular bed. As time progresses, even more grains are entrained. They move mainly upward and inward, driven by the combined action of the inward radial flow that feeds the widening gap and the starting vortex in the wake of the disk. Because this suction flow is established as soon as the vortex begins to form, erosion is observed very early in the stroke. The deformation of the bed remains almost axisymmetric and relatively shallow compared with the erosion pattern generated when the disk approaches the bed.
In summary, when the disk moves towards the bed, the transient erosion arises first from the shear induced by the outward squeezing flow in the gap and then, if the disk stops sufficiently close to the bed, from the following impact of the starting–stopping vortex pair. When the disk moves away from the granular bed, a single erosion mechanism is observed, due to the radial inward suction flow in the gap, as the initial vortex ring forms beneath the translating disk and therefore never impinges directly on the bed.
In the following, we quantify the different erosion thresholds and describe how they scale with the governing parameters.
3. Erosion from squeezing or suction flow in the disk-bed gap
3.1. Erosion threshold by the radial squeezing flow of a disk moving towards a granular bed
When the disk moves towards the granular bed, the fluid confined in the narrow gap is expelled radially. The associated shear can erode the granular bed before the disk comes to a stop. We quantify here the critical disk velocity
 $V_{m}^{c}$
corresponding to the first onset of erosion and demonstrate how it depends on the control parameters.
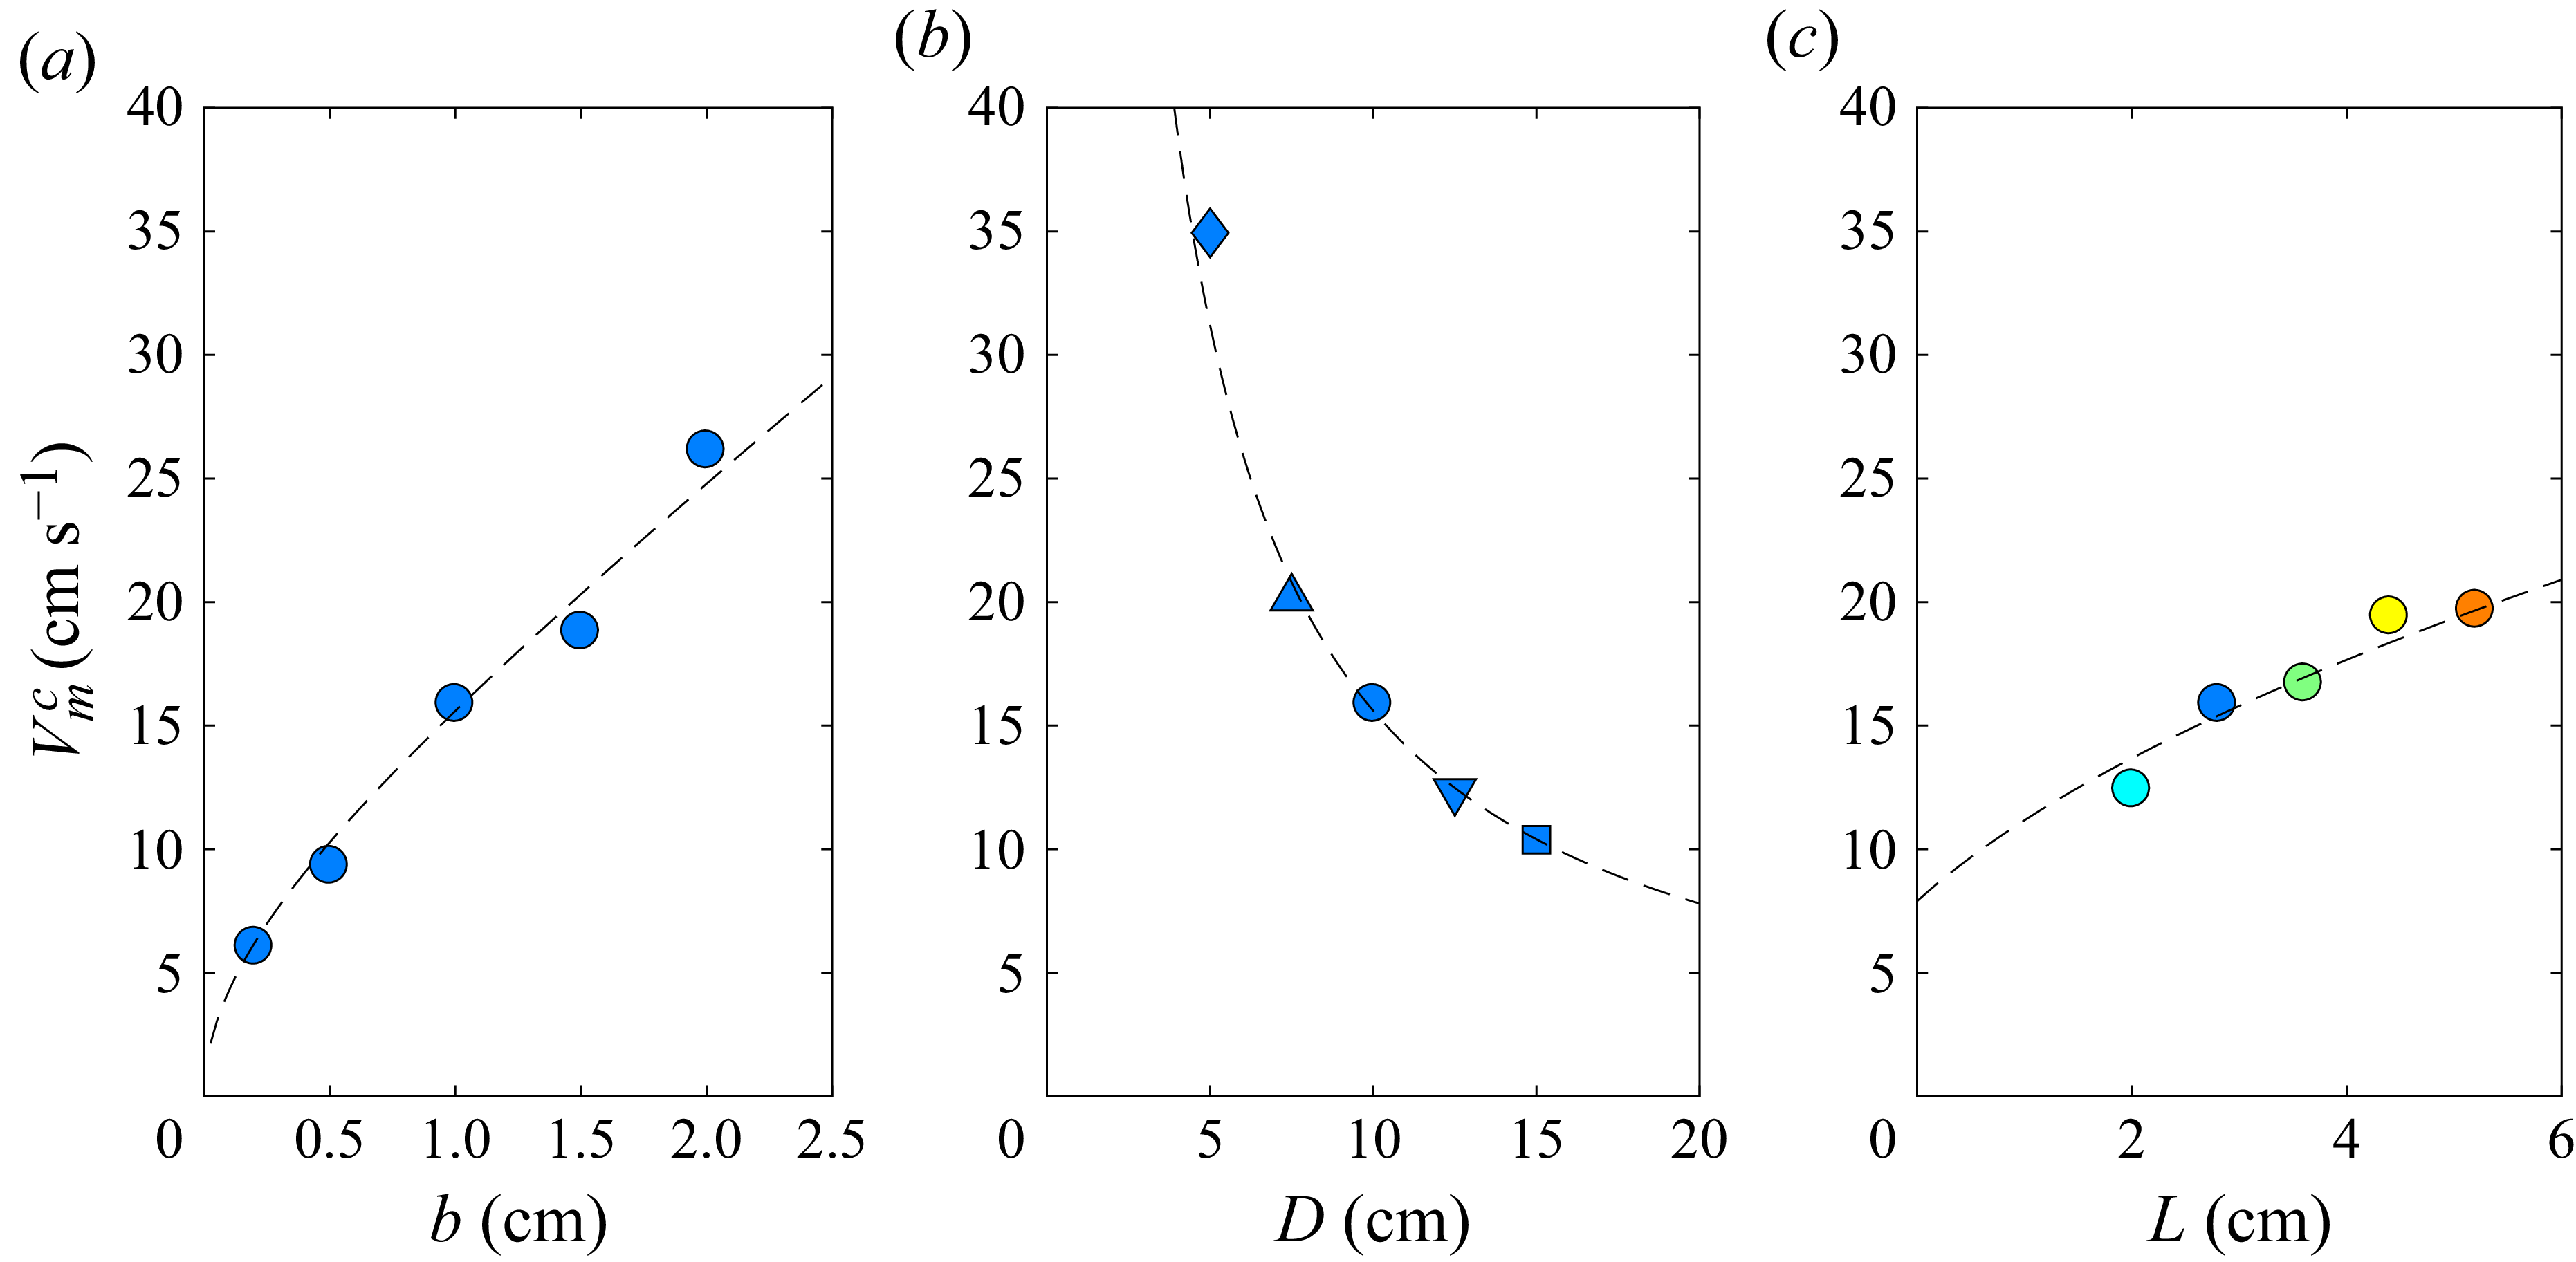
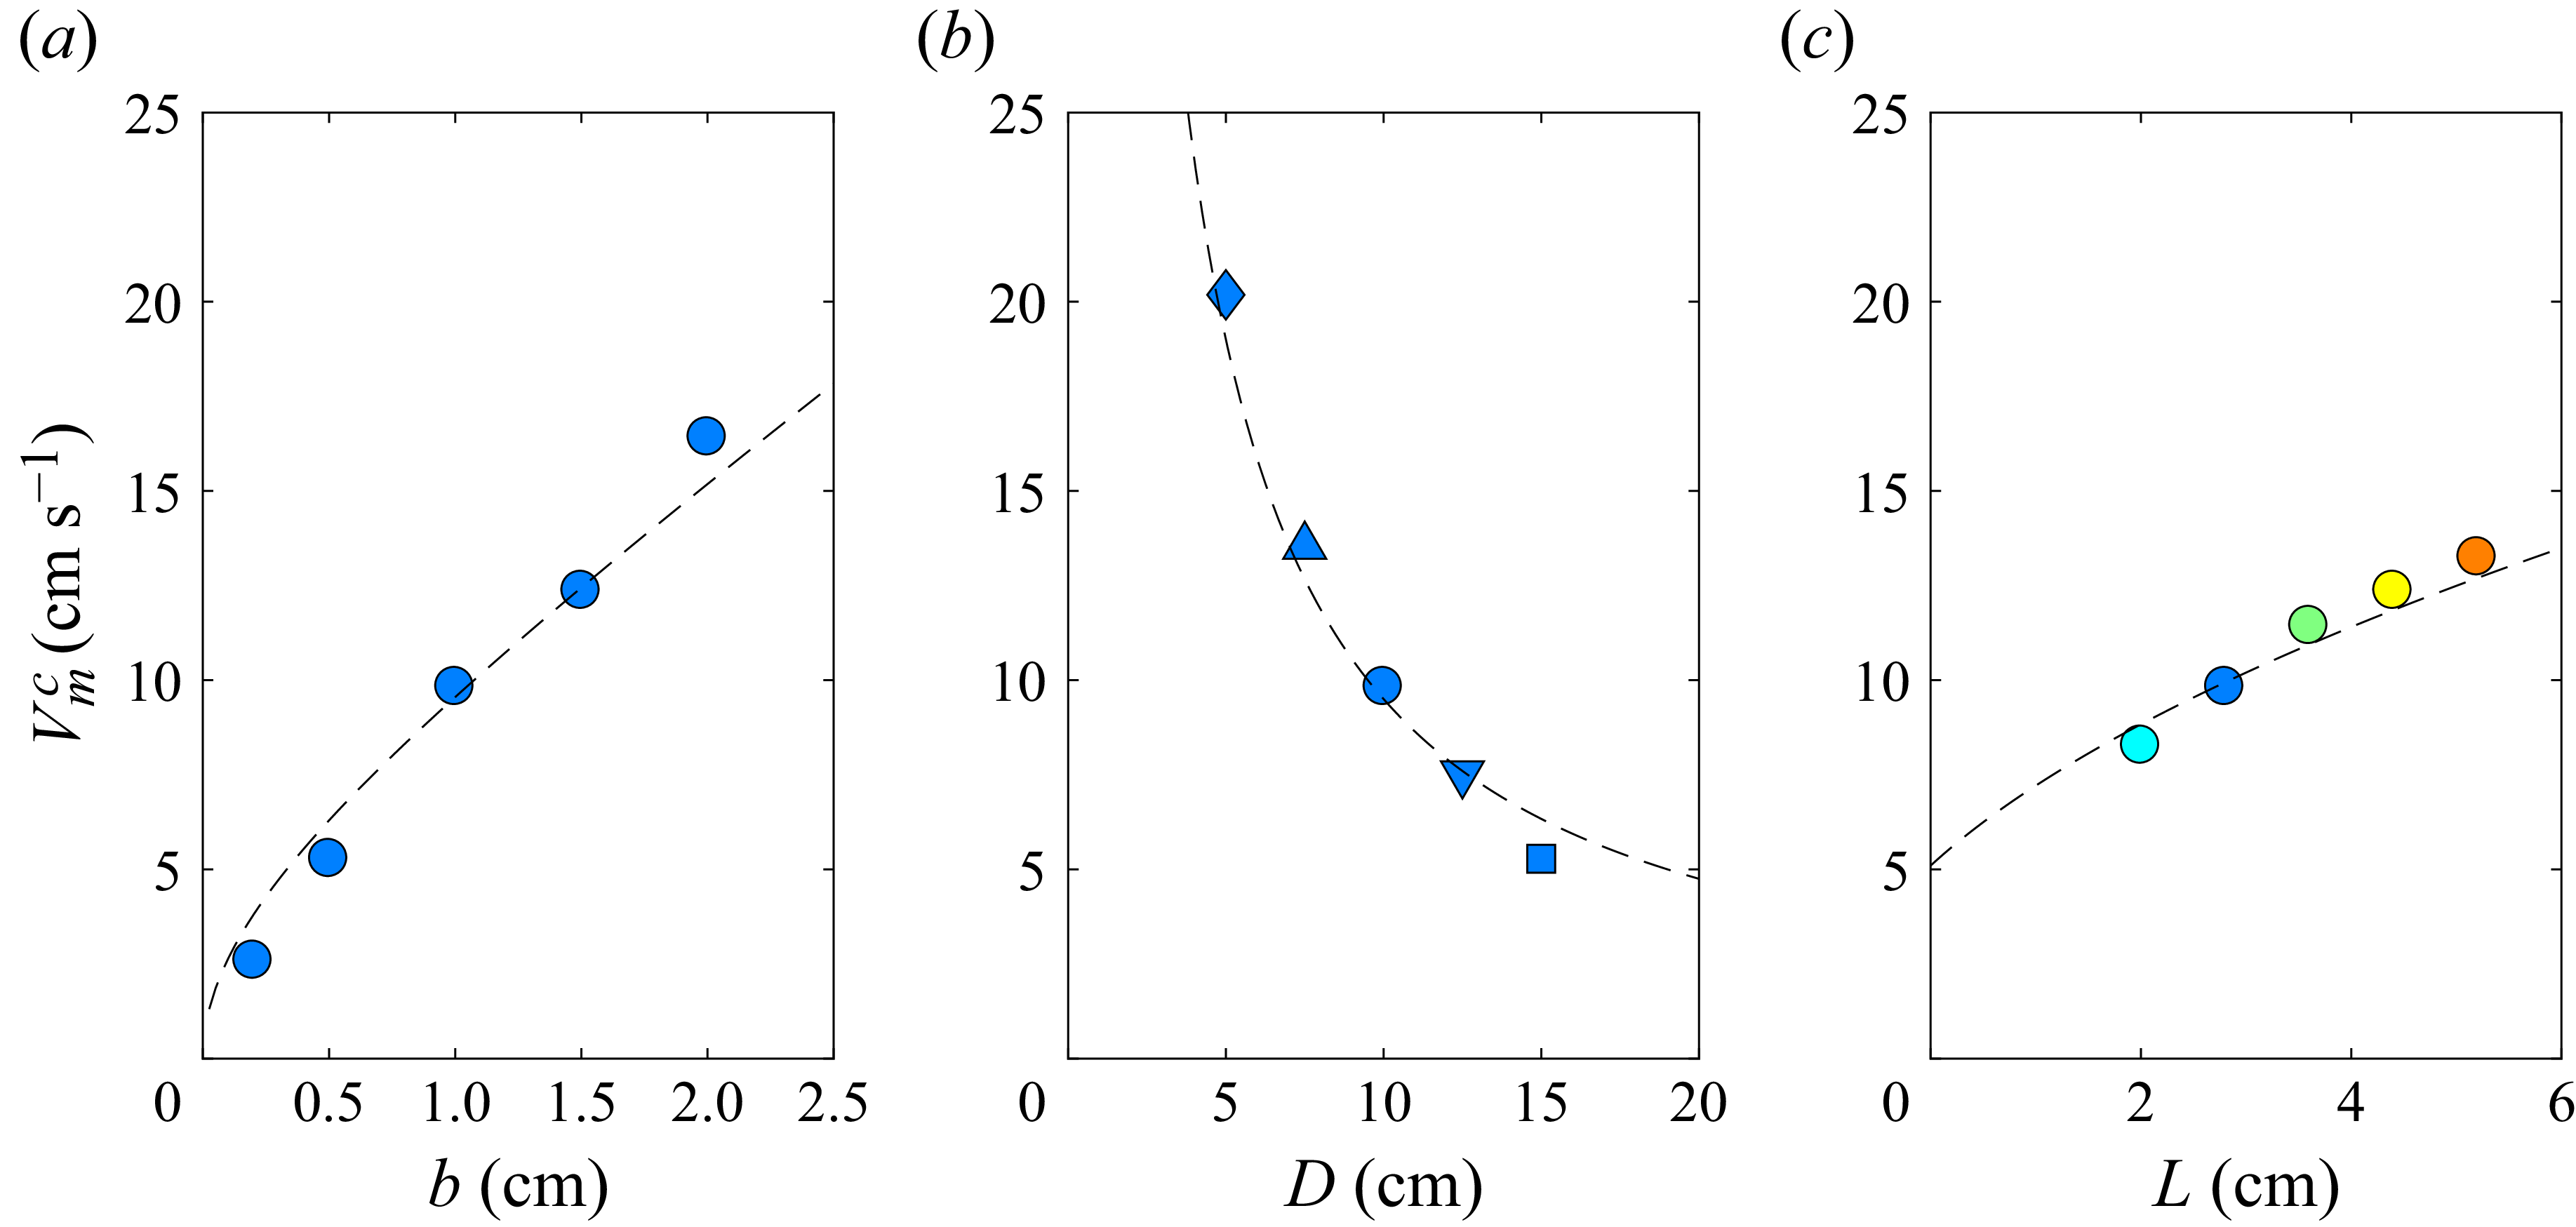
Critical velocity
 $V_m^{c}$
of the approaching disk at the onset of erosion measured before the disk stops (
 $t^{*}\lt 1$
) for a disk translating towards the granular bed as a function of (a) the minimal/final distance from the granular bed
 $b$
for
 $L = 2.8\,\textrm {cm}$
and
 $D =10\,\textrm {cm}$
, (b) the disk diameter
 $D$
for
 $L = 2.8\,\textrm {cm}$
and
 $b = 1\,\textrm {cm}$
, and (c) the stroke length
 $L$
for
 $D = 10\,\textrm {cm}$
and
 $b = 1\,\textrm {cm}$
. Dashed lines are the best fits from (3.1) corresponding in CGS units to (a)
 $V_m^c = 8 b \sqrt {1+2.8/b}$
, (b)
 $V_m^c = 156 / D$
and (c)
 $V_m^c = 7.9 \sqrt {1 + L}$
, so that (a)
 $U_m^c = 19.75$
cm s−1, (b)
 $U_m^c = 20.0$
cm s-1 and (c)
 $U_m^c = 19.75$
cm s-1.

Figure 4(a–c) reports the values of
 $V_{m}^{c}$
obtained by progressively increasing the imposed stroke velocity until a few grains begin to be eroded and transported radially outwards when the parameters
 $b$
,
 $D$
and
 $L$
are varied separately. The critical velocity
 $V_{m}^{c}$
is found to increase with the final gap
 $b$
(figure 4
a), decreases with increasing disk diameter
 $D$
(figure 4
b) and increases with the stroke length
 $L$
(figure 4
c). These trends directly reflect the way the radial flow required to conserve mass in the gap varies with the three parameters. To develop a scaling law using the maximum radial velocity, Steiner et al. (Reference Steiner, Morize, Delbende, Sauret and Gondret2025) assumed that the gap thickness
 $h(t)$
remains small compared with
 $D$
. Then, the incompressibility condition leads to a gap-averaged radial velocity profile
 $U$
that is maximum at
 $r=D/2$
. The maximum value over time is
 $U_{m}=V_{m} (D/4b ) (1+L/b )^{-1/2}$
, where
 $V_{m}$
is the maximum disk velocity during the translation of the disk. The shear at the granular bed required for erosion is directly related to the radial flow and thus to
 $U_{m}$
. Assuming that the critical value
 $U_{m}^{c}$
for the gap-averaged radial velocity should remain constant for a given size and density of grains, the critical disk velocity
 $V_{m}^{c}$
can be written as
 \begin{equation} V_{m}^{c}=U_{m}^{c}\,\frac {4b}{D}\,\sqrt {1+\frac {L}{b}}. \end{equation}
Dashed lines in figure 4 show the
 $V_m^{c}(b,D,L)$
best fits of the data from (3.1) that give very close fitting values for
 $U_m^{c}$
. The very good fit of the data for the corresponding set of parameters, shown in figure 4, suggests that the measured erosion thresholds should obey this relationship.
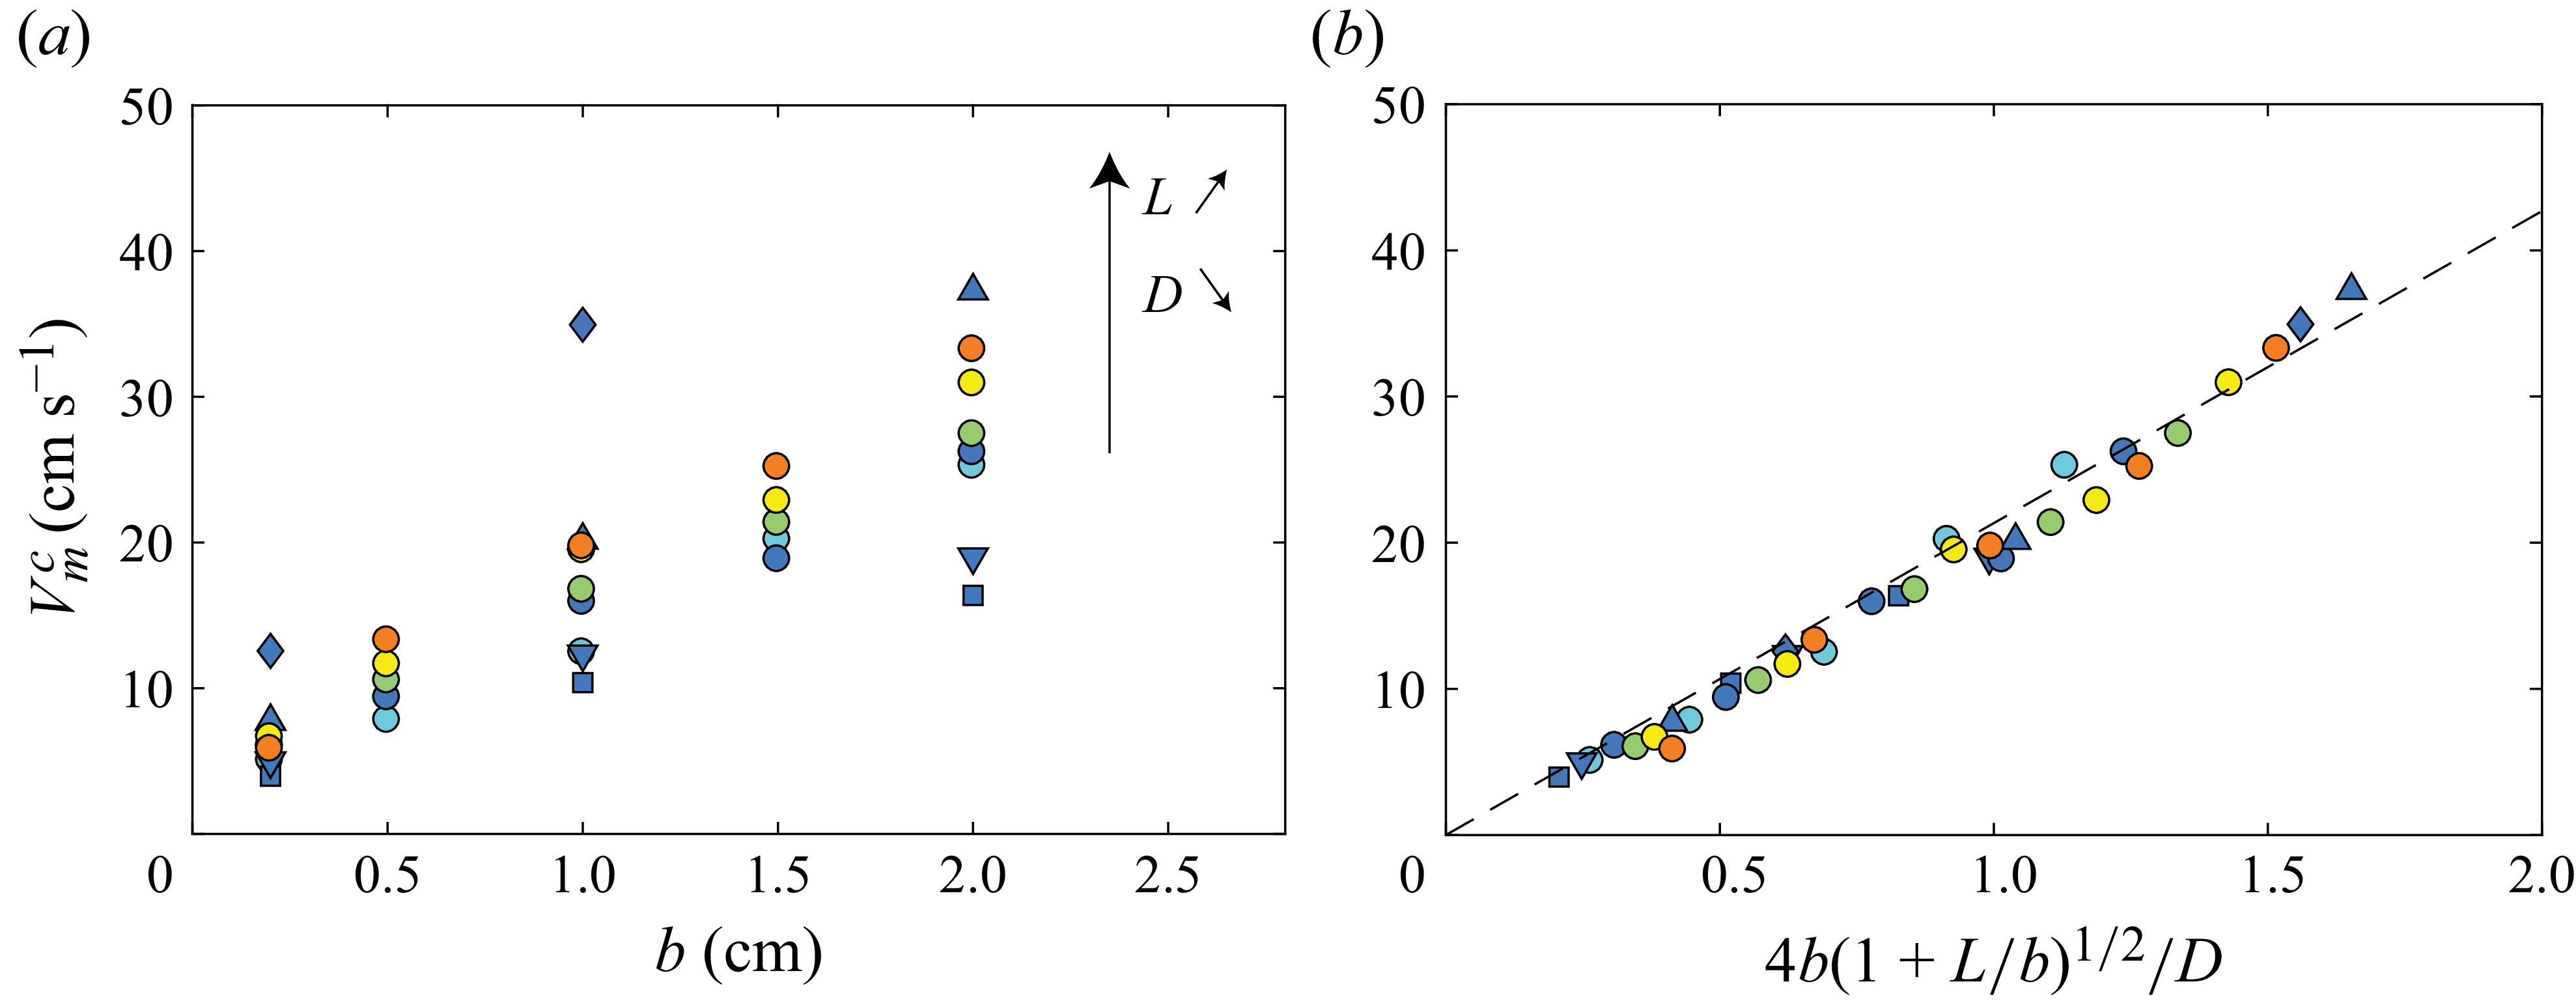
Critical velocity of the approaching disk at the onset of erosion by the radial outflow before the disk stops (
 $t^*\lt 1$
),
 $V^{c}_{m}$
, as a function of (a) the minimum distance
 $b$
and (b) the parameter
 $4b\sqrt {1+L/b}/D$
. The dashed line corresponds to the best fit of the data by (3.1) with
 $U_{m}^{c}=21.3\,{\textrm {cm}\,\textrm {s}^{-1}}$
.

The critical disk velocity
 $V_m^{c}$
required to dislodge the very first grains for all stroke lengths
 $L$
, disk diameters
 $D$
and final gaps
 $b$
explored here with the colour code given in table 1 is shown in figure 5(a). The observed global trend again shows that
 $V_m^{c}$
increases with
 $b$
, indicating that a wider gap weakens the outward radial flow and requires a faster stroke for the shear at the granular bed to reach the erosion threshold. To account for the combined influence of
 $L$
,
 $D$
and
 $b$
on the measured thresholds, the critical disk velocity
 $V_m^{c}$
is now plotted as a function of
 $4b\sqrt {1+L/b}/D$
in figure 5(b). All data collapse remarkably well onto a linear master curve as predicted from (3.1) with the fitted value
 $U_m^{\,c}=(21.3 \pm 2.2) \, {\mathrm{cm}\,\textrm {s}^{-1}}$
. Thus, figure 5(b) demonstrates that the first erosion mode – driven solely by the outward squeezing flow before the disk stops – is fully captured by this gap-averaged kinematic model.
While the collapse in figure 5(b) shows that the gap kinematics predicts the erosion threshold through the maximum gap-averaged velocity
 $U_m$
, this velocity is not the standard quantity used to characterise sediment mobilisation. To connect with the sediment-transport literature, and to compare the approaching and leaving cases on the same basis, we next seek an estimate of the near-bed shear associated with the squeezing flow. Since the onset of particle motion is known to be sensitive to the structure of the near-wall region and to velocity fluctuations (Quibeuf, Charru & Lacaze Reference Quibeuf, Charru and Lacaze2020), we examine the smooth-wall DNS of Steiner et al. (Reference Steiner, Morize, Delbende, Sauret and Gondret2025) to characterise the velocity field near the wall. Figure 6(a) shows the vertical profile of the radial velocity
 $u(z)$
across the gap
 $h$
at the disk rim
 $r=D/2$
and at the dimensionless time
 $t^\ast =0.76$
, where and when
 $U_m$
reaches its maximum. The profile exhibits a nearly uniform core flow together with strong velocity gradients confined to thin regions adjacent to the disk and to the wall. This is expected as the corresponding gap Reynolds number,
 $\textit{Re}_b=\rho U_m b/\eta$
, is much larger than unity, in the range
 $4\times 10^2 \lesssim \textit{Re}_b \lesssim 4\times 10^3$
at the erosion threshold.
(a) Velocity profile
 $u(z)$
across the gap between the approaching disk (
 $z = h$
) and the wall (
 $z = 0$
), sampled at the disk edge (
 $r=D/2$
) at the dimensionless time
 $t^{\ast }=0.76$
where and when the fluid velocity
 $U_m^c$
is maximum, for
 $L = 2.8\,\text{cm}$
,
 $D = 10\,\text{cm}$
,
 $b = 0.5\,\text{cm}$
and
 $\tau = 1.25\,\text{s}$
(Re
 $\simeq 3.5 \times 10^3$
). The data (
 ) are obtained from the numerical simulations of Steiner et al. (Reference Steiner, Morize, Delbende, Sauret and Gondret2025). The shaded region corresponds to the location of the disk. The solid line is
 $u = 73.1 z$
corresponding to
 $u_{\tau } = 8.5$
mm s−1 and
 $\delta _{v}= 1.2 \times 10^{-4}$
m. (b) Corresponding dimensionless velocity profile in wall units
 $u^+ = u/u_{\tau }$
as a function of
 $z^+ = z/\delta _{v}$
. The solid line is
 $u^+ = z^+$
.

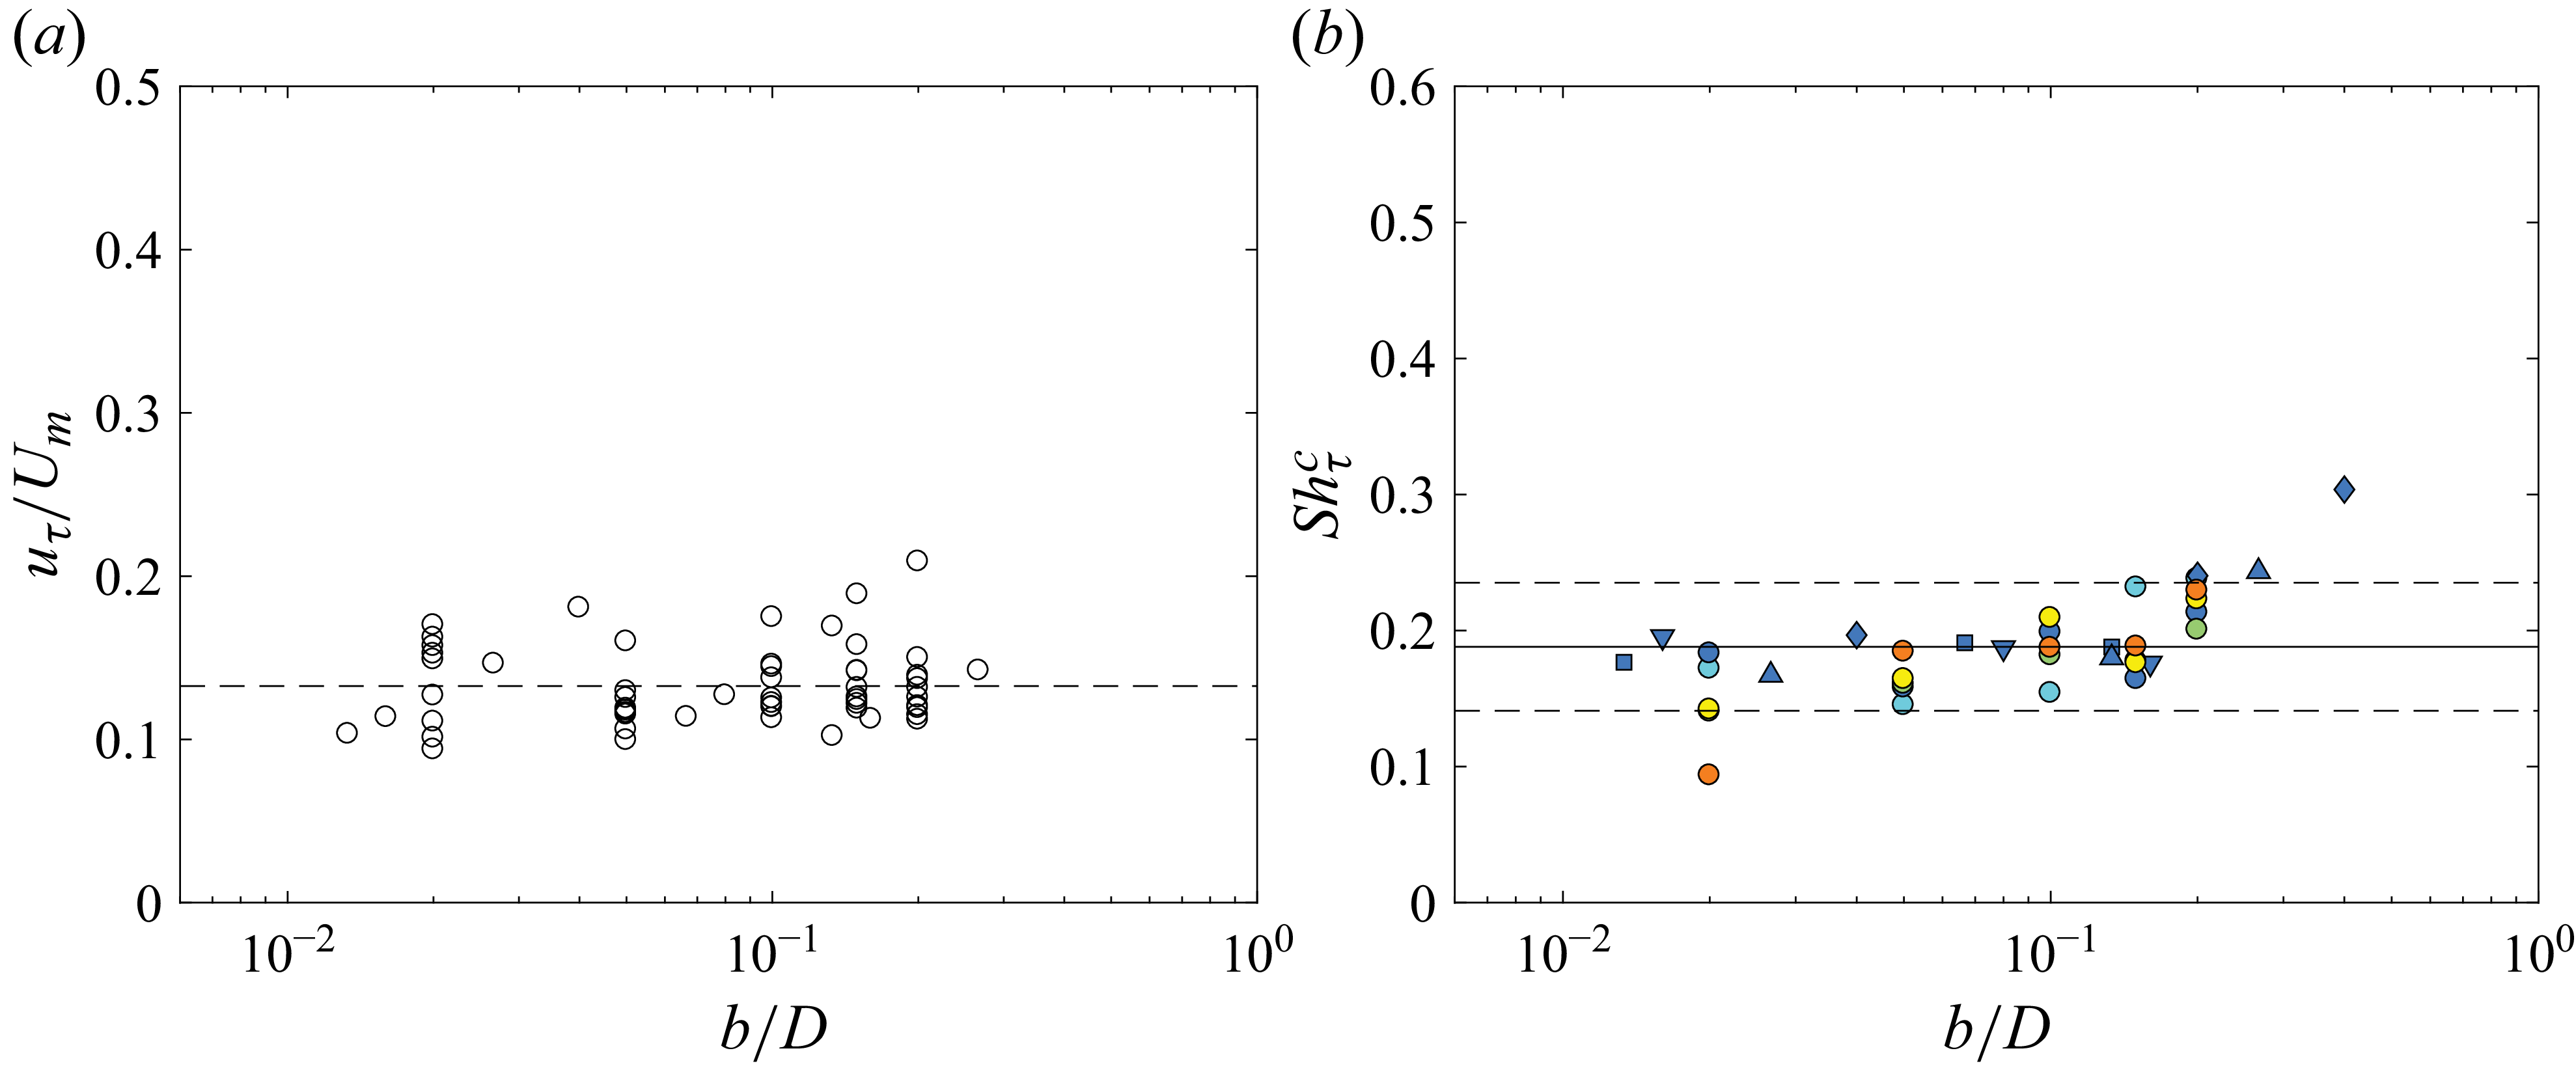
(a) Velocity ratio
 $u_\tau /U_m$
as a function of the dimensionless gap
 $b/D$
, obtained from the numerical simulations of Steiner et al. (Reference Steiner, Morize, Delbende, Sauret and Gondret2025). The horizontal dashed line corresponds to the mean value
 $u_\tau /U_m \simeq 0.133$
. (b) Friction-based Shields number
 $\textit{Sh}^c_{\tau }$
defined from the friction velocity
 $u_{\tau }$
at the erosion threshold plotted as a function of
 $b/D$
. The solid line marks the mean value
 $ \textit{Sh}_{\tau }^{c}\simeq 0.19$
, while the dashed lines indicate a
 $\pm 25\,\%$
deviation from this mean.

In that reference configuration, the wall shear stress is unambiguously defined from the local velocity gradient at the wall,
 $\tau _{w}=\eta (\partial u/\partial z)_{z=0}$
, from which we compute the friction velocity
 $u_{\tau }=(\tau _{w}/\rho )^{1/2}$
. For the case shown in figure 6, this gives
 $u_{\tau }=8.5\,\mathrm{mm\,s^{-1}}$
and a viscous length
 $\delta _{v}=\nu /u_{\tau }=0.12\,\mathrm{mm}$
, so that
 $\delta _{v}/d \simeq 0.5$
. The profile plotted in figure 6(b) further shows a linear variation of
 $u^{+}$
with
 $z^{+}$
close to the wall, which is consistent with the presence of a viscous near-wall region in the DNS.
The friction velocity
 $u_{\tau }$
is compared with the vertically averaged gap velocity
 $U_m$
for all relative disk–wall gaps
 $b/D$
in figure 7(a). The ratio
 $u_{\tau }/U_m$
remains approximately constant, with a mean value
 $0.13 \pm 0.04$
, which provides a practical conversion between the gap-averaged velocity and the corresponding smooth-wall estimate of the near-bed shear. Since the onset of particle motion is known to be sensitive to the structure of the near-wall region and to velocity fluctuations (Quibeuf et al. Reference Quibeuf, Charru and Lacaze2020), we use
 $u_{\tau }$
here as a smooth-wall estimate of the near-bed shear associated with the radial squeezing flow. On this basis, we define a friction-based Shields number
 \begin{equation} \textit{Sh}_{\tau }=\frac {\rho {u_\tau }^{2}}{\Delta \rho g d}. \end{equation}
Using the approximately constant ratio
 $u_{\tau }/U_m$
obtained from the smooth-wall DNS, the corresponding critical values
 $\textit{Sh}_{\tau }^{c}$
remain nearly constant around
 $0.19 \pm 0.05$
over the explored range of
 $b/D$
, as shown in figure 7(b). This value may be interpreted as an effective threshold for the present transient and spatially non-uniform configuration. For reference, it is of the same order as critical Shields numbers reported for steady homogeneous flows by Loiseleux et al. (Reference Loiseleux, Gondret, Rabaud and Doppler2005) and Ouriemi et al. (Reference Ouriemi, Aussillous, Medale, Peysson and Guazzelli2007), but such a comparison is only qualitative since the present threshold is inferred from smooth-wall DNS and not measured directly over a granular rough bed. This comparison with the classical Shields curve should thus be treated with care. Here, the forcing is transient, spatially non-uniform and strongly unsteady. As a result, the threshold may depend not only on the peak stress, but also on the duration over which it remains, which makes direct comparisons with steady Shields data difficult. These points can likely explain why the values of
 $\textit{Sh}_\tau ^c$
of order
 $0.1$
–
 $0.2$
are slightly higher than in the classical situation.
In summary, the erosion driven by the radial squeezing flow is set by the critical gap-averaged radial velocity
 $U_{m}^{c}\simeq 21\,$
cm s
 $^{-1}$
corresponding to the critical friction velocity
 $u_\tau ^{c} \simeq 2.8\,$
cm s
 $^{-1}$
for the present glass beads. Introducing the Shields numbers based on the radial squeeze velocity
 $U_{m}^{c}$
and on the friction velocity
 $u_\tau ^{c}$
respectively as
 \begin{equation} \textit{Sh}_{\textit{SQ}}^{c}=\frac {\rho \,{U_{m}^{c}}^2}{\Delta \rho \,g\,d} \quad \textrm {and} \quad \textit{Sh}_{\tau _{\textit{SQ}}}^c= \frac {\rho \,{u_\tau ^{c}}^2}{\Delta \rho \,g\,d}, \end{equation}
we obtain the critical values
 $\textit{Sh}_{\textit{SQ}}^{c} \simeq 11$
and
 $ \textit{Sh}_{\tau _{\textit{SQ}}}^c \simeq 0.19$
. These results provide a reliable predictive criterion for design situations where rapid gap compression mobilises sediment.
Critical disk velocity at the onset of erosion,
 $V_m^{c}$
, for a disk starting from its lower position as a function of (a) the minimum distance to the granular bed,
 $b$
(
 $L = 2.8\ \mathrm{cm}$
,
 $D = 10\ \mathrm{cm}$
), (b) the disk diameter,
 $D$
(
 $L = 2.8\ \mathrm{cm}$
,
 $b=1\ \mathrm{cm}$
) and (c) the stroke length,
 $L$
(
 $D = 10\ \mathrm{cm}$
,
 $b=1\ \mathrm{cm}$
). Dashed lines are best fits from (3.1) corresponding in CGS units to (a)
 $V_m^c = 4.9 b \sqrt {1+2.8/b}$
, (b)
 $V_m^c = 97 / D$
and (c)
 $V_m^c = 5.1 \sqrt {1 + L}$
, so that (a)
 $U_m^c = 12.25\ \mathrm{cm\,s^{-1}}$
, (b)
 $U_m^c = 12.44\ \mathrm{cm\,s^{-1}}$
and (c)
 $U_m^c = 12.75\ \mathrm{cm\,s^{-1}}$
.

3.2. Erosion threshold by the radial suction flow of a disk moving away from a granular bed
The measured disk velocity
 $V_m^{c}$
for the onset of erosion for a disk that starts from its lower position
 $b$
and therefore moves away from the granular bed is reported in figure 8(a–c) when each parameter
 $b$
,
 $D$
or
 $L$
is varied separately. We observe that
 $V_m^{\,c}$
: (i) increases with the minimum gap distance
 $b$
(figure 8
a); (ii) decreases with increasing disk diameter
 $D$
(figure 8
b); and (iii) increases with the stroke length
 $L$
(figure 8
c). These trends are similar to those obtained when the disk moves towards the bed, yet the absolute values are systematically lower, showing that erosion is more easily triggered when the disk moves away from the granular bed, which may be due to the vortex formation within the gap during the disk motion that contributes to erosion. Dashed lines in figure 8 show the best fits of the data using (3.1). Indeed, the same analysis performed for the squeezing flow, where the disk moves towards the granular bed, can also be applied to the present case of suction flow, where the disk moves away from the granular bed (Steiner et al. Reference Steiner, Morize, Delbende, Sauret and Gondret2025). The good fit of the data with close-fitting values for
 $U_m^{c}$
for the corresponding set of parameters suggests that the measured erosion thresholds should obey this relationship.
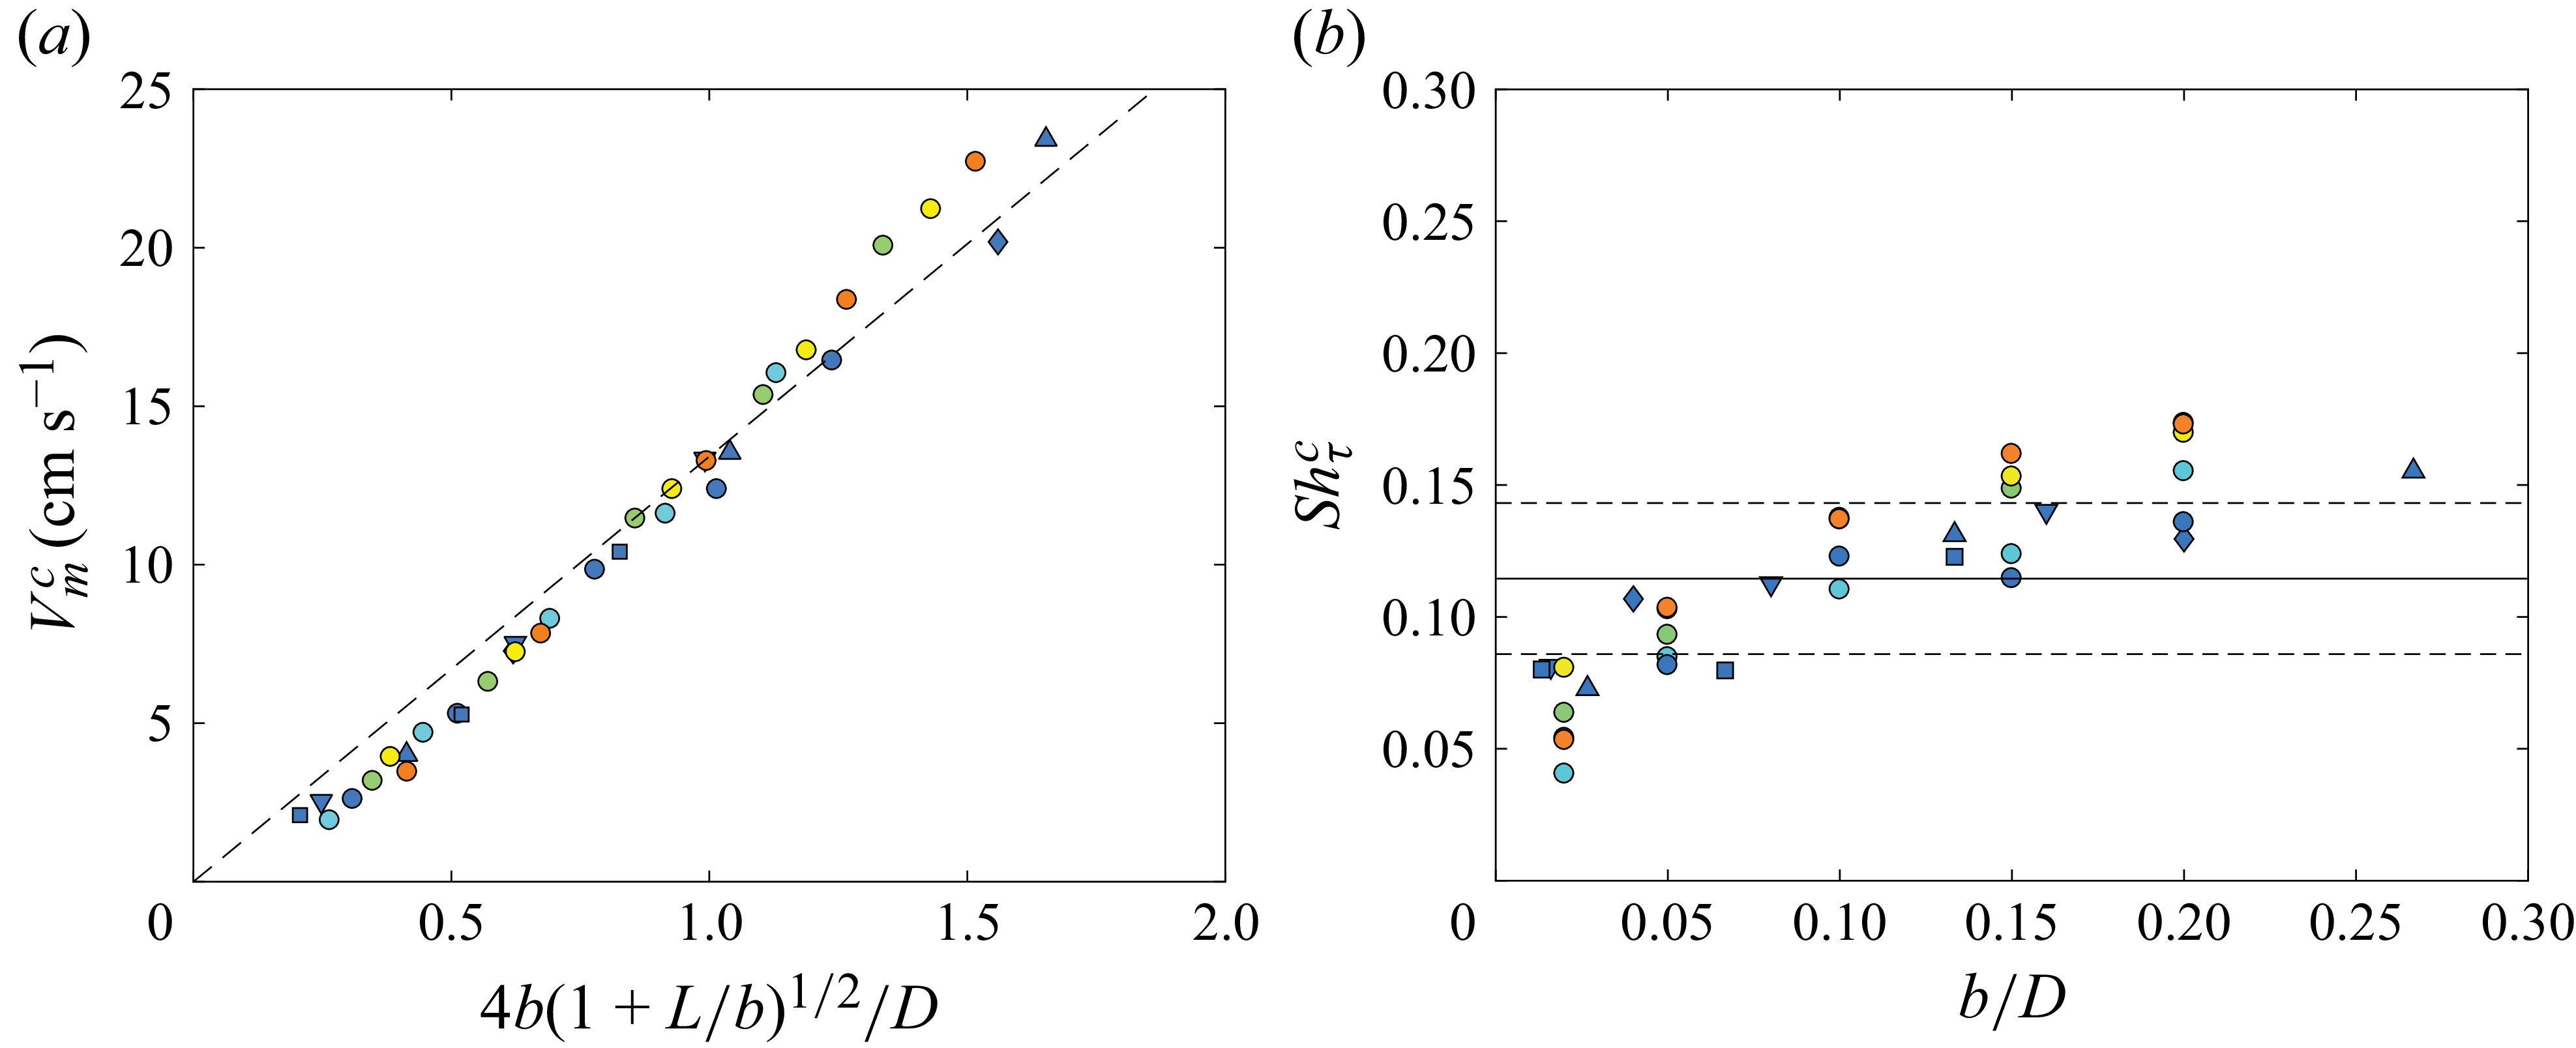
(a) Critical disk velocity at the onset of erosion,
 $V_m^{c}$
, as a function of
 $4b(1 + L/b)^{1/2}/D$
for a disk moving away from the granular bed. The dashed line corresponds to the best fit by (3.1) with
 $U_m^{c} = 13.4\ \mathrm{cm\,s^{-1}}$
. (b) Friction-based Shields number,
 $\textit{Sh}^{c}_{\tau }$
, as a function of
 $b/D$
. The solid line is the average value
 $\overline {\textit{Sh}^{c}_{\tau }} \simeq 0.12$
, while the dotted lines delimit this mean by
 $\pm 25\,\%$
.

To test if the erosion threshold is only due to the radial suction flow, the measured disk velocity
 $V_m^c$
at threshold is plotted in figure 9(a) against the theoretical gap-averaged maximum velocity given by (3.1) for all our data. All the data collapse rather well onto a master curve that is close to a linear law with a slope corresponding to
 $U_m^{\,c}=(13.4 \pm 1.4) \, \mathrm{cm\,s^{-1}}$
, which is indeed significantly smaller than the value
 $U_m^{\,c}=(21.3 \pm 2.2) \, \mathrm{cm\,s^{-1}}$
found in the case where the disk moves towards the granular bed. As in the previous squeeze case, the characteristic Reynolds number for the gap flow is again much larger than one, in the range
 $2 \times 10^2 \lesssim \textit{Re}_b \lesssim 2 \times 10^3$
at the erosion threshold, so that we anticipate some possible differences in the velocity profile of the gap flow for the two cases where the disk approaches or moves away from the granular bed, and thus in the onset of erosion.
Following the same procedure as already presented, the friction velocity
 $u_{\tau }$
in the viscous sublayer is also extracted from the DNS of Steiner et al. (Reference Steiner, Morize, Delbende, Sauret and Gondret2025). Across the full range of disk–wall separations explored, the ratio of this friction velocity to the gap-averaged velocity remains essentially constant with the value
 $u_{\tau }/ U_{m} \simeq 0.17 \pm 0.04$
, which is a little larger than the value
 $u_{\tau }/ U_{m} \simeq 0.13 \pm 0.04$
found in the case where the disk moves towards the wall. The particle Reynolds number
 $\textit{Re}_p=u_\tau d/\nu$
is always larger than unity over the range explored. Using
 $u_\tau$
as a smooth-wall estimate of the near-bed shear, we again define a friction-based Shields number as
 $\textit{Sh}_\tau =(\rho u_\tau ^2)/(\Delta \rho \, g\, d).$
The corresponding critical value
 $\textit{Sh}^{\,c}_{\tau }$
for bed erosion threshold is plotted as a function of the relative minimum distance of the disk to the granular bed
 $b/D$
in figure 9(b). The mean value for this critical Shields number is
 $\overline {\textit{Sh}^{\,c}_{\tau }}\simeq 0.12 \pm 0.02$
. When compared with the case where the disk moves towards the granular bed, this mean value is significantly smaller and there is also a significant trend of smaller
 $\textit{Sh}^{\,c}_{\tau }$
for smaller
 $b/D,$
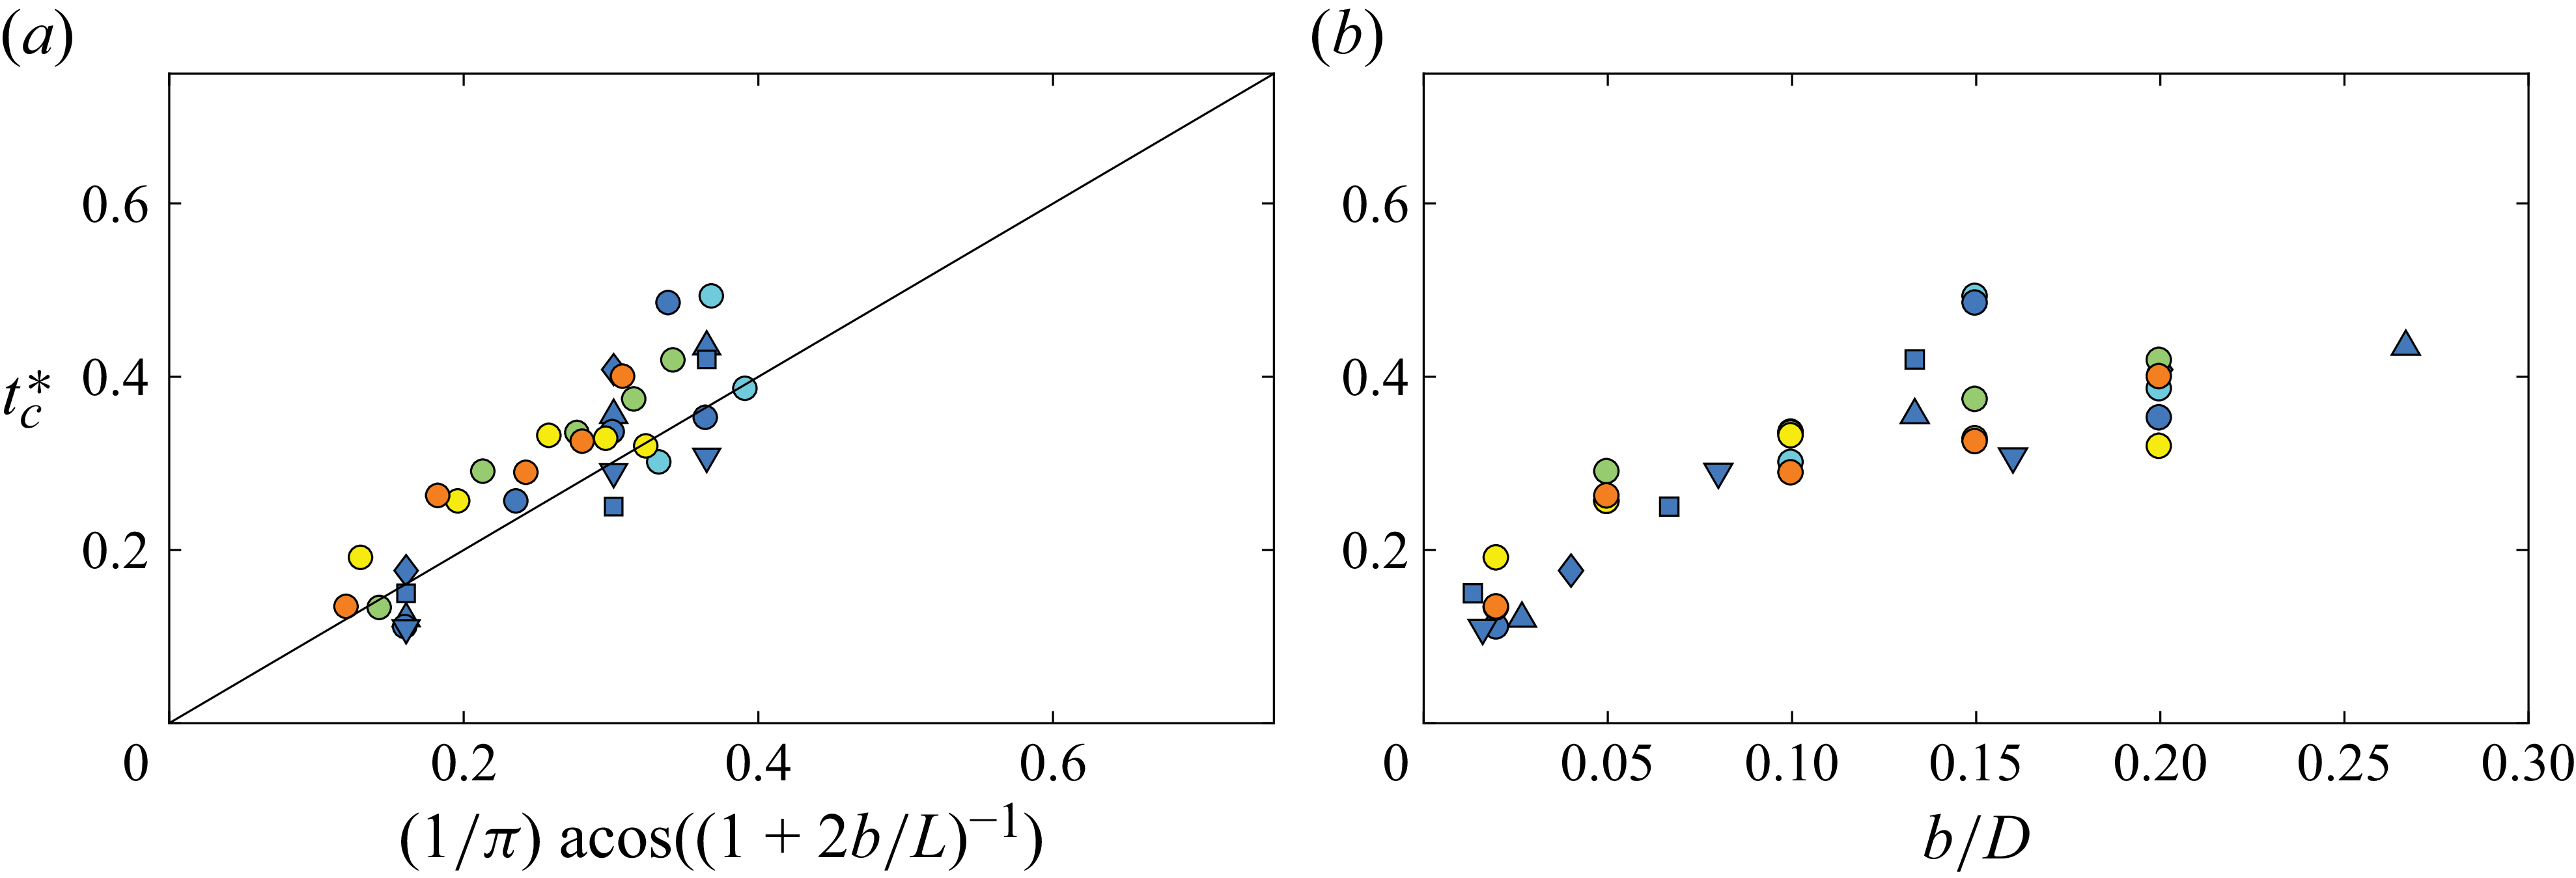
which can be observed despite the scattering of the data. This likely reflects that the model neglects the influence of the vortex on the gap-driven inward radial flow. This interpretation is also consistent with the onset times reported in figure 10: when the disk moves away from the bed, erosion can start early in the stroke (
 $t_c^*\lt 0.5$
), i.e. before the disk reaches its maximum velocity. In that situation, a purely gap-driven estimate based on the peak
 $U_m$
may under-represent the instantaneous near-bed forcing at
 $t_c^*$
because the developing vortex within the gap contributes to the shear. In addition, figure 10(b) shows that the onset time of erosion increases significantly with
 $b/D$
. This supports the hypothesis that the vortex contribution depends on the instant when erosion begins: the vortex will be more or less developed and more or less distant from the granular bed.
Dimensionless time
 $t_c^\ast$
at which the first grains begin to move at the erosion threshold, with the disk released from its lower position, as a function of (a) the dimensionless time
 $t_m^\ast =(1/\pi )\textrm {acos}{(1+2b/L)^{-1}}$
at which the maximum gap-averaged radial velocity
 $U_m$
is predicted to occur by Steiner et al. (Reference Steiner, Morize, Delbende, Sauret and Gondret2025), and as a function of (b) the normalized gap
 $b/D$
. The solid line corresponds to
 $t_c^\ast = t_m^\ast$
.

Figures 9(b) and 10(b) show that both the critical Shields number
 $\textit{Sh}^{\,c}_{\tau }$
and the critical time
 $t_{\mathrm{c}}^{\ast }$
for erosion increase with
 $b/D$
. Indeed, at small gaps (
 $b/D\lesssim 0.2$
), the vortex core lies only a few grain diameters above the bed and the circumferential velocity, which decays as
 $1/r'$
, increases the gap–driven inflow, so grains lift off almost instantly. As the gap widens, the core moves away and its contribution to the near-wall shear decays roughly as
 $1/b$
. A larger purely gap-driven inflow is therefore needed to reach the same bed stress, which delays erosion (larger
 $t_{{c}}^{\ast }$
) and raises the value of the critical Shields number
 $\textit{Sh}^{c}_{\tau }\propto {U_{m}^c}^{2}$
.
In summary, when the disk moves away from the granular bed, the erosion is triggered during the first accelerating phase of the disk motion by the radial inflow generated between the disk and the granular surface, which is reinforced by the starting vortex ring. The threshold velocity follows the same scaling law of (3.1) as in the approaching-disk case, but with a smaller prefactor. Indeed, the erosion driven by the radial suction flow is set by the critical gap-averaged radial velocity
 $U_{m}^{c}\simeq 13\,$
cm s
 $^{-1}$
, which is
 $40\,\%$
smaller than the critical value
 $U_{m}^{c}\simeq 21\,$
cm s
 $^{-1}$
found in the approaching case. However, due to a larger
 $u_\tau /U_m$
ratio than in the approaching case, the critical friction velocity is
 $u_\tau ^{c} \simeq 2.3\,$
cm s
 $^{-1}$
, only
 $20\,\%$
smaller than the critical value
 $u_\tau ^{c} \simeq 2.8\,$
cm s
 $^{-1}$
found in the approaching case. Considering the Shields numbers based on the radial suction velocity
 $U_m^c$
and on the friction velocity
 $u_\tau ^c$
respectively as
 \begin{equation} \textit{Sh}_{\textit{SU}}^{c}=\frac {\rho \,{U_{m}^{c}}^2}{\Delta \rho \,g\,d} \quad \textrm {and} \quad \textit{Sh}_{\tau {\textit{SU}}}^c= \frac {\rho \,{u_\tau ^{c}}^2}{\Delta \rho \,g\,d}, \end{equation}
we obtain the critical values
 $\textit{Sh}_{\textit{SU}}^{c} \simeq 4$
and
 $\textrm{Sh}_{\tau _{\textit{SU}}}^c \simeq 0.12$
. These results provide a reliable predictive criterion for design situations where rapid gap expansion mobilises sediment.
The fact that the critical Shields number for erosion is not strictly identical for the squeeze flow and the suction flow is due to the fact that the flow is not strictly identical for two reasons corresponding to unsteadiness. The first reason is that the maximal radial velocity
 $U_{m}$
of the flow induced by the motion of the disk is identical in both configurations, but not the time
 $t_{m}$
at which this maximal radial velocity is reached and, thus, not the typical flow acceleration
 $U_{m}/t_{m}$
. Indeed, the time
 $t_{m}$
is smaller in the suction flow, for which
 $0 \lt t_{m} \lt \tau /2$
, than in the squeeze flow, for which
 $\tau /2 \lt t_{m} \lt \tau$
. As it is typically three times smaller, with a precise value that depends slightly on
 $b/L$
, the acceleration
 $U_{m}/t_{m}$
is typically three times larger in the suction flow than in the squeeze flow. This larger acceleration is expected to induce a larger driving drag force on the grains from the added-mass force term, which can explain some of the difference between the two flow configurations. The second reason is the vortex flow that modifies the velocity profile within the gap and induces some additional unsteady effects.
4. Erosion by vortices
Let us now focus on the vortex erosion that may be observed after the disk stops its motion towards the granular bed, as reported in § 2.4. When the disk has completed its stroke (
 $t^{\ast }\gt 1$
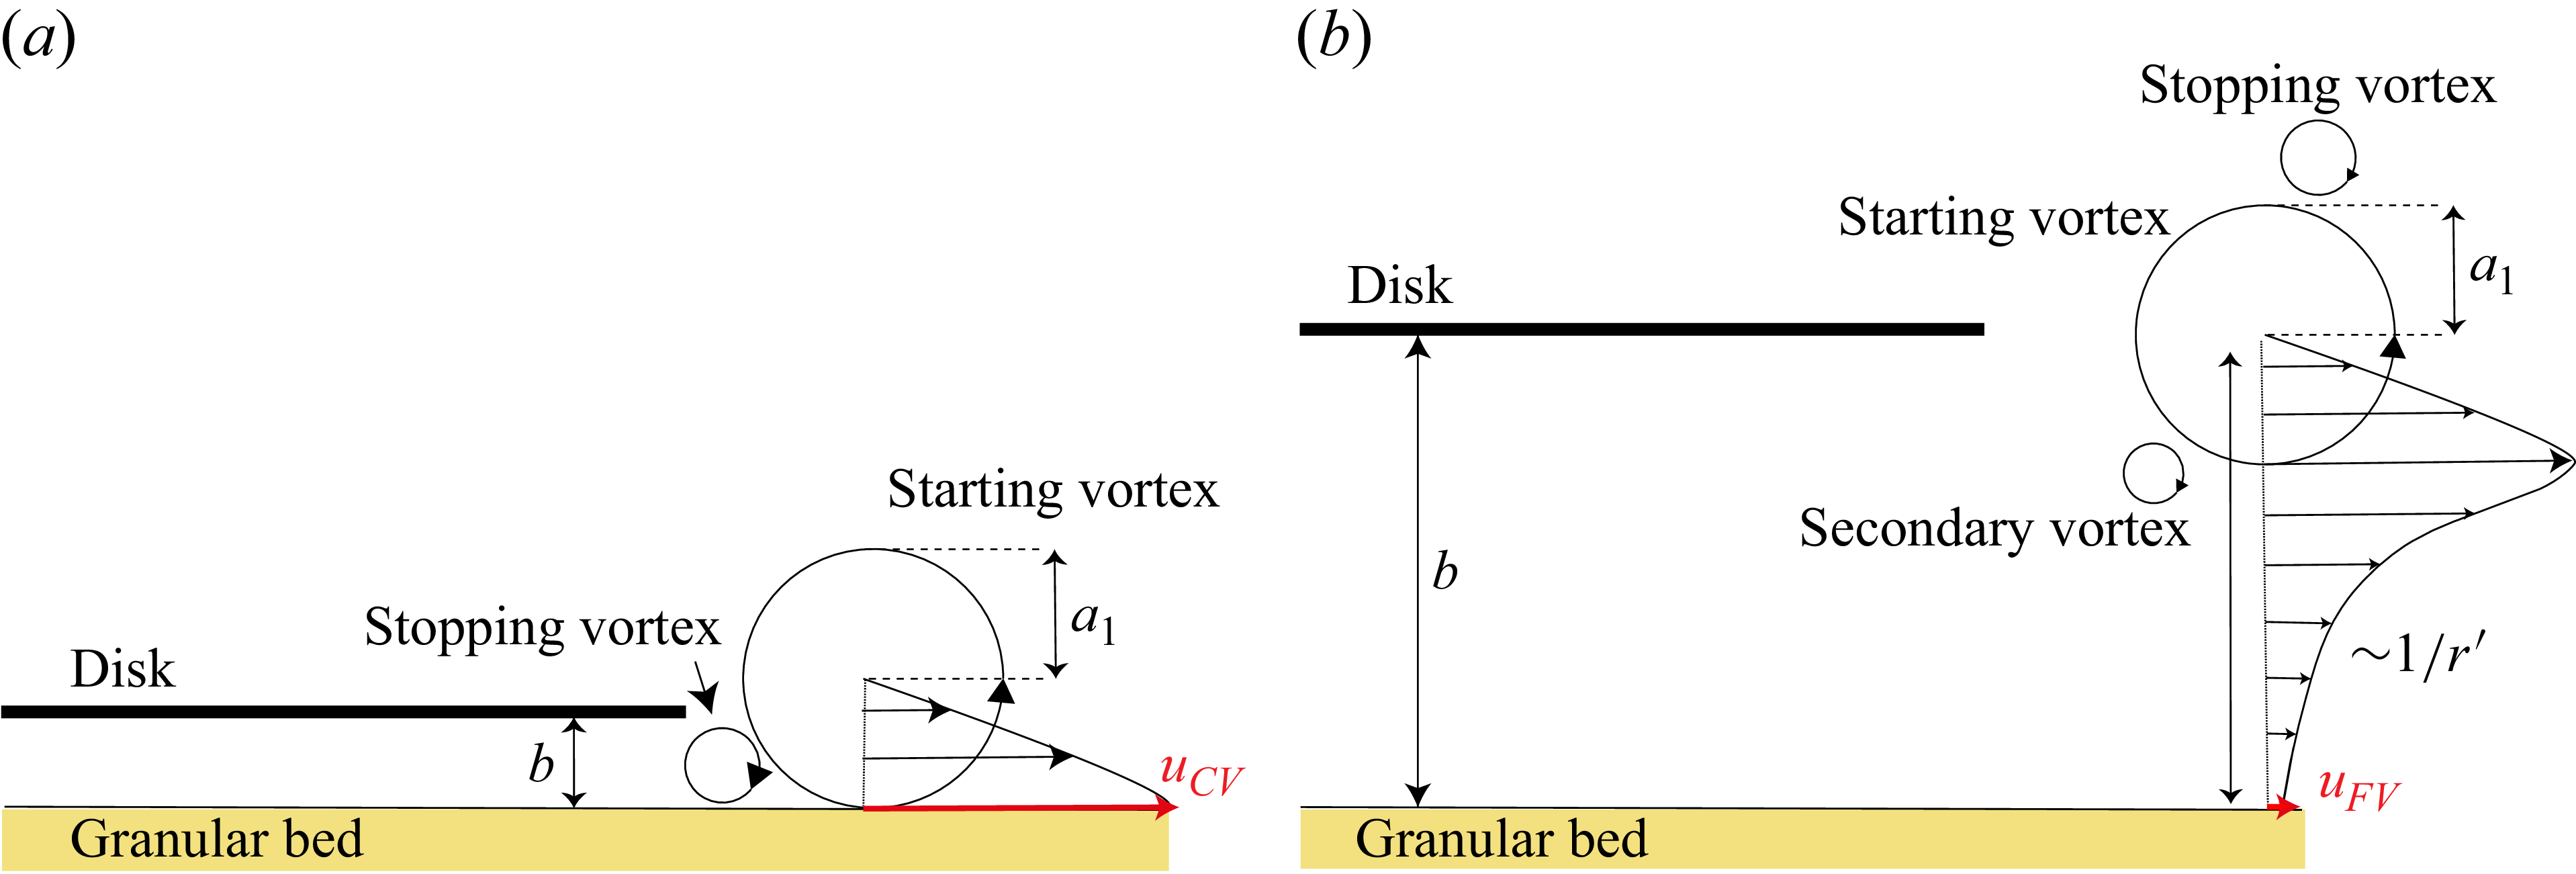
), the starting vortex ring, generated in its wake during the translation, drifts downward and interacts with the rim of the disk. This interaction detaches a counter-rotating stopping vortex which, together with the starting vortex, forms a dipole of vortex rings that propagates parallel to the granular bed surface, as illustrated by the schematics of figure 11. When the disk stops sufficiently close to the bed (
 $b/a_1\lesssim 1$
, where
 $a_1 = a(t^*=1)$
is the core radius of the starting vortex at the disk stop), as illustrated in figure 11(a), the dipole impinges on the grains almost immediately, entraining sediment both outward for the starting vortex and inward for the stopping vortex, thus generating the bidirectional transport described in figure 2. In this regime, the disk velocity
 $V_m$
is the experimental control parameter, but the relevant forcing for erosion is the near-bed velocity induced by the vortices. We thus need to introduce
 $u_{\textit{CV}}$
and
 $u_{\textit{FV}}$
(see figure 11).
Schematic of (a) the impact of the dipole formed by the starting vortex and the stopping vortex on the granular bed when the approaching disk stops close to the bed (
 $b/a_1 \lesssim 1$
) and of (b) the near-wall velocity behaviour when the disk stops farther from the bed (
 $b/a_1\gtrsim 1$
).

When the disk stops far from the bed (
 $ b/a_1 \gtrsim 1$
), the stopping vortex flows around the starting vortex without impacting the bed directly. Therefore, erosion is delayed and results either from the slowly decaying velocity field of the starting vortex itself or from the later impact of secondary stopping vortices (figure 11
b). These two scenarios will be referred to as CV for the close vortex case (
 $b/a_1\lesssim 1$
) and FV for the far vortex case (
 $b/a_1\gtrsim 1$
). Thus, two distinct situations, depending on the ratio
 $b/a_1$
, will be considered when analysing the erosion thresholds after the disk comes to rest.
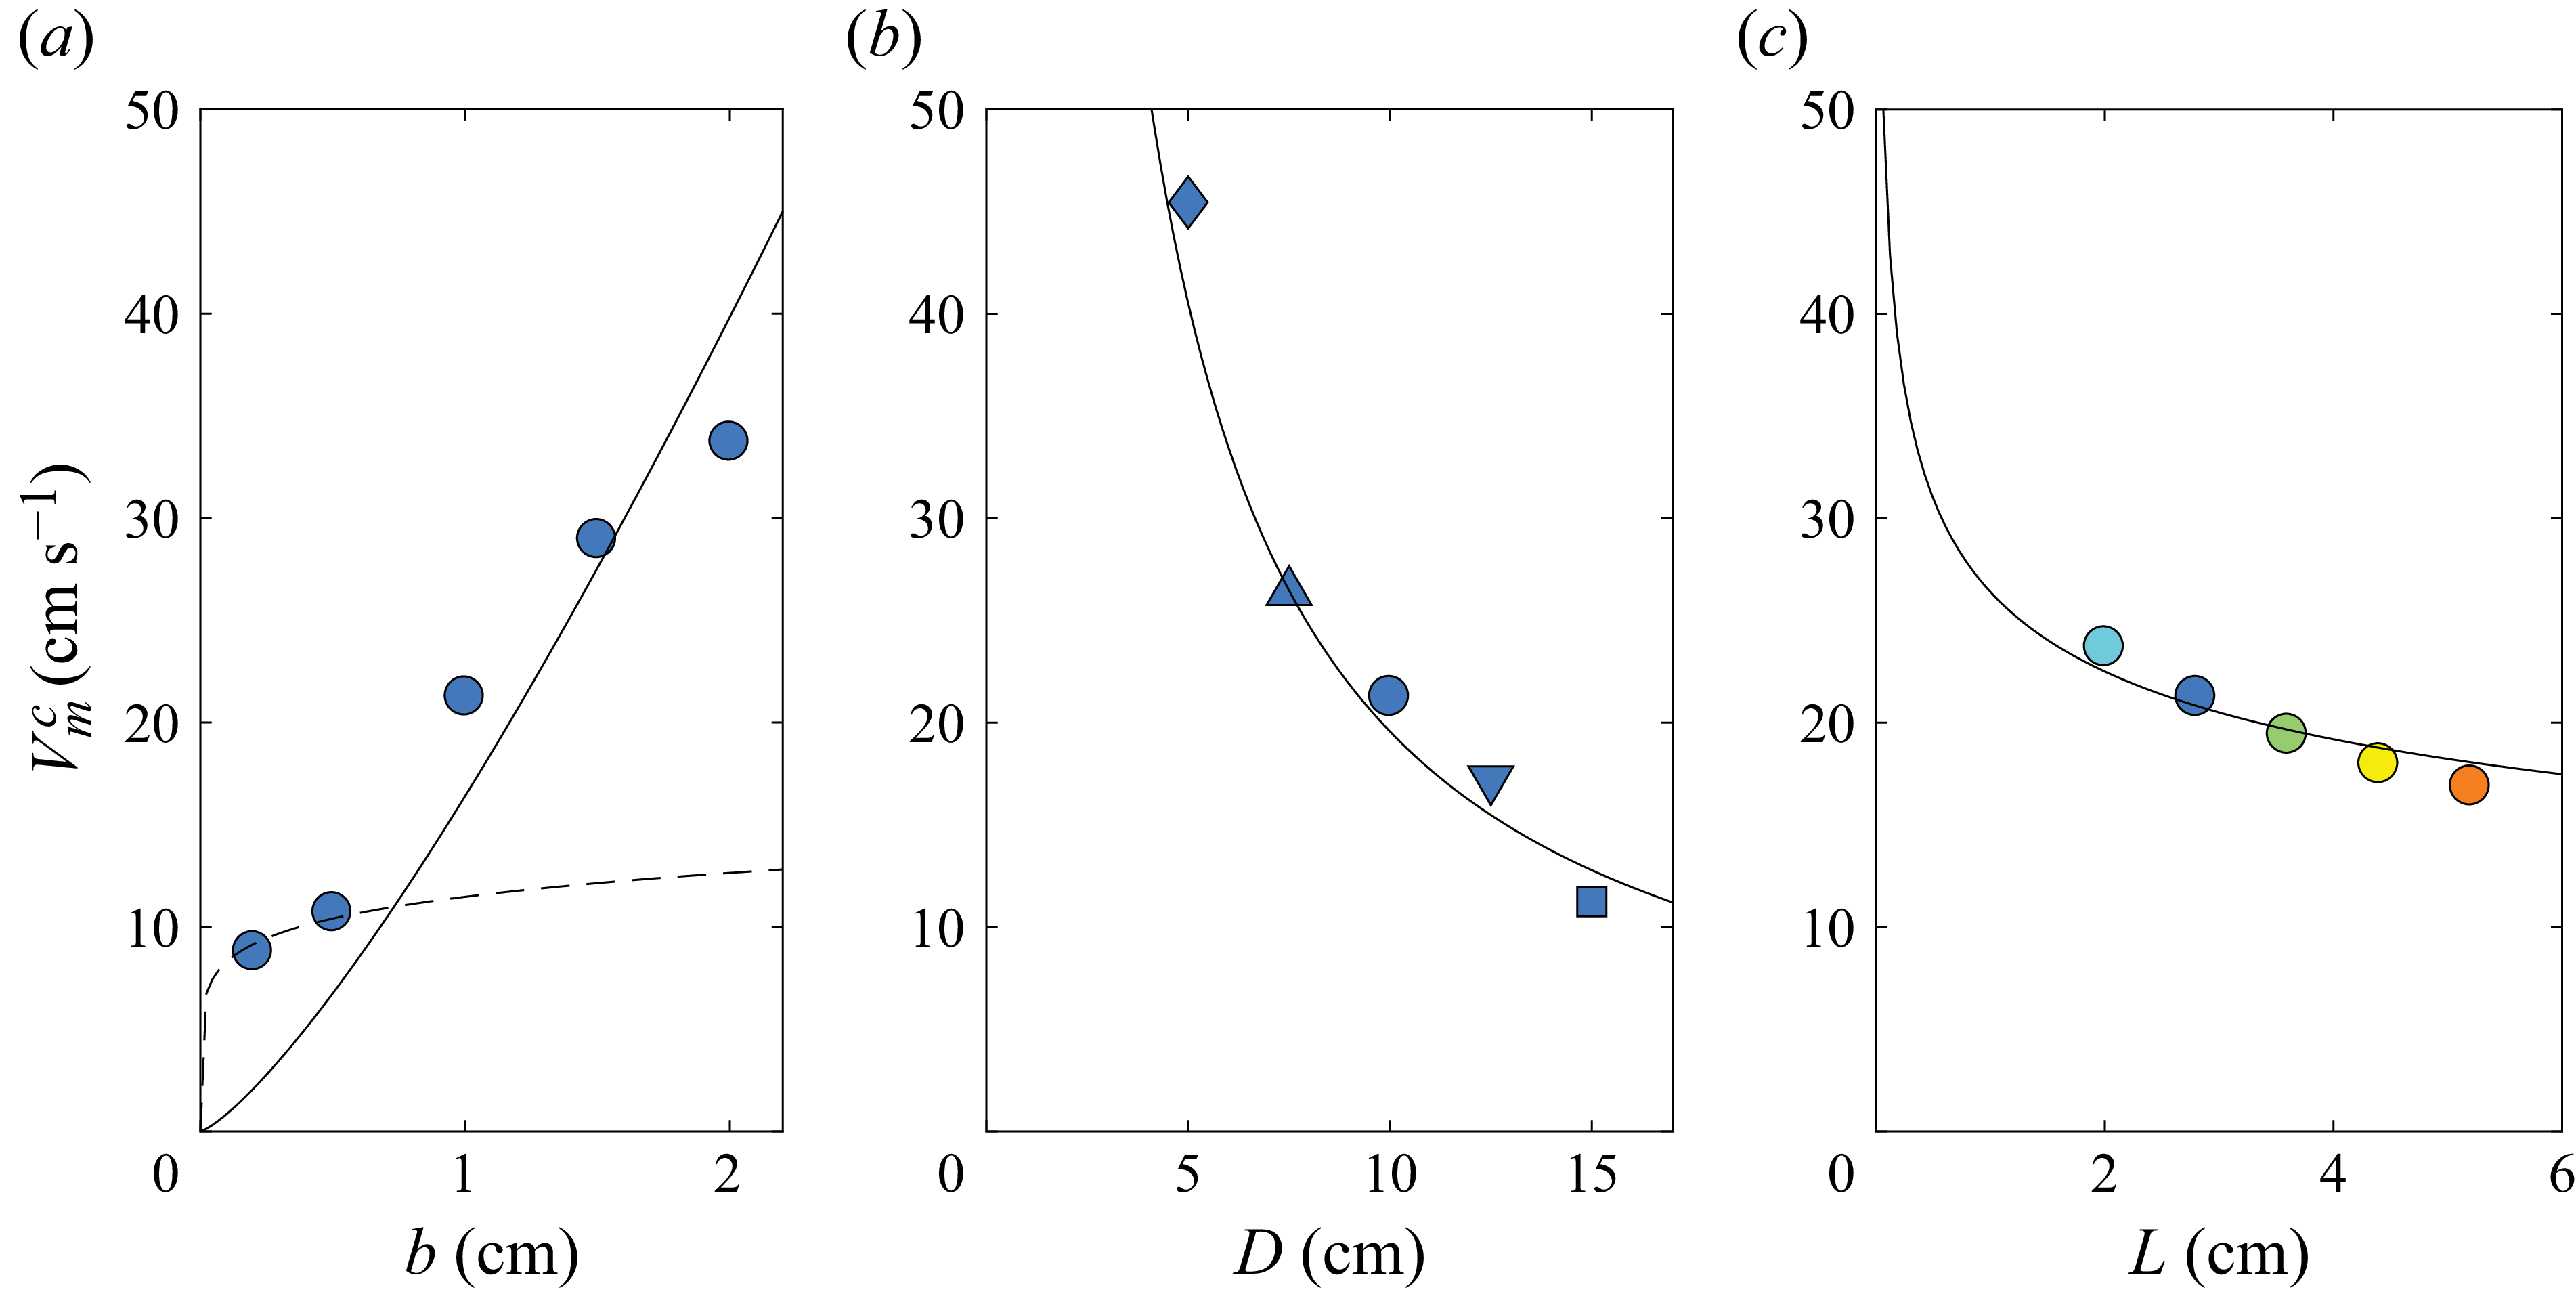
The critical disk velocity
 $V_{m}^{c}$
required to trigger vortex-driven erosion after the disk stops is reported in figure 12(a–c). For a fixed disk diameter
 $D$
and stroke length
 $L$
,
 $V_{m}^{c}$
increases monotonically with the minimum distance
 $b$
to the bed (figure 12
a), meaning that a faster stroke is needed when the vortices must travel farther before hitting the grains. In contrast,
 $V_{m}^{c}$
decreases with increasing disk diameter
 $D$
(figure 12
b) because the circulation of the starting vortex scales roughly with
 $D$
(Steiner et al. Reference Steiner, Morize, Delbende, Sauret and Gondret2025), so that a larger disk generates a stronger vortex for the same disk velocity. Finally,
 $V_{m}^{c}$
is found to decrease with increasing stroke length
 $L$
(figure 12
c), which is opposite to what we observed for the squeezing-flow threshold discussed in the previous section. This difference can be explained by a longer acceleration phase, which allows the vortex to build up more circulation, which scales roughly with
 $L^{1.2}$
(Steiner et al. Reference Steiner, Morize, Delbende, Sauret and Gondret2025), and thus leads to bed erosion at a lower disk velocity.
Critical velocity of the approaching disk at the onset of vortex erosion occurring once the disk has come to rest (
 $t^{*}\gt 1$
),
 $V_m^{c}$
, measured for a disk released from its upper position as a function of (a) the final distance to the granular bed,
 $b$
(
 $L = 2.8\,\textrm { cm}$
,
 $D = 10\ \textrm {cm}$
); (b) the disk diameter,
 $D$
(
 $L = 2.8\ \textrm {cm}$
,
 $b = 1\ \textrm {cm}$
); and (c) the stroke length,
 $L$
(
 $D = 10\ \textrm {cm}$
,
 $b = 1\ \textrm {cm}$
). The solid lines are best fits from (4.4) corresponding in CGS units to (a)
 $V_m^c \simeq 16.4 \, b^{1.28}$
(for
 $b \gt 0.8$
cm), (b)
 $V_m^c \simeq 220/D^{1.05}$
and (c)
 $V_m^c \simeq 26.4/L^{0.23}$
, with (a)
 $u_{\textit{FV}}^c \simeq 26$
cm s–1, (b) 31 cm s–1 and (c) 33 cm s–1. The dashed line is the best fit from (4.4) for
 $b \lt 0.8$
cm corresponding in CGS units to
 $V_m^c \simeq 11.5 \, b^{0.14}$
with
 $u_{\textit{CV}}^c \simeq 41$
cm s–1.

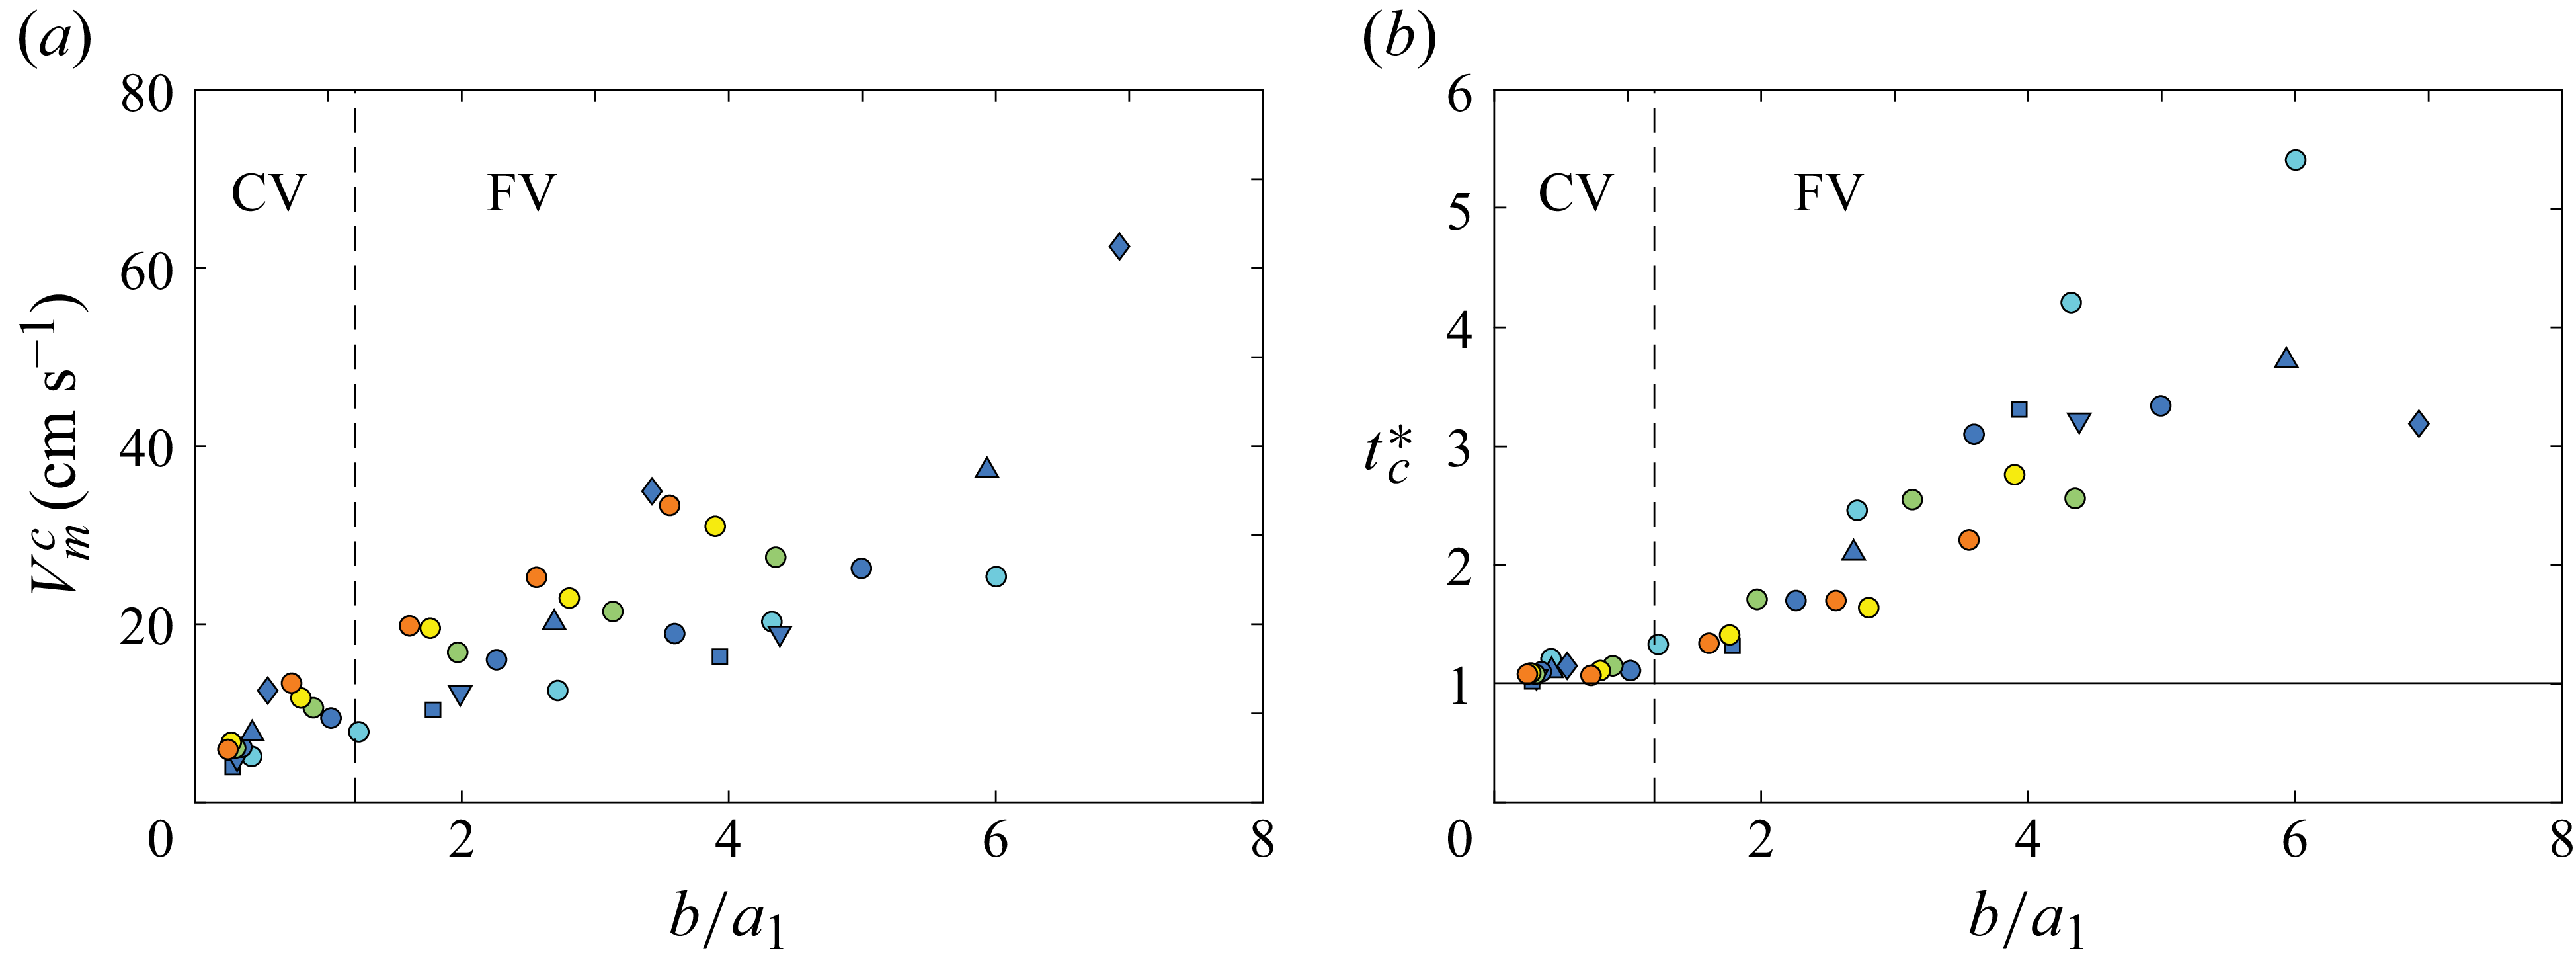
All the critical values
 $V_{m}^{c}$
for vortex-driven erosion are shown in figure 13(a) as a function of the size ratio
 $b/a_1$
of the gap with the core radius
 $a_1$
of the vortex at the disk stop. There is substantial dispersion, but the global trend is that
 $V_{m}^{c}$
increases with larger
 $b/a_1$
. The critical dimensionless time
 $t^{*}_{c}$
at which the first grains begin to be eroded just above the threshold is shown in figure 13(b). The data show that
 $t^{*}_{c} \simeq 1$
for
 $b/a_1 \lesssim 1.2$
and that
 $t^{*}_{c} \gt 1$
for
 $b/a_1 \gtrsim 1.2$
, which corresponds to the CV and FV erosion scenarios where the vortex erosion arises at the disk stop or later, respectively.
(a) Velocity of the disk at the vortex erosion threshold as a function of
 $b/a_1$
. (b) Dimensionless time
 $t^{*}_{c}$
at which the first grains begin to be eroded; the horizontal line marks the instant when the disk comes to rest. In both panels, the vertical dashed lines show the transition
 $b/a_1=1.2$
between CV and FV.

To estimate the forcing and corresponding velocity near the granular bed, we consider that the shear applied by the vortices on the granular bed can be estimated by the circumferential velocity of the vortex close to the granular bed. The two following expressions are appropriate depending on the position of the vortex core at
 $t^*=1$
:
 \begin{equation} u_{\textit{CV}}= \frac {\varGamma _1}{2\pi a_1}, \quad u_{\textit{FV}}= \frac {\varGamma _1}{2\pi b}, \end{equation}
for
 $b/a_1 \lesssim 1.2$
and
 $\gtrsim 1.2$
, respectively, where
 $\varGamma _1 = \varGamma (t^*=1)$
and
 $a_1$
denote the circulation and core radius of the starting vortex at the disk stop. For
 $b/a_1\lesssim 1.2$
(CV), the stopping vortex is trapped between the disk and the bed so that the dipole impinges directly on the bed, and the first expression in (4.1) therefore sets the relevant shear. When
 $b/a_1\gtrsim 1.2$
(FV), the starting vortex remains at an average distance
 $b$
from the grains and its
 $1/r'$
velocity decay controls the erosion at
 $r' \simeq b$
, leading to the second expression in (4.1).
The circulation
 $\varGamma _1$
and radius
 $a_1$
of the starting vortex at the disk stop measured by Steiner (Reference Steiner2023) and given in (A10) in Appendix A.2.1 are the following:
 $|\varGamma _1|\,\simeq 1.1 \, L^{1.23}D^{1.05}b^{-0.28}\tau ^{-1}$
and
 $a_1 \simeq 0.064 \, L^{0.55}D^{0.59}b^{-0.14}$
. They follow the same scalings as the maximal circulation
 $\varGamma _m$
and radius
 $a_m$
reported by Steiner et al. (Reference Steiner, Morize, Delbende, Sauret and Gondret2025) with numerical prefactors only a little smaller: 1.1 instead of 1.3 for the circulation and 0.064 instead of 0.068 for the radius, corresponding to a decrease of only 20 % and 10 %, respectively. The corresponding expressions for the velocity induced by the vortex in the vicinity of the grains,
 $u_{\textit{CV}}$
and
 $u_{\textit{FV}}$
, are thus
 \begin{equation} u_{\textit{CV}} \simeq \frac {17 \, L^{0.68} \, D^{0.46}}{2\pi \,b^{0.14} \,\tau }, \quad u_{\textit{FV}} \simeq \frac {1.1 \, L^{1.23} \, D^{1.05}}{2\pi \, b^{1.28} \, \tau }. \end{equation}
Note that the two scalings of (4.2) are very different. A quantitative comparison between the experimental thresholds and the theoretical predictions is provided in figure 12(a–c). The dashed lines denote the confined-vortex (CV) regime, in which the stopping vortex is confined between the disk and the bed; the solid lines denote the far-vortex (FV) regime, in which the far-field action of the vortex erodes the granular bed from a distance of order
 $b$
. In each case, the curves represent best fits obtained from (4.2), with fitted coefficients reported in the caption of figure 12. The good agreement between experiments and the model based on (4.2) confirms the relevance of the scaling arguments for both regimes and highlights the distinct physical mechanisms controlling erosion depending on the disk–bed separation. It is worth noting that in figure 12(a), the first two data points correspond to the confined-vortex (CV) regime, while the remaining points fall in the far-vortex (FV) regime. By contrast, all the data shown in figure 12(b–c) belong to the FV regime. This distinction indicates that only when the disk stops at very small gaps does the dipole impinge directly on the bed (CV), whereas in most other cases, erosion is governed by the far-field action of the starting vortex (FV). The fits reported in figure 12 thus successfully discriminate between the two regimes and capture the scaling of the erosion threshold with the control parameters in both cases.
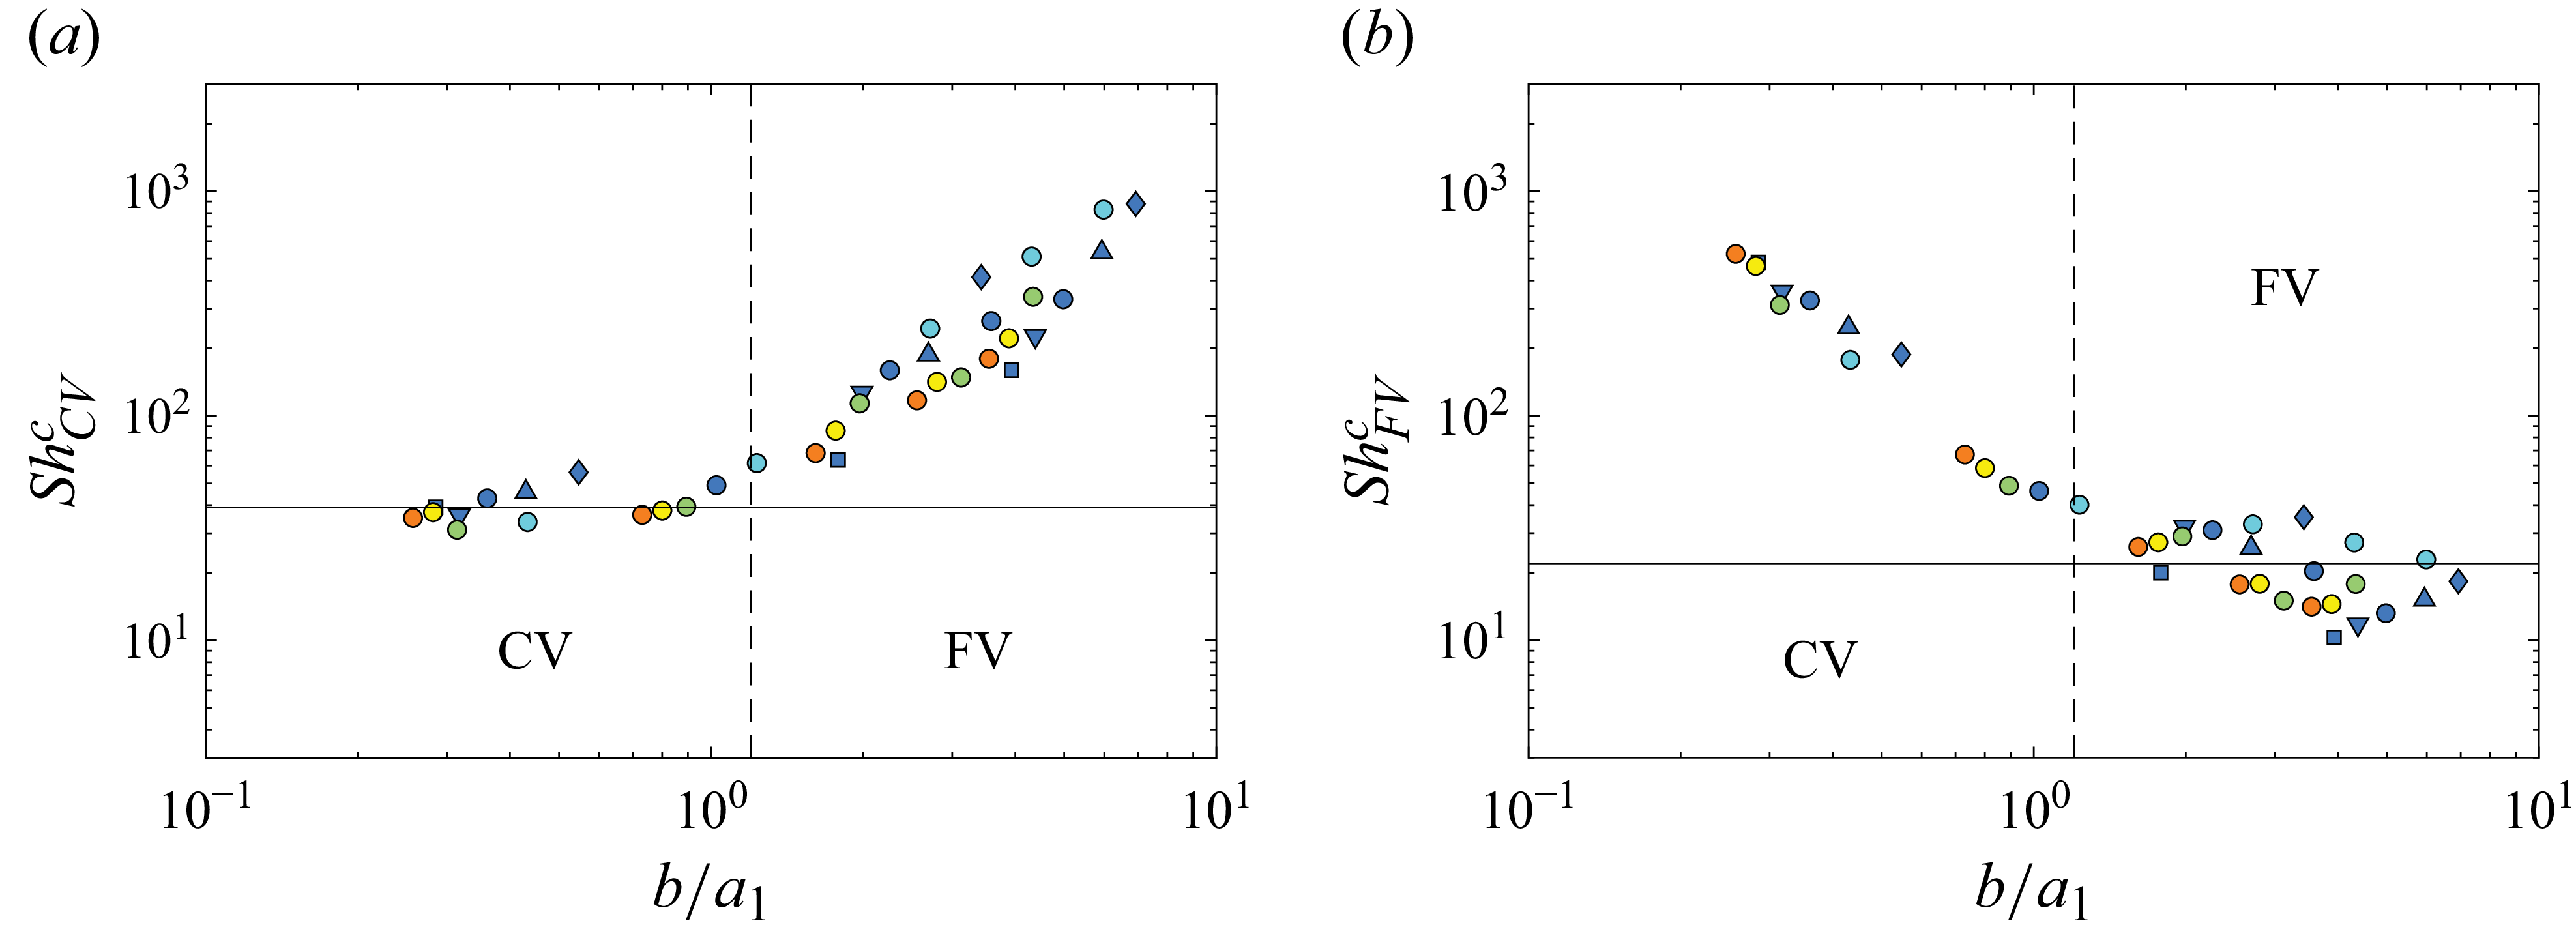
Critical Shields number (a)
 $\textit{Sh}_{\textit{CV}}^{c}$
and (b)
 $\textit{Sh}_{\textit{FV}}^{c}$
defined with the local velocity
 $u_{\textit{CV}}$
or
 $u_{\textit{FV}}$
induced by the impact of the starting vortex ring, as a function of
 $b/a_1$
. The vertical dashed lines mark the transition at
 $b/a_1=1.2$
, while the horizontal lines indicate the mean values
 $\overline {\textit{Sh}_{\textit{CV}}^{c}} = 39$
and
 $\overline {\textit{Sh}_{\textit{FV}}^{c}} = 22$
.

Using
 $u_{\textit{CV,FV}}$
, we can estimate the corresponding Shields number based on the local vortex-induced velocity
 $\textit{Sh}_{\textit{CV,FV}}=\rho u_{\textit{CV,FV}}^{2}/(\Delta \rho \,g\,d)$
. The critical values of these two Shields numbers
 $\textit{Sh}_{\textit{CV}}^{c}$
and
 $\textit{Sh}_{\textit{FV}}^{c}$
calculated from the critical time
 $\tau _c$
measured at the erosion threshold are reported as a function of
 $b/a_1$
in figures 14(a) and 14(b), respectively. We observe a rather good collapse of the data on the two following plateau values:
 \begin{equation} \textit{Sh}_{\textit{CV}}^{c}\simeq 39\pm 15, \quad \textit{Sh}_{\textit{FV}}^{c}\simeq 22\pm 12, \end{equation}
for
 $b/a_1 \lesssim 1.2$
and
 $b/a_1 \gtrsim 1.2$
, respectively. The dispersion of the data around the plateau value
 $\textit{Sh}_{\textit{CV}}^{c}\simeq 39$
in figure 14(a) is not so large, less than 40 %. The larger dispersion – exceeding 50 % of the data around the plateau value
 $\textit{Sh}_{\textit{FV}}^{c}\simeq 22$
in figure 14(b) – is likely due to the fact that erosion may not originate from the primary starting vortex, but rather from the secondary stopping vortex or from a tertiary vortex whose circulation and core radius may slightly differ. These values of Shields numbers are relatively high because they are not based on the friction velocity, which was not measured, but the corresponding local Shields number would certainly be roughly
 $10^{-2}$
smaller. This observation confirms that erosion is governed by inertial stresses in both CV and FV scenarios, but with different characteristic velocities. The particle Reynolds number
 $\textit{Re}_p = u_{\textit{CV,FV}}d/\nu$
based on the circumferential velocity
 $u_{\textit{CV}}$
and
 $u_{\textit{FV}}$
exceeds always 80 throughout the explored parameter space, further supporting the inertial nature of the destabilising force. The critical values
 $u_{\textit{CV}}^c$
and
 $u_{\textit{FV}}^c$
at the erosion threshold corresponding to the critical Shields numbers given in (4.3) are
 $u_{\textit{CV}}^c \simeq (38 \pm 8)$
cm s-1 and
 $u_{\textit{FV}}^c \simeq (28 \pm 7)$
cm s–1, respectively. Considering (4.2), one can infer the two possible scalings for the critical disk velocity
 $V_m^c = \pi L/(2 \tau _c)$
in the CV and FV cases:
 \begin{equation} V_{m,\textit{CV}}^c \simeq \frac {\pi ^2}{17} \, \frac {b^{0.14} \, L^{0.32}}{D^{0.46}} \, u_{\textit{CV}}^c, \quad V_{m,{FV}}^c \simeq \frac {\pi ^2}{1.1} \, \frac {b^{1.28}}{D^{1.05} \, L^{0.23}} \, u_{\textit{FV}}^c. \end{equation}
These scalings explain the variations of
 $V_m^c$
reported in figure 12(a–c). Indeed, in the case of figure 12(b,c) corresponding to FV flow, the second scaling fits well the data with a decrease of
 $V_m^c$
for both increasing
 $D$
and
 $L$
(see solid lines). For the case of figure 12(a), the second scaling (solid line) fits quite well the three points corresponding to large enough
 $b$
values, with a roughly linear increase of
 $V_m^c$
with
 $b$
, whereas the first scaling (dashed line) fits well the two points corresponding to small enough
 $b$
values, with a sublinear increase of
 $V_m^c$
with
 $b$
.
In summary, the erosion occurring after the disk stops is controlled by the impact of the vortices generated during the stroke. A single geometric parameter, the ratio
 $b/a_1$
, selects whether the bed is eroded by the immediate dipole impact (CV) when the disk stops close to the granular bed (
 $b/a_1 \lesssim 1$
) or by the subsequent far-field action of the vortex (FV) when the disk stops far from the granular bed (
 $b/a_1 \gtrsim 1$
). When expressed in terms of the physically relevant local velocity, the critical Shields number is nearly constant within each regime, providing a criterion for vortex-driven grain motion that is independent of the disk kinematics.
5. Conclusion
In this study, we experimentally investigated how a rigid disk of diameter
 $D$
translating towards or away from a granular bed can erode and ultimately resuspend glass beads. We have focused here on an elementary unsteady motion at the minimal distance
 $b$
from the granular bed: a single stroke of length
 $L$
during the time
 $\tau$
at the maximum velocity
 $V_m$
, and have quantified the onset of erosion
 $V_m^c$
and the dimensionless time
 $t_c^\ast = t_c/\tau$
at which it arises.
When the disk moves towards the bed, we found that the initial erosion is triggered by the maximal radial outflow that develops beneath the disk while it is still decelerating (
 $1/2 \lt t_c^\ast \lt 1$
). For sufficiently small gaps (
 $b/D\lesssim 0.2$
), the threshold is governed by a constant critical outflow velocity
 $U_m^c \simeq V_m^c D/ [4b(1+L/b)^{1/2} ]$
that is related to the disk motion close to the granular bed from mass conservation. The critical local Shields number based on the friction velocity
 $u_\tau \simeq 0.13 U_m$
at the bed level is
 $\textit{Sh}_\tau ^c \simeq 0.19$
. Once the disk stops, the interaction between the starting vortex ring and the edge of the disk gives rise to a dipole of vortex rings. This dipole produces either immediate (
 $t_c^\ast \simeq 1$
) or delayed (
 $t_c^\ast \gt 1$
) erosion depending on whether the dipole is close to or far from the bed, respectively, i.e. whether the ratio
 $b/a_1$
is smaller or larger than unity, respectively, where
 $a_1$
is the radius of the vortex core at the disk stop. This complex vortex flow explains both the bidirectional grain transport observed near the bed and the increase in the disk critical velocity with
 $b/a_1$
.
In the opposite case, when the disk translates away from the granular bed, erosion occurs before the disk reaches its maximum velocity (
 $0 \lt t_c^\ast \lt 1/2$
). As the time at which the maximal radial inflow occurs is significantly smaller than the time at which the maximal radial outflow occurs for the reverse motion, the flow acceleration is significantly larger which induces a larger driving drag force for erosion due to the added-mass contribution. Furthermore, the inward radial suction flow is reinforced by the developing starting vortex within the gap during its first accelerating phase of the disk. These two phenomena mean that the critical Shields number
 $\textit{Sh}_\tau ^c \simeq 0.12$
for the suction flow is significantly smaller than the value 0.19 for the squeeze flow.
Taken together, the two configurations highlight how asymmetries in the flow, depending on the direction of motion (outflow versus inflow, starting versus stopping vortices), result in different erosion thresholds. The asymmetry in the flow generated also explains why a disk that travels away from the granular bed, despite generating a weaker wall stress, can still mobilise grains earlier in the stroke owing to the rapid growth of the starting ring. These findings provide a quantitative framework for guiding geophysical or biological scenarios in which impulsively moving objects induce sediment transport via vortex shedding. An open issue is how the erosion and transport threshold is altered when the disk (or a biological analogue such as a flounder fin) performs repeated oscillations rather than a single stroke, because the vortices shed during successive half-cycles are expected to interact with one another in a more complex, history-dependent manner. Erosion has already yielded some surprising results for vertical oscillations of a horizontal disk (La Ragione et al. Reference La Ragione, Laurent, Jenkins and Bewley2019) or the horizontal oscillations of a vertical plate (Martino et al. Reference Martino, Toriggia, Paterson and Piva2018) near a granular bed.
Supplementary movie
Supplementary movie is available at https://doi.org/10.1017/jfm.2026.11597.
Acknowledgements
The authors thank I. Delbende for his help in the numerical simulations, G. Quibeuf and G. Renard for their preliminary experimental contributions, and J. Amarni, A. Aubertin, L. Auffray and R. Pidoux for their work on the experimental set-up.
Declaration of interests
The authors report no conflict of interest.
Appendix A. Scalings of the starting and stopping vortices in the wake of a disk
A.1. Vortex scalings in the unbounded case
In the unbounded case, where the disk of diameter
 $D$
is far from any boundaries (
 $b/a \gg 1)$
, the maximum circulation
 $|\varGamma _m|$
and core radius
 $a_m$
of the starting vortex ring formed in the wake of a translating disk whose velocity evolves sinusoidally over the stroke length
 $L$
and time
 $\tau$
have been shown by Steiner et al. (Reference Steiner, Morize, Delbende, Sauret and Gondret2023) to follow the scaling laws
 \begin{equation} |\varGamma _m| \simeq 2.1 \, L^{4/3}D^{2/3} \tau ^{-1} \quad \mathrm{and} \quad a_m \simeq 0.1 \, L^{2/3}D^{1/3}. \end{equation}
The maximum circulation and core radius of the starting vortex have been reported by Steiner et al. (Reference Steiner, Morize, Delbende, Sauret and Gondret2023) to be reached at the dimensionless times
 $\tau _{\varGamma _m}^\ast = 0.70 \pm 0.02$
and
 $\tau _{a_m}^\ast = 0.79 \pm 0.07$
, respectively, which do not depend on the size ratio
 $L/D$
. Steiner et al. (Reference Steiner, Morize, Delbende, Sauret and Gondret2023) have also shown that the circulation and core radius of the starting vortex at the disk stop (
 $t^\ast = 1$
) follow the same scaling laws with only slightly smaller numerical coefficients:
 \begin{equation} |\varGamma _1| \simeq 1.9 \, L^{4/3}D^{2/3} \tau ^{-1} \quad \mathrm{and} \quad a_1 \simeq 0.085 \, L^{2/3}D^{1/3}. \end{equation}
And finally, Steiner et al. (Reference Steiner, Morize, Delbende, Sauret and Gondret2023) have also reported that the scalings of the maximum circulation and core radius of the counter-rotating stopping vortex are the same, with even smaller coefficients:
 \begin{equation} |\varGamma _{m,s}| \simeq 1.1 \, L^{4/3}D^{2/3} \tau ^{-1} \quad \mathrm{and} \quad a_{m,s} \simeq 0.06 \, L^{2/3}D^{1/3}. \end{equation}
The maximum circulation and maximum core radius of the stopping vortex are thus about half the maximum values measured for the primary starting vortex. They are reached at the dimensionless times
 $\tau _{\varGamma _{m,s}}^\ast = 1.23 \pm 0.05$
and
 $\tau _{a_{m,s}}^\ast = 1.27 \pm 0.09$
, respectively.
A.2. Vortex scalings close to a wall
In the presence of a bottom wall, the minimum distance
 $b$
between the disk and the wall has been shown to play a significant role in the generation process of the vortex ring by Steiner et al. (Reference Steiner, Morize, Delbende, Sauret and Gondret2025). The dimensionless coefficients for the circulation
 $c_\varGamma$
and the core radius
 $c_a$
, defined as
 \begin{equation} c_\varGamma = \frac {|\varGamma |}{L^{4/3}D^{2/3} \tau ^{-1}} \quad \mathrm{and} \quad c_a = \frac {a}{L^{2/3}D^{1/3}}, \end{equation}
have been shown to depend on the two ratios
 $b/D$
and
 $L/D$
for close-wall motions, rather than being constant for far-wall motions, and to differ between the approaching and leaving cases, as detailed in the following.
Sets of experimental and numerical parameters, associated non-dimensional numbers, and corresponding symbols used for figure 15. Empty symbols correspond to experiments and full symbols correspond to numerical simulations.

A.2.1. Vortex scalings in the approaching case
When the disk is translating towards the wall, the dimensionless coefficients for the maximum circulation
 $c_{\varGamma _m}$
and the maximum radius
 $c_{a_m}$
of the vortex core have been shown by Steiner et al. (Reference Steiner, Morize, Delbende, Sauret and Gondret2025) to follow the scalings
 \begin{equation} c_{\varGamma _m} \simeq \left \{ \begin{array}{l}\!\! 2.1 \\ \\ \!\! 1.3 \, (L/D)^{-0.1}(b/D)^{-0.28} \end{array} \quad \mathrm{for} \quad (L/D)^{-0.1}(b/D)^{-0.28} \, \left \{ \begin{array}{l}\!\! \lesssim 1.6, \\ \\ \!\! \gtrsim 1.6 ,\end{array} \right . \right . \end{equation}
 \begin{equation} c_{a_m} \simeq \left \{ \begin{array}{l}\!\! 0.1 \\ \\ \!\! 6.8 \times 10^{-2} (L/D)^{-0.12}(b/D)^{-0.14} \end{array} \quad \mathrm{for} \quad (L/D)^{-0.12}(b/D)^{-0.14} \, \left \{ \begin{array}{l}\!\! \lesssim 1.4, \\ \\ \!\! \gtrsim 1.4. \end{array} \right . \right . \end{equation}
The maximum circulation
 $\varGamma _m$
and core radius
 $a_m$
of the starting vortex in the near-wall configuration for the approaching case can be rewritten in dimensional form as
 \begin{equation} |\varGamma _m| \simeq 1.3 \, L^{1.23}D^{1.05}b^{-0.28}\tau ^{-1}\quad \mathrm{and} \quad a_m \simeq 6.8\times 10^{-2}L^{0.55}D^{0.59}b^{-0.14}. \end{equation}
Dimensionless (a) circulation
 $c_{\varGamma _1}$
as a function of
 $(L/D)^{-0.1}(b/D)^{-0.28}$
and (b) dimensionless core radius
 $c_{a_1}$
as a function of
 $(L/D)^{-0.12}(b/D)^{-0.14}$
for a disk moving towards a wall. The horizontal dashed lines are
 $c_{\varGamma _1, \infty } \simeq 1.9$
and
 $c_{a_1, \infty } \simeq 0.085$
, which correspond to the values obtained in an infinite medium by Steiner et al. (Reference Steiner, Morize, Delbende, Sauret and Gondret2023). The equations of the solid lines are (a)
 $c_{\varGamma _1} = 1.1 (L/D)^{-0.1}(b/D)^{-0.28}$
and (b)
 $c_{a_1} = 0.064 (L/D)^{-0.12}(b/D)^{-0.14}$
. The vertical dashed lines are (a)
 $(L/D)^{-0.1}(b/D)^{-0.28} = 1.7$
and (b)
 $(L/D)^{-0.12}(b/D)^{-0.14} = 1.3$
. All the open (respectively filled) symbols correspond to the experiments (respectively simulations) reported in table 2.

The circulation
 $\varGamma _1$
and core radius
 $a_1$
of the starting vortex ring at the disk stop (
 $t^\ast = 1$
) have not been reported by Steiner et al. (Reference Steiner, Morize, Delbende, Sauret and Gondret2025), but Steiner (Reference Steiner2023) has shown that they follow the same scalings as the maximum values with only slightly smaller coefficients:
 \begin{equation} c_{\varGamma _1} \simeq \left \{ \begin{array}{l}\!\! 1.9 \\ \\ \!\! 1.1 \, (L/D)^{-0.1}(b/D)^{-0.28} \end{array} \quad \mathrm{for} \quad (L/D)^{-0.1}(b/D)^{-0.28} \, \left \{ \begin{array}{l} \!\! \lesssim 1.7, \\ \\ \!\! \gtrsim 1.7, \end{array} \right . \right . \end{equation}
 \begin{equation} c_{a_1} \simeq \left \{ \begin{array}{l}\!\! 0.085 \\ \\ \!\! 6.4 \times 10^{-2} (L/D)^{-0.12}(b/D)^{-0.14} \end{array} \quad \mathrm{for} \quad (L/D)^{-0.12}(b/D)^{-0.14} \, \left \{ \begin{array}{l} \!\! \lesssim 1.3, \\ \\ \!\! \gtrsim 1.3. \end{array} \right . \right . \end{equation}
The measured values for the dimensionless coefficients
 $c_{\varGamma _1}$
and
 $c_{a_1}$
from the PIV experimental measurements (open symbols) and numerical simulations (filled symbols) described by Steiner (Reference Steiner2023) are reported in figure 15 for the flow configurations reported in table 2. The circulation
 $\varGamma _1$
and radius
 $a_1$
of the starting vortex at the disk stop (
 $t^\ast = 1$
) in the near-wall configuration for the approaching case can be rewritten in dimensional form as
 \begin{equation} |\varGamma _1| \simeq 1.1 \, L^{1.23}D^{1.05}b^{-0.28}\tau ^{-1}\quad \mathrm{and} \quad a_1 \simeq 6.4\times 10^{-2}L^{0.55}D^{0.59}b^{-0.14}. \end{equation}
A.2.2. Vortex scalings in the leaving case
When the disk is translating away from the wall, the dimensionless coefficient for the maximum circulation
 $c_{\varGamma _m}$
of the starting vortex has been shown by Steiner et al. (Reference Steiner, Morize, Delbende, Sauret and Gondret2025) to follow the scalings
 \begin{equation} c_{\varGamma ,m} = \left \{ \begin{array}{l}\!\! 2.1 \\ \\ \!\! 1.13 \, (L/D)^{-0.18}(b/D)^{-0.28} \end{array} \quad \mathrm{for} \quad (L/D)^{-0.18}(b/D)^{-0.28} \,\left \{ \begin{array}{l} \!\! \lt 1.9, \\ \\ \!\! \gt 1.9. \end{array} \right . \right . \end{equation}
The maximum circulation
 $\varGamma _m$
of the starting vortex in the near-wall configuration for the leaving case can be rewritten in dimensional form as
 \begin{equation} |\varGamma _m| = 1.13 \, L^{1.15}D^{1.12}b^{-0.28}\tau ^{-1}. \end{equation}
The maximum core radius of the starting vortex for the leaving case has been shown by Steiner et al. (Reference Steiner, Morize, Delbende, Sauret and Gondret2025) to remain unchanged from the unbounded case.