Management Implications
Ventenata dubia (Leers) Coss. is a winter annual grass that invaded two Pacific Northwest bunchgrass communities 30 years ago. It is well documented that V. dubia negatively impacts native biodiversity, wildlife habitat, and forage production. Its range is rapidly expanding into new ecosystems: sagebrush steppe and the Great Plains. By describing the patterns of V. dubia’s invasion in Palouse prairie (PP) and canyon grasslands (CG), we provide land managers information about site characteristics associated with V. dubia after its relatively long residence time. These data assist management efforts, including detection, monitoring, and treatment decision making, of new or growing V. dubia infestations.
Within PP and CG, V. dubia was present in communities dominated by bluebunch wheatgrass [Pseudoroegneria spicata (Pursh) Á. Löve], Idaho fescue (Festuca idahoensis Elmer), and the low shrubs common snowberry [Symphoricarpos albus (L.) S.F. Blake] and Wood’s rose (Rosa woodsii Lindl.). Sites dominated by P. spicata had the highest diversity of nonindigenous plant species, suggesting they have been more successfully invaded and are likely less resistant to invasion pressure. High V. dubia cover (>12.5%) was associated with lower indigenous species richness and species evenness in both ecoregions, which should give practitioners pause, as this species may be contributing to indigenous species decline and possible species extinctions. As V. dubia cover increased, perennial bunchgrass abundance decreased. Plant species positively associated with V. dubia were other invasive winter annual grasses common to both dry and moderately wet disturbed habitats, and species negatively associated with V. dubia were shrubs common to very wet habitats. In addition, in both ecoregions, abiotic characteristics associated with V. dubia included shallow soils and a south to west aspect. Together, these data indicate that 30-yr postinvasion, V. dubia is most successful in all but the wettest areas of grassland communities. Ventenata dubia’s invasion into dry and moist sites originally dominated by native perennial plants should be cause for concern as its range expands into sagebrush steppe rangelands and the Great Plains, expansive areas that provide critical value to humans and indigenous biodiversity.
Introduction
Plant invasions typically alter community structure, species interactions, and diversity (Báez and Collins Reference Báez and Collins2008; Castro-Díez et al. Reference Castro-Díez, Pauchard, Traveset and Vilà2016; Gaertner et al. Reference Gaertner, Den Breeyen, Hui and Richards2009). Invaders that reach high abundance and dominate an ecosystem can negatively influence the performance of individual resident species and their population dynamics (Vilà and Weiner Reference Vilà and Weiner2004). Additionally, the presence of invasive species is commonly associated with a coincident decrease in species diversity compared with that in an uninvaded community (Alvarez and Cushman Reference Alvarez and Cushman2002; Hejda et al. Reference Hejda, Pyšek and Jarošík2009). For example, Adams and Engelhardt (Reference Adams and Engelhardt2009) demonstrated that Japanese stiltgrass [Microstegium vimineum (Trin.) A. Camus], an invasive grass, was associated with local declines in species richness and cover of indigenous species in the eastern United States. For these reasons, invasive species are considered one of the top threats to ecosystems globally (Vilà et al. Reference Vilà, Espinar, Hejda, Hulme, Jarošík, Maron, Pergl, Schaffner, Sun and Pyšek2011). As such, knowledge of the biotic and abiotic features of invaded and uninvaded areas is critical to understanding impacts and patterns of successful invasion (Vilà et al. Reference Vilà, Pino and Font2007).
A primary goal of many invasion studies is to understand the relationship between the invader and the resident community (Hejda and de Bello Reference Hejda and de Bello2013; Vitousek and Walker Reference Vitousek and Walker1989). For example, in a study in shrub-steppe communities of the western United States, perennial grass monocultures were the most highly invaded communities, while structurally complex and diverse mixtures of shrubs, perennial grasses, and forbs were more resistant to invasion by three annual grass species: cereal rye (Secale cereale L.), downy brome (Bromus tectorum L.), and jointed goatgrass (Aegilops cylindrica Host) (Allen and Meyer Reference Allen and Meyer2014). In addition, because site characteristics are major components that determine invasion success (Radosevich et al. Reference Radosevich, Stubbs and Ghersa2003; Thuiller et al. Reference Thuiller, Gassó, Pino and Vilà2012; Wallace and Prather Reference Wallace and Prather2013), another goal of invasion studies is to understand the relationship between the invader and the environmental features of its new range (Pfeifer-Meister et al. Reference Pfeifer-Meister, Cole, Roy and Bridgham2008). For example, Hoopes and Hall (Reference Hoopes and Hall2002) found that areas dominated by the invasive grass ripgut brome (Bromus diandrus Roth) had soils with high nitrogen and high water availability. Relating an invader to the biotic and abiotic features of the recipient community serves a dual purpose by providing information that helps explain invasion success while at the same time revealing other sites potentially at risk for invasion.
Assessing and comparing impacts of invasion between similar habitats provides an interesting avenue for exploration. For example, Kalusová et al. (Reference Kalusová, Chytrý, Peet and Wentworth2015) demonstrated that levels of plant invasion had very similar patterns for analogous habitats of North America and Europe. Stohlgren et al. (Reference Stohlgren, Binkley, Chong, Kalkhan, Schell, Bull, Otsuki, Newman, Bashkin and Son1999) found a consistent negative correlation between nonindigenous species richness and indigenous plant species richness and cover in four prairie ecosystems in the north-central US. However, they found the opposite pattern at five forest and meadow ecosystems in the Colorado Rockies. They concluded that there are likely many interacting factors that facilitate invasion, and these factors are not consistent between ecosystems. In support of Stohlgren et al.’s (Reference Stohlgren, Binkley, Chong, Kalkhan, Schell, Bull, Otsuki, Newman, Bashkin and Son1999) findings, a meta-analysis from 204 cases of indigenous–nonindigenous plant richness relationships found high variability at small grain sizes (up to 1,000 m2), such that positive and negative relationships were observed (Peng et al. Reference Peng, Kinlock, Gurevitch and Peng2019). In this study, we compare patterns of invasion in Palouse prairie (PP) and canyon grassland (CG) ecoregions of the Pacific Northwest (PNW). The uplands here are dominated by cool-season perennial bunchgrasses, perennial forbs, and low shrubs but have been invaded by numerous annual plant species (Weddell and Lichthardt Reference Weddell and Lichthardt2000).
Ventenata dubia (Leers) Coss. is a nonindigenous winter annual grass that invades grasslands and pasturelands in the PNW (Pavek et al. Reference Pavek, Wallace and Prather2011). Ventenata dubia is capable of displacing indigenous perennial grasses as well as other invasive, nonindigenous annual grasses, including B. tectorum and medusahead [Taeniatherum caput-medusae (L.) Nevski] (Prather and Burke Reference Prather and Burke2011). It has spread from its initial location in Spokane County, WA, in 1952 (Barkworth et al. Reference Barkworth, Capels and Long1993) to 10 other U.S. states and five Canadian provinces (CABI 2017). As evidenced by herbaria specimen dates of collection, V. dubia likely became established in PP and CG in 1985 and 1991, respectively (Consortium of Pacific Northwest Herbaria 2019). Both ecoregions support several globally rare species, including two plants (Spalding’s silene, Silene spaldingii S. Watson and MacFarlane’s four o’clock, Mirabilis macfarlanei Constance & Rollins) protected by the Endangered Species Act (USFWS 2014). Documented impacts of V. dubia invasion include: (1) a decline in forage production in small pasture, grass-hay, and grassland systems due to displacement of perennial grasses and poor forage value of V. dubia (Prather and Burke Reference Prather and Burke2011); (2) a decline in indigenous species richness in sagebrush steppe communities (Jones et al. Reference Jones, Norton and Prather2018); (3) a decline in nesting success of insectivorous birds due to a loss of biodiversity in northern Idaho conservation lands (Mackey Reference Mackey2014); and (4) a decline in indigenous plants of cultural importance to the Indigenous peoples of the Palouse region (Davis Reference Davis2019).
Characterizing the landscape where V. dubia has been established for more than 30 yr is helpful to understand patterns of invasion and speculate about other regions at risk, regardless of species composition. Furthermore, quantifying whether the plant community composition is different when this species is present in low or high abundance as opposed to when it is absent provides insight into its competitive ability, the resistance to invasion of the resident community, and level of management necessary for control. For this study, we asked: (1) What is the distribution and abundance of V. dubia? (2) How does plant diversity and abundance vary with increasing V. dubia cover? (3) What abiotic and biotic features are associated with V. dubia presence and abundance? (4) What patterns of invasion are similar and different between PP and CG ecoregions? Answers to these questions will help elucidate impacts of V. dubia 30-yr postinvasion and guide efforts to assess other areas at risk for V. dubia invasion. We performed field surveys in 2012, 2013, and 2018 from the PP region and CG region in northern Idaho and eastern Washington to answer these questions. This study parallels one conducted in sagebrush steppe rangelands in 2015, an ecosystem more recently invaded by V. dubia (Jones et al. Reference Jones, Norton and Prather2018).
Materials and Methods
Study Location and Sampling
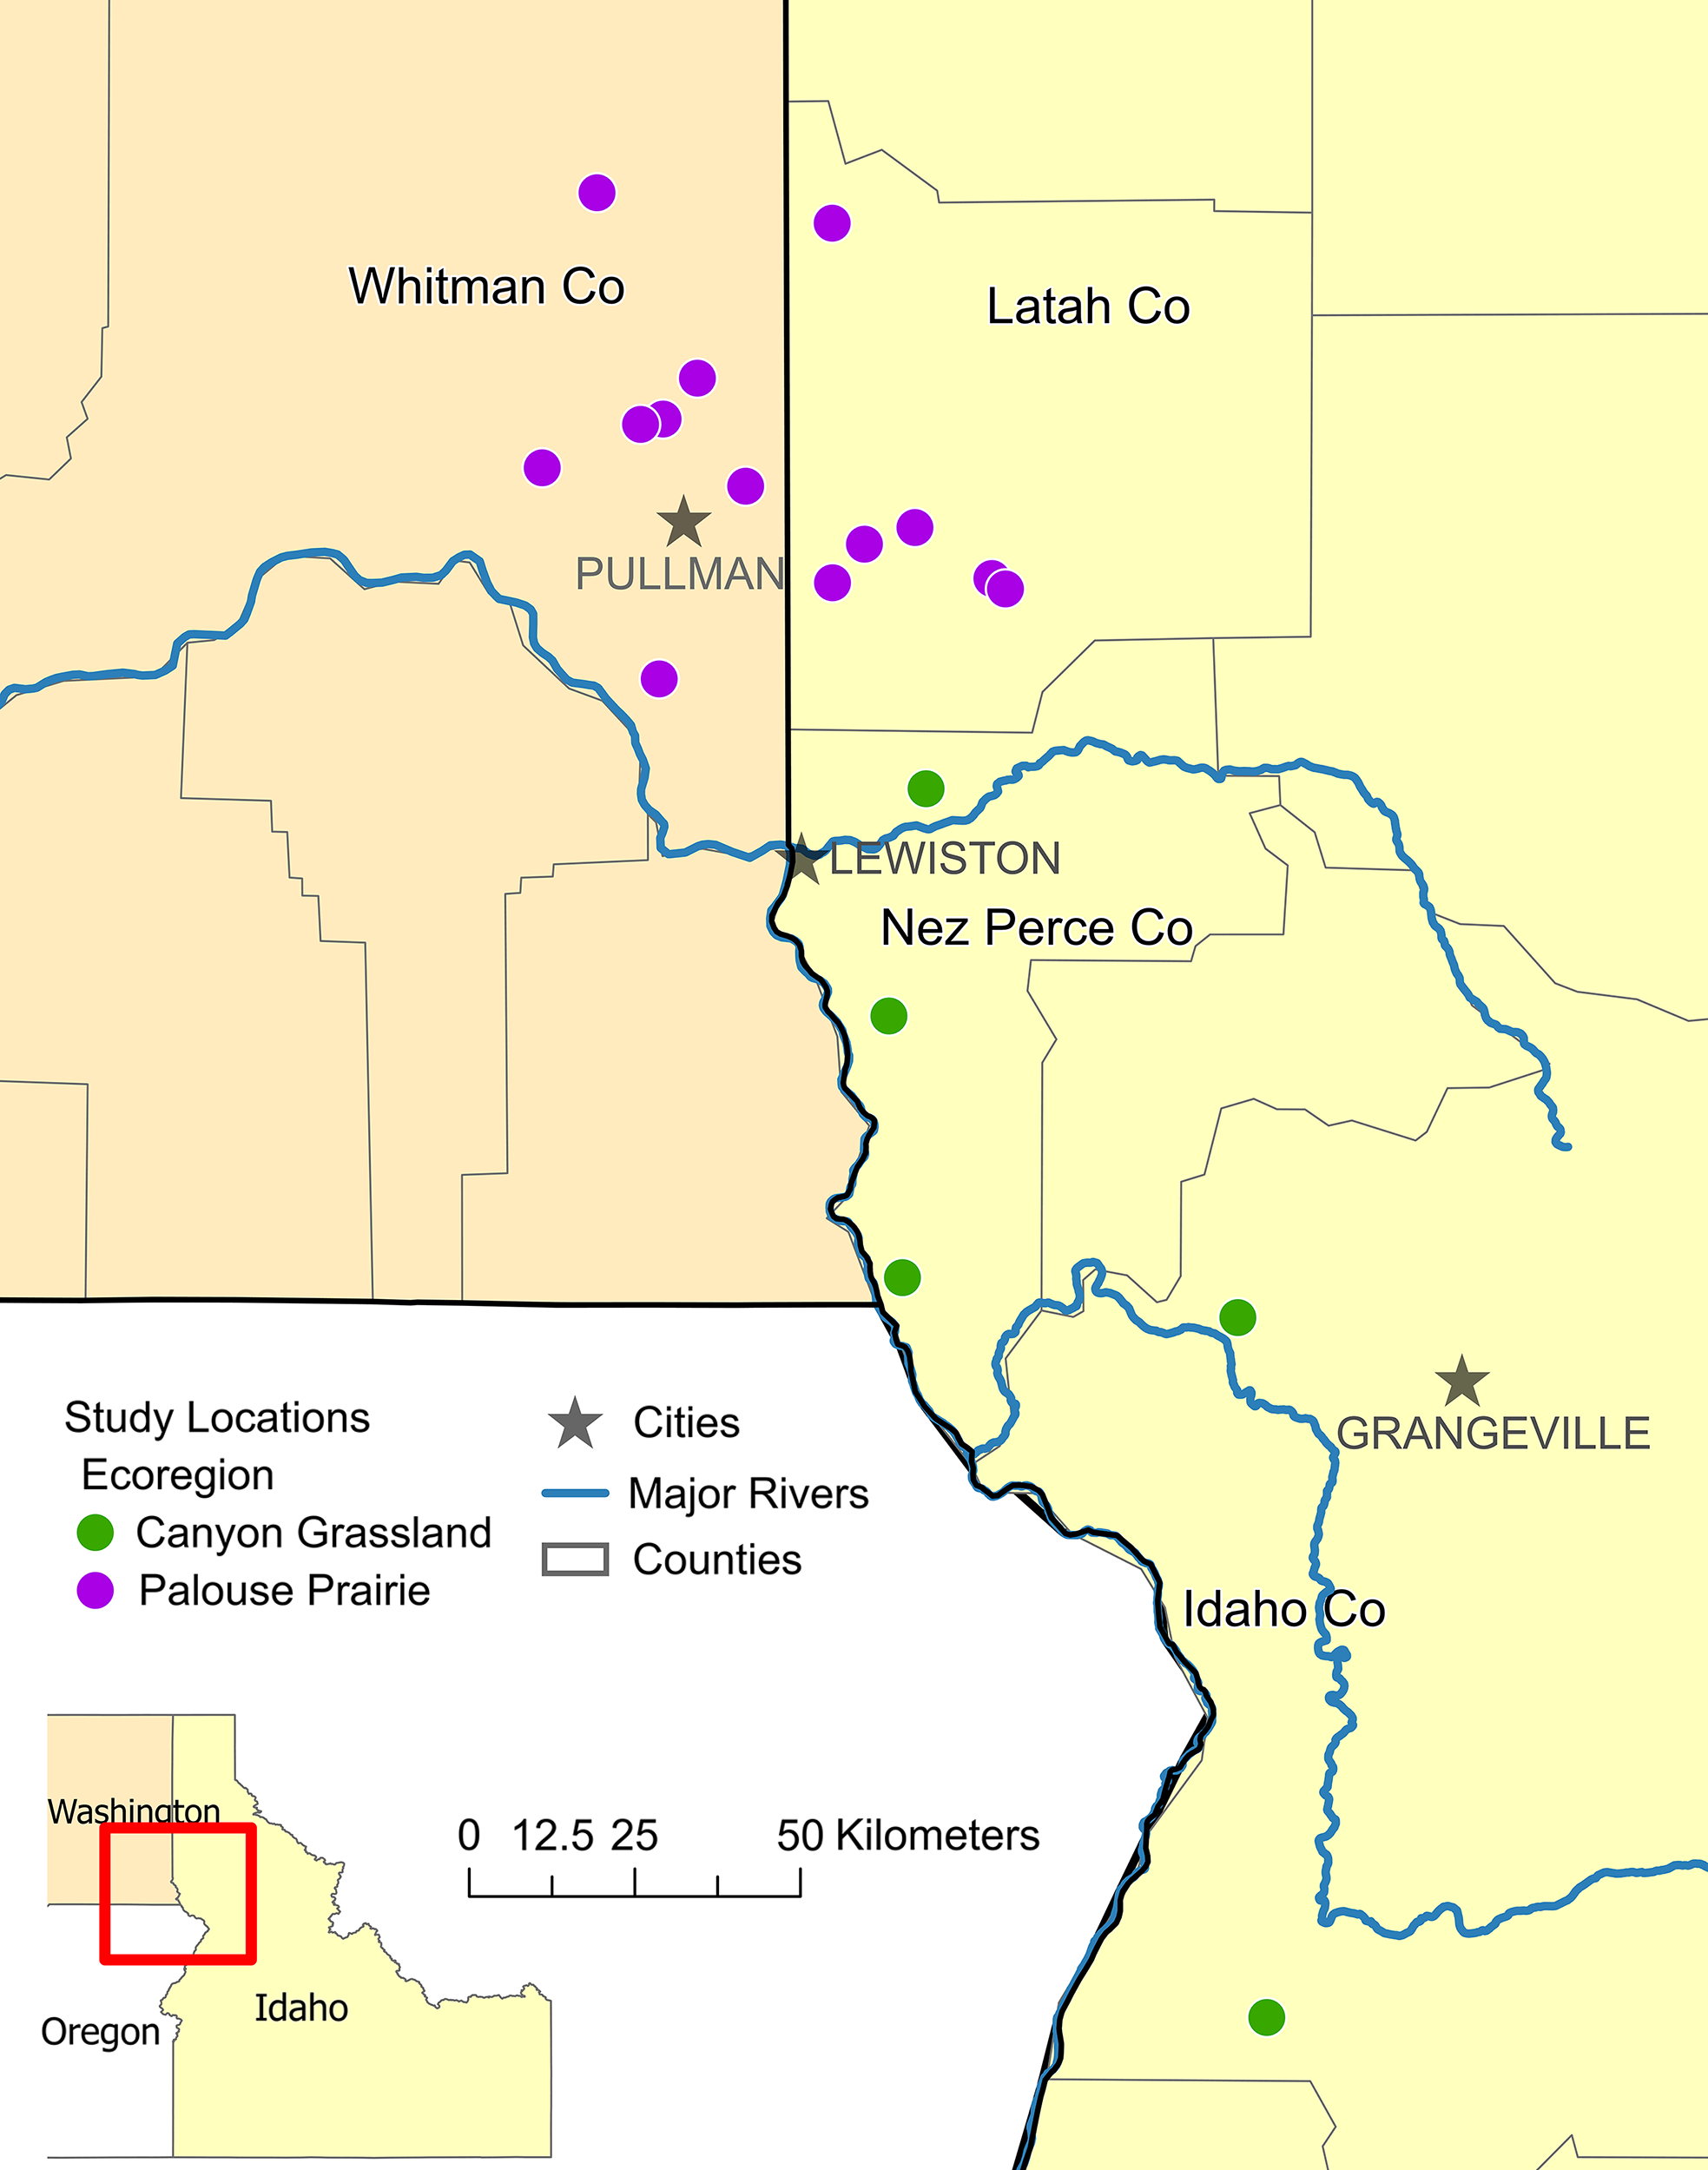
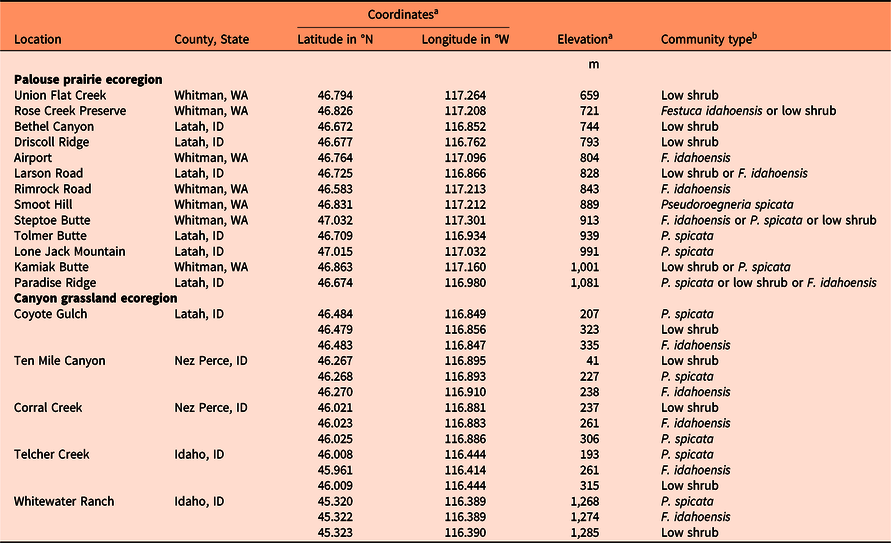
We conducted field surveys in PP from May to July in 2012 and 2013 and in CG from May to August in 2018. PP occurs on relatively mesic loessal soils of northern Idaho and eastern Washington (Weddell and Lichthardt Reference Weddell and Lichthardt1998). Canyon grasslands are south of PP (Figure 1) and constitute a distinct vegetation region of the Columbia Plateau that is characterized by steep topography and great differences in elevation within short distances (Tisdale Reference Tisdale1986; Table 1). Perennial bunchgrasses, forbs, and low shrubs dominate these ecoregions. PP occurs on rolling hills in a wetter and colder climate than CG (Weddell and Lichthardt Reference Weddell and Lichthardt1998). Both systems have historically been degraded by anthropogenic disturbances: PP was mostly converted to cropland, as well as grazed by livestock, and CG were extensively grazed by livestock (Weddell and Lichthardt Reference Weddell and Lichthardt1998). Most remnants of PP are limited to small, isolated parcels on steep, untilled slopes, rocky ridgetops, stream channels, and field margins (Hanson et al. Reference Hanson, Sánchez-de León, Johnson-Maynard and Brunsfeld2008). Based on remote sensing, only 1.7% of the historic PP remains (Davis Reference Davis2019), making it one the United States’ most critically endangered ecoregions (Noss et al. Reference Noss, LaRoe and Scott1995).
Palouse prairie and canyon grassland survey locations in northern Idaho and eastern Washington with county names indicated. See Table 1 for more information specific to each location.

List of locations surveyed, including county and state, global positioning system coordinates, elevation, and plant community type.

a Coordinates and elevation from Palouse prairie are average values from the starting points of up to eight transects placed at each location. Coordinates and elevation from canyon grasslands are average values from the starting points of three transects placed at each location.
b Community types were defined according to important functional groups. Low shrub species include Symphoricarpos albus, Rosa woodsii, and/or Prunus virginiana.
For both ecoregions, 45 transects were analyzed, with 15 each in three habitat types: (1) bluebunch wheatgrass [Pseudoroegneria spicata (Pursh) Á. Löve] dominant, (2) Idaho fescue (Festuca idahoensis Elmer) dominant, or (3) low shrub, primarily common snowberry [Symphoricarpos albus (L.) S.F. Blake] and Wood’s rose (Rosa woodsii Lindl.), dominant. Pseudoroegneria spicata is typically situated on warmer and drier south-facing aspects, while F. idahoensis and low shrubs are typically situated on cooler and wetter north-facing aspects, with the latter inhabiting depressions that retain more moisture (Daubenmire Reference Daubenmire1970; Tisdale Reference Tisdale1986). We sampled these habitat types because they represent the prevailing vegetation in both ecoregions. For the CG surveys, five study locations were chosen for canyons that drain into three major river systems: the Clearwater River, the Salmon River, and the Snake River (Figure 1). This was done to expand the geographic range of sampling and to prohibit limitation of conclusions to only one watershed. Canyon grassland study locations were chosen because they were sites of known V. dubia presence. All sites from both ecoregions were disturbed by historical or contemporary livestock grazing, but disturbance severity was not recorded. Most sites were on privately owned land. The 30-yr (1981 to 2010) average annual precipitation of PP study sites was 609 mm, while for CG study sites it was 500 mm (PRISM Climate Group 2004).
In each region, we sampled five quadrats (i.e., plots; 0.5 m by 0.25 m) along each transect. In PP study sites, we arbitrarily located 12-m-long transects with plots placed at the 1-, 3-, 6-, 9-, and 12-m marks; the direction of the transect was determined randomly. Soil depth was determined as the average depth at four uniformly spaced locations along each transect. Each depth was measured by driving a 2.54-cm-diameter iron rod into the ground until it could no longer penetrate. In CG study sites, we arbitrarily located three, 20-m-long transects within each habitat type with plots placed at the 0-, 5-, 10-, 15-, and 20-m marks. Soil depth was determined as the average depth from eight locations on opposite sides and directly adjacent to the 0-m mark. Each individual depth was determined using the same method as in PP. Unique to the CG ecoregion, soil core samples were collected at the 0-m mark and homogenized so that texture and nutrient analyses could be conducted later. Thus, within each habitat type there were three transects, 15 plots, six soil-depth measurements, and three soil samples. For all study sites, we recorded global positioning system latitude and longitude, elevation, aspect, and slope at the start of each transect. In each plot, percent cover of each vascular plant species, biological soil crust, and abiotic variables (bare ground, rock, litter) were assessed via ocular estimation according to established cover classes: 0%, 1% to 5%, 5% to 12.5%, 12.5% to 25%, 25% to 50%, 50% to 75%, 75% to 95%, 95% to 100%. For subsequent statistical analysis, the median percent from each cover class was used to represent estimates of cover.
A prior study indicated that there was less phosphorous in soil where V. dubia infestation was high compared with areas with low V. dubia infestation (Mackey Reference Mackey2014). Similarly, a study of V. dubia invasion in sagebrush steppe communities correlated high V. dubia cover with low phosphorous, low potassium, and high clay content (Jones et al. Reference Jones, Norton and Prather2018). Because of this possible link between soil texture and fertility and infestation severity, of the 45 soil samples from CG, a subset (n = 18) was analyzed for particle size distribution and available phosphorus and potassium concentrations. The subset was selected based on the V. dubia cover values at the 0-m plot (the plot in closest proximity to the soil sampling site) to provide the best comparison. We analyzed six samples each from plots with no V. dubia, low V. dubia, and high V. dubia. Samples also equally represented the three habitat types surveyed. Available phosphorus and potassium were determined via the Morgan extraction method at the University of Idaho Analytical Science Laboratory.
Statistical Analysis
Within plots, V. dubia foliar cover had natural breaks at 0%, less than 12.5%, or greater than 12.5%, so three classes—none, low (<12.5%), and high (>12.5%)—were used for all analyses. Moreover, as this study complements our 2015 study of V. dubia invasion in sagebrush steppe (Jones et al. Reference Jones, Norton and Prather2018), it is important to conduct the analyses similarly to allow for easy comparison. We tabulated species richness for each of the three V. dubia cover classes using species presence data at the plot level. Because richness conformed to a Poisson distribution, we used a generalized linear model (GLM) to test results for statistical significance and obtained least-squares means to evaluate pairwise multiple comparisons (Lenth Reference Lenth2019). We also evaluated a GLM to analyze species richness across all V. dubia cover classes by the three habitat types to assess whether one habitat was more invaded by V. dubia. In addition, we calculated the Shannon diversity index (Gardener Reference Gardener2014) for each V. dubia cover class using the average percent foliar cover values at the plot level and the R BiodiversityR software package (Kindt and Coe Reference Kindt and Coe2005). The Shannon diversity index considers not only the number of species but their relative abundance within the plots and is better indicator of diversity when rare and abundant species are expected to be equally important (Morris et al. Reference Morris, Caruso, Buscot, Fischer, Hancock, Maier, Meiners, Müller, Obermaier, Prati, Socher, Sonnemann, Wäschke, Wubet, Wurst and Rillig2014). Shannon diversity index values failed to meet assumptions of ANOVA, and data transformations did not remedy the problem, so we used the nonparametric Kruskal-Wallis rank-sum test and the Dunn post hoc test to evaluate pairwise multiple comparisons. Because richness and Shannon diversity values between three levels of V. dubia cover were compared, V. dubia’s own presence and cover were not included in these analyses.
For further insight into species composition, rank abundance models, which consider relative abundances within each ecoregion, were evaluated at the plot level with the best-fit model selected by the radfit function in the R vegan software package (Oksanen et al. Reference Oksanen, Blanchet, Friendly, Kindt, Legendre, McGlinn, Minchin, O’Hara, Simpson, Solymos, Henry, Stevens, Szoecs and Wagner2018). To evaluate indicator species, that is, species whose presence or absence provides information on other species in the system, a chi-squared test with Pearson residuals was evaluated for plants either positively or negatively associated with the three cover classes of V. dubia (Gardener Reference Gardener2014). A nonmetric multidimensional scaling (NMDS) analysis (Oksanen et al. Reference Oksanen, Blanchet, Friendly, Kindt, Legendre, McGlinn, Minchin, O’Hara, Simpson, Solymos, Henry, Stevens, Szoecs and Wagner2018) revealed biotic and abiotic features associated with V. dubia cover. Finally, the relationship between V. dubia cover and soil particle composition, phosphorus concentration, and potassium concentration were analyzed with a linear regression. To standardize the variance, 1 was added to V. dubia cover values, which were then natural log transformed. Outliers were adjusted by reweighting them by 1/studentized residual. All analyses were computed in R v. 3.5.1 (R Core Team 2018).
Results and Discussion
We address the goal of characterizing and comparing the patterns of V. dubia invasion in PP and CG. Specifically, we describe the distribution and abundance of V. dubia, correlate V. dubia cover with habitat type and plant diversity and abundance, and reveal the abiotic and biotic features associated with V. dubia.
Ventenata dubia Distribution
In PP, we found V. dubia at elevations ranging from 659 to 1,129 m and in CG, we found it at elevations ranging from 25 to 1,293 m (Table 1). Ventenata dubia occurred in 58% and 56% of the 225 the plots in PP and CG, respectively. When present, V. dubia cover averaged 26% (±2.3 SE; mean range 0.5% to 67.5%) in PP and 19% (±1.8 SE, mean range 0.5% to 52.8%) in CG (ANOVA F = 6.738, df = 1, P = 0.010). PP is more fertile and wet compared with CG (Tisdale Reference Tisdale1986), possibly providing more favorable conditions for V. dubia to exploit. According to the Consortium of Pacific Northwest Herbaria (2019), the first record of V. dubia in PP is from 1985, while the first record in CG is from 1991. Ventenata dubia was spreading at a rate of 1.2 million ha yr−1 in 2001 (Novak et al. Reference Novak, Cristofaro, Maguire and Sforza2015), so 6 yr of longer residence time could have resulted in a significant increase of V. dubia abundance in PP relative to CG. The amount of V. dubia in PP has increased from the time of sampling to the time of this publication (personal observation).
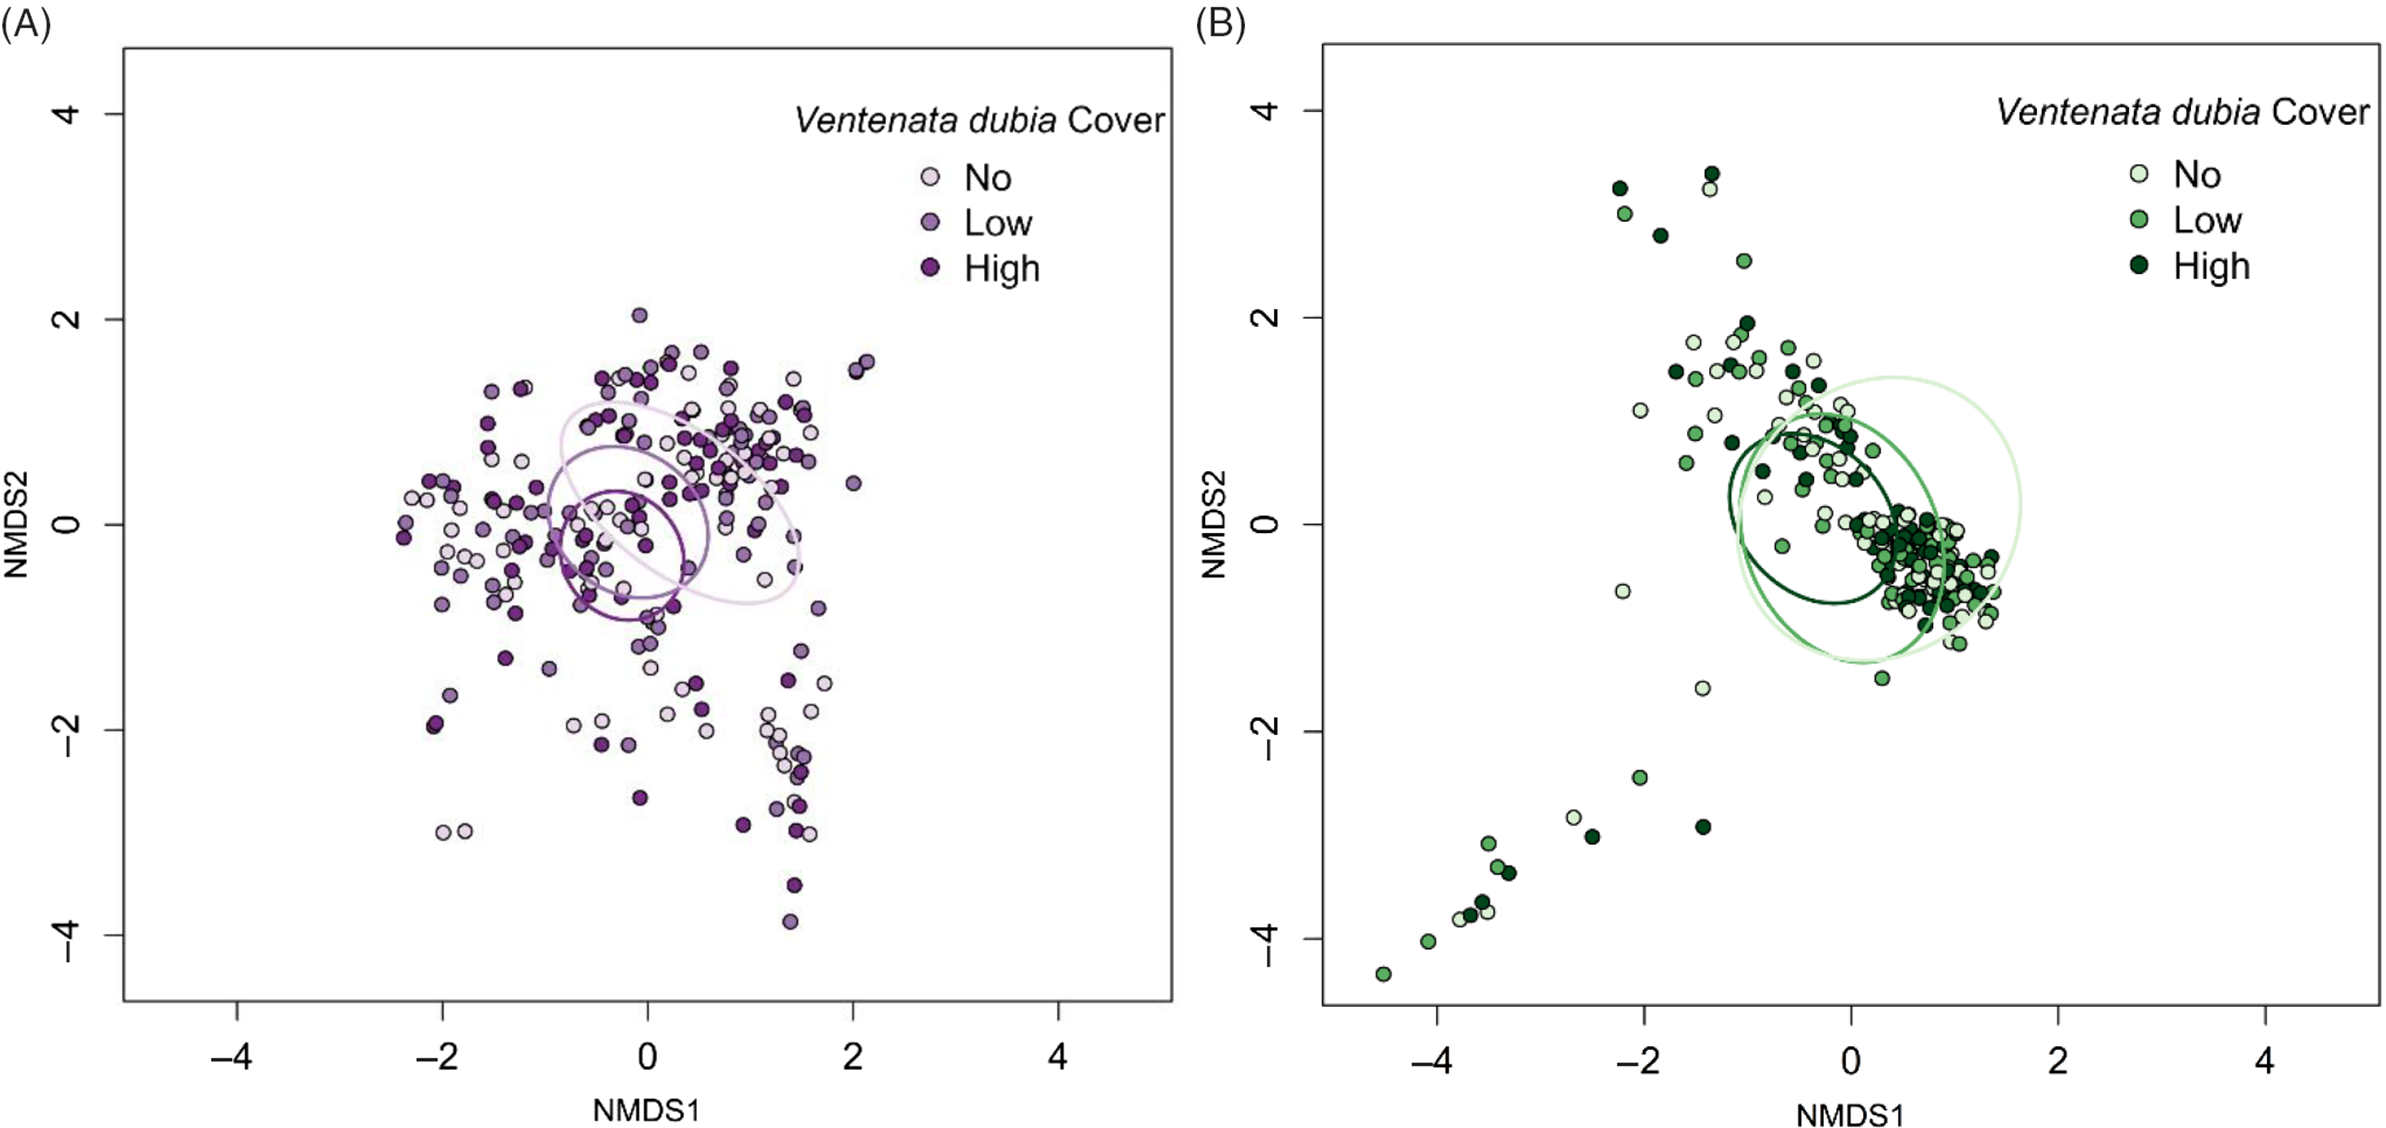
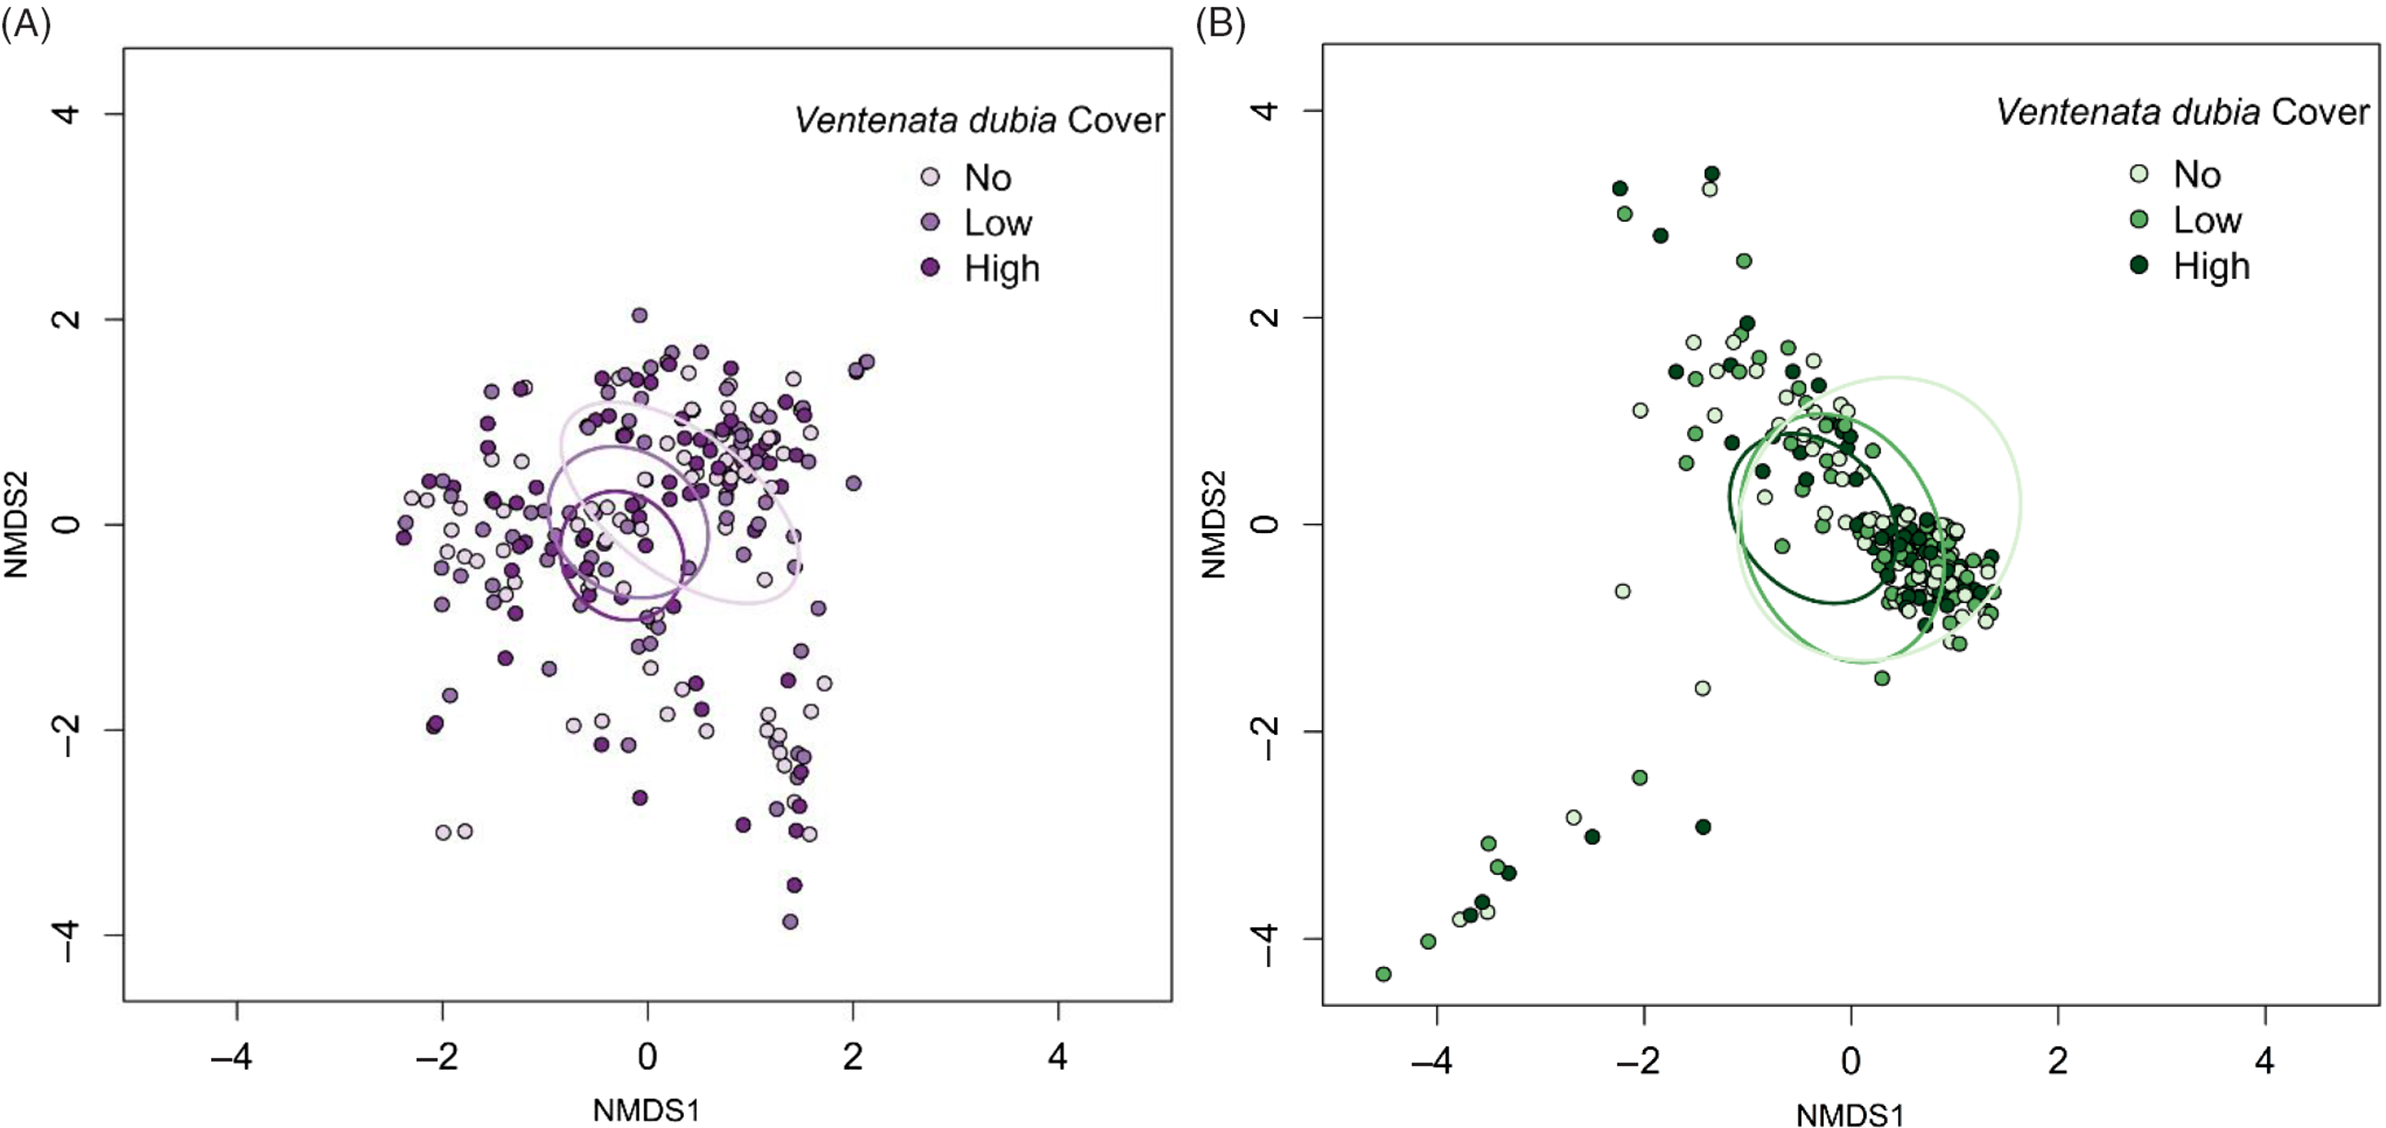
Across ecoregions, average V. dubia cover was greatest in the P. spicata habitat type (16.2% ± 1.8 SE) compared with the F. idahoensis (9.7% ± 1.6 SE) habitat, but no different from the low shrub (12.6% ± 1.8 SE) habitat (Tukey least-squares mean: P. spicata vs. F. idahoensis P = 0.023, P. spicata vs. low shrub P = 0.090, F. idahoensis vs. low shrub P = 0.875). Ventenata dubia’s high cover in P. spicata habitat was evident in PP and CG, while the high cover in low shrub habitat was primarily driven by data from PP. Together, these data indicate that V. dubia can succeed in both dry and wet environments. NMDS analysis of plot-level community data revealed that each of the classes of V. dubia cover was widely distributed in community space and overlapped extensively in both ecoregions (Figure 2A and B).
Nonmetric multidimensional scaling (NMDS) of plant communities in (A) Palouse prairie and (B) canyon grasslands from plots with no Ventenata dubia (light purple/light green), low (<12.5%) V. dubia cover (purple/green), and high (>12.5%) V. dubia cover (dark purple/dark green). Ellipses represent standard deviations of the weighted average of different V. dubia classes at the 95% confidence level.
Species Richness and Diversity
In PP, total species richness was 150 and mean species richness per plot was 6.3 (±0.3 SE), 6.4 (±0.3 SE), and 5.9 (±0.2 SE) for the no, low, and high cover classes, respectively. In CG, total species richness was 105 and mean richness per plot was 6.8 (±0.3 SE), 6.4 (±0.4 SE), and 4.6 (±0.3 SE) for the no, low, and high cover classes, respectively.
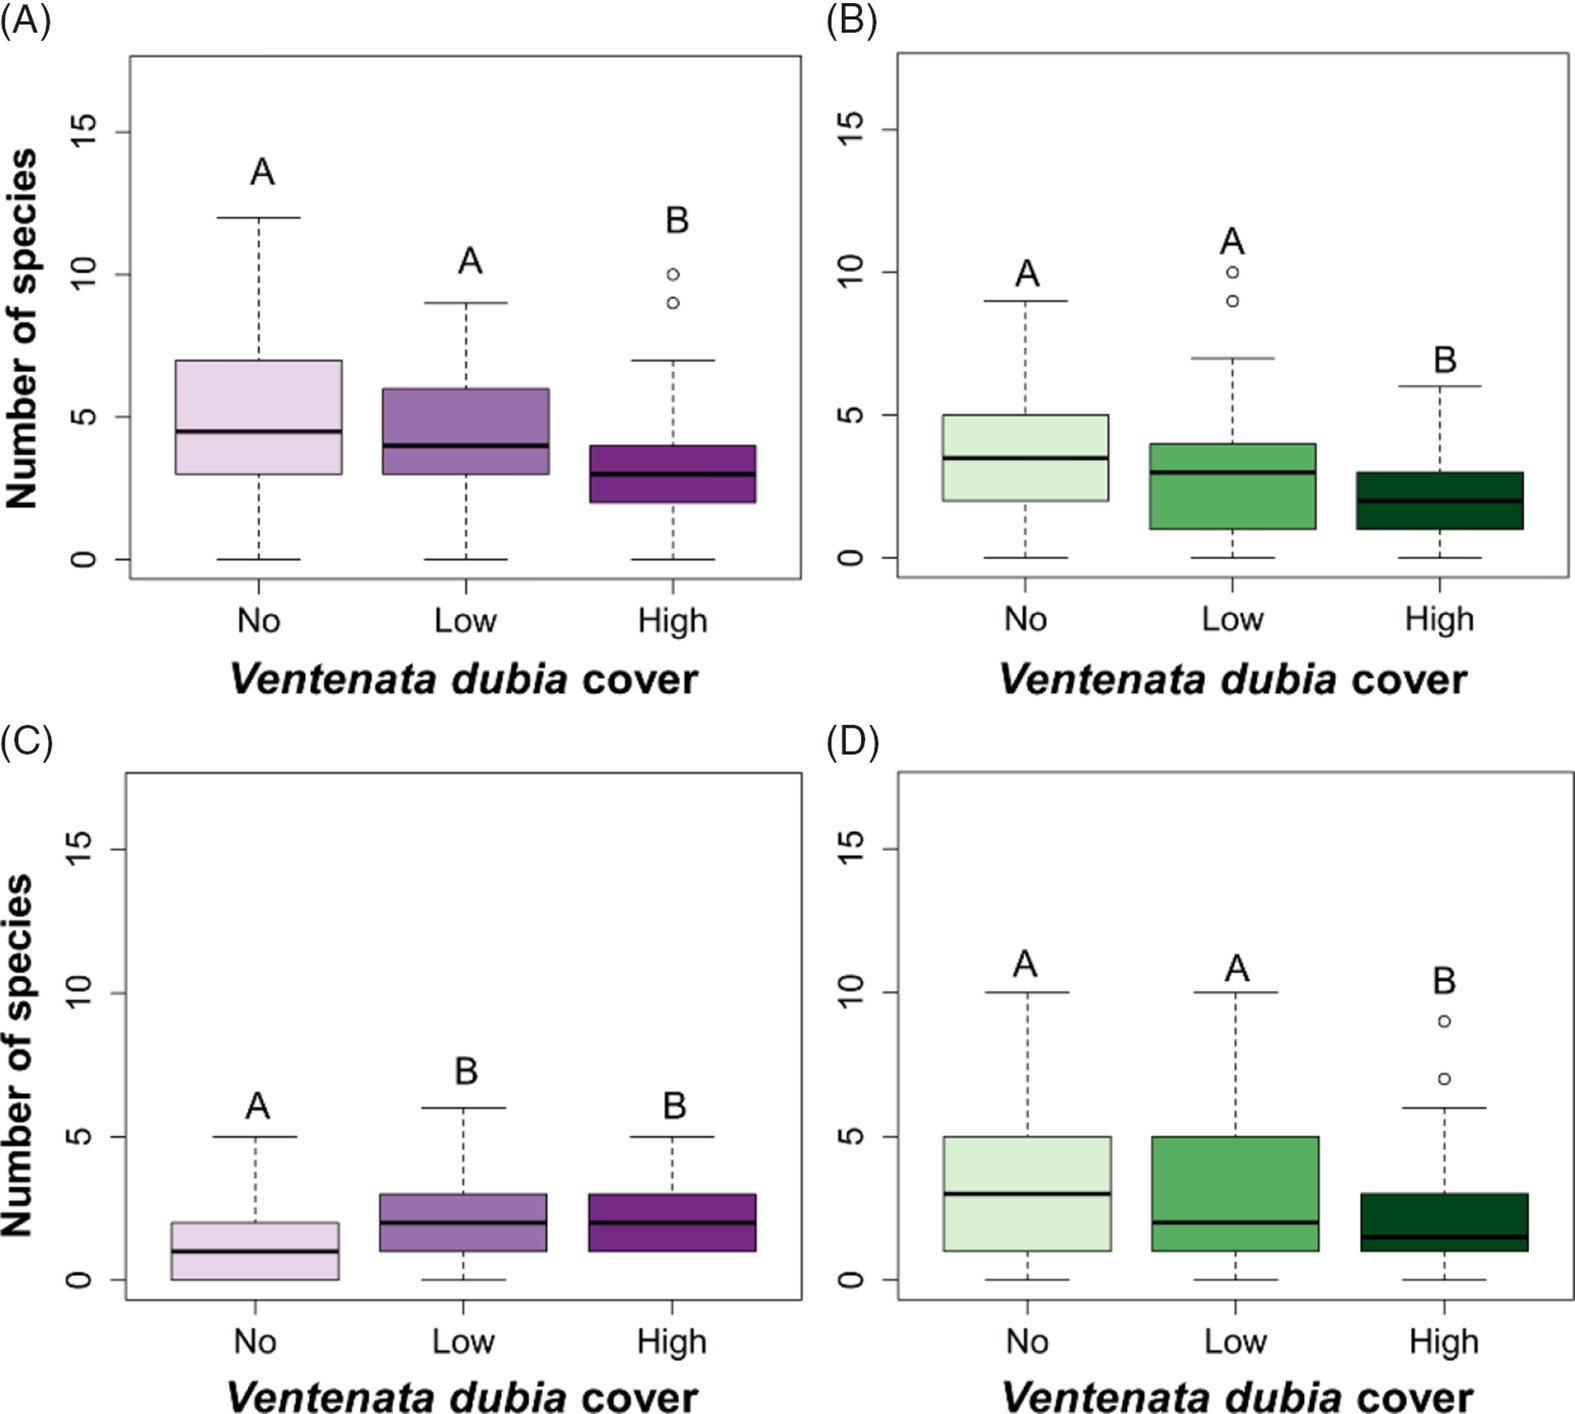
When considering species richness of just indigenous plants, the three classes of V. dubia cover differed in both ecoregions (PP GLM ANOVA: likelihood ratio χ2 = 17.962, df = 2, P < 0.001; Figure 3A; CG GLM ANOVA: likelihood ratio χ2 = 21.634, df = 2, P < 0.001; Figure 3B). Richness was lower in plots with high V. dubia cover compared with plots without V. dubia and plots with low V. dubia cover (PP Tukey least-squares mean: high vs. no P < 0.001, high vs. low P = 0.041; CG Tukey least-squares mean: high vs. no P < 0.001, high vs. low P = 0.018). Richness differences across V. dubia cover classes indicate that high cover of V. dubia was associated with a decline in indigenous plant richness. Invasive species resulting in a decline in indigenous species richness is a commonly documented impact and a key driver of worldwide biodiversity loss (Mack and D’Antonio Reference Mack and D’Antonio1998; Mack et al. Reference Mack, Simberloff, Londsdale, Evans, Clout and Bazzaz2000). Ventenata dubia may either be capable of displacing indigenous species, or in areas that have a lower indigenous species richness to begin with, V. dubia can become dominant. Declines in biodiversity may cause detrimental alterations to ecosystem services such as nutrient storage and cycling, soil health, and wildlife and pollinator habitat (Hooper and Vitousek Reference Hooper and Vitousek1998; Tilman Reference Tilman1999; Tilman et al. Reference Tilman, Lehman and Thomson1997). Thus, we emphasize the importance of maintaining diversity to prevent or limit the invasion of V. dubia in these grassland systems (Bakker and Wilson Reference Bakker and Wilson2004; Kennedy et al. Reference Kennedy, Naeem, Howe, Knops, Tilman and Reich2002). Low cover of V. dubia did not have the same association with decreased richness. There may be a threshold for invader abundance that must be achieved in order to detect a difference in indigenous species richness (Gooden et al. Reference Gooden, French, Turner and Downey2009; Grice Reference Grice2004).
Box plots of species richness in (A, C) Palouse prairie and (B, D) canyon grasslands of (A, B) indigenous plants and (C, D) nonindigenous plants within sample plots with no, low (<12.5%), and high (>12.5%) Ventenata dubia cover. Groups with different letters are statistically different (α = 0.05).

Indigenous species richness between habitat types differed in both ecoregions (PP GLM ANOVA: likelihood ratio χ2 = 42.508, df = 2, P < 0.001; CG GLM ANOVA: likelihood ratio χ2 = 72.355, df = 2, P < 0.001). In PP, indigenous species richness was highest in F. idahoensis habitats (5.5 ± 0.3) compared with P. spicata (4.0 ± 0.2) and low shrub habitats (3.4 ± 0.3) (Table 2). In CG, indigenous species richness was highest in low shrub habitats (4.6 ± 0.3) compared with P. spicata (2.4 ± 0.2) and F. idahoensis habitats (2.5 ± 0.2) (Table 2). Together, these findings suggest that areas dominated by F. idahoensis (typically north-facing slopes) in the PP ecoregion and areas dominated by low shrubs in CG maintain a high level of indigenous plant biodiversity and are likely more resistant to invasion.
Tukey least-squares mean pairwise comparisons of species richness between habitat types dominated by Festuca idahoensis, Pseudoroegneria spicata, or low shrub species.

a When the contrast P-value is <0.05, the habitat type in bold has the higher species richness.
b Festuca idahoensis habitat had higher species richness in the Palouse prairie ecoregion; low shrub habitat had higher species richness in the canyon grassland ecoregion.
Among nonindigenous species in both ecoregions, there was a difference in richness between the V. dubia cover classes (PP GLM ANOVA: likelihood ratio χ2 = 24.381, df = 2, P < 0.001; Figure 3C; CG GLM ANOVA: likelihood ratio χ2 = 14.49, df = 2, P < 0.001; Figure 3D). In PP, nonindigenous plant richness was lower in plots with no V. dubia compared with plots with low and high V. dubia cover (Tukey least-squares mean: no vs. high P < 0.001, no vs. low P = 0.007; Figure 3C). Richness differences across V. dubia cover classes suggest a positive correlation between the presence of V. dubia and other nonindigenous species. The increase in nonindigenous species richness with increasing V. dubia could indicate a positive feedback system whereby the presence of one or more nonindigenous species alters ecosystem dynamics related to disturbance regimes, hydrologic cycles, or nutrient cycling, which in turn promotes other nonindigenous species (Yelenik and D’Antionio Reference Yelenik and D’Antonio2013). In addition, the nonindigenous species assemblage of PP may poorly monopolize available resources, thereby permitting more nonindigenous species to coexist (Stohlgren et al. Reference Stohlgren, Binkley, Chong, Kalkhan, Schell, Bull, Otsuki, Newman, Bashkin and Son1999). In PP, when V. dubia cover was high, indigenous species richness was low and nonindigenous species richness was high. Peng et al. (Reference Peng, Kinlock, Gurevitch and Peng2019) demonstrated that on average, studies in grasslands had negative relationships between nonindigenous and indigenous plant species richness. In CG, the nonindigenous species richness pattern was opposite that of PP, in that richness was lower in plots with high V. dubia cover compared with plots without V. dubia and plots with low V. dubia cover (Tukey least-squares mean: high vs. no P = 0.003, high vs. low P = 0.002; Figure 3D). The negative correlation between V. dubia cover and nonindigenous species richness suggests that when V. dubia was abundant, it was the dominant nonindigenous species present. Other ecologists also present evidence of invaders decreasing diversity of nonindigenous species in a variety of ecosystems (LeBrun et al. Reference LeBrun, Abbott and Gilbert2013; Powell et al. Reference Powell, Chase and Knight2011).
Nonindigenous species richness between habitat types differed in both ecoregions (PP GLM ANOVA: likelihood ratio χ2 = 11.258, df = 2, P = 0.004; CG GLM ANOVA: likelihood ratio χ2 = 29.158, df = 2, P < 0.001). In PP, nonindigenous species richness was highest in P. spicata habitats (2.9 ± 0.2) compared with F. idahoensis habitats (2.0 ± 0.2) (Table 2), but no different from low shrub habitats (2.4 ± 0.2). In CG, nonindigenous species richness was highest in P. spicata habitats (3.8 ± 0.3) compared with both F. idahoensis (2.3 ± 0.3) and low shrub habitats (2.8 ± 0.3) (Table 2). Together, these findings suggest that in both ecoregions, areas dominated by P. spicata (typically south-facing slopes), have been more successfully invaded and are likely less resistant to invasion pressure. This finding corresponds with Pack’s (Reference Pack2015) observations of V. dubia invasion in the Hells Canyon National Recreation Area.
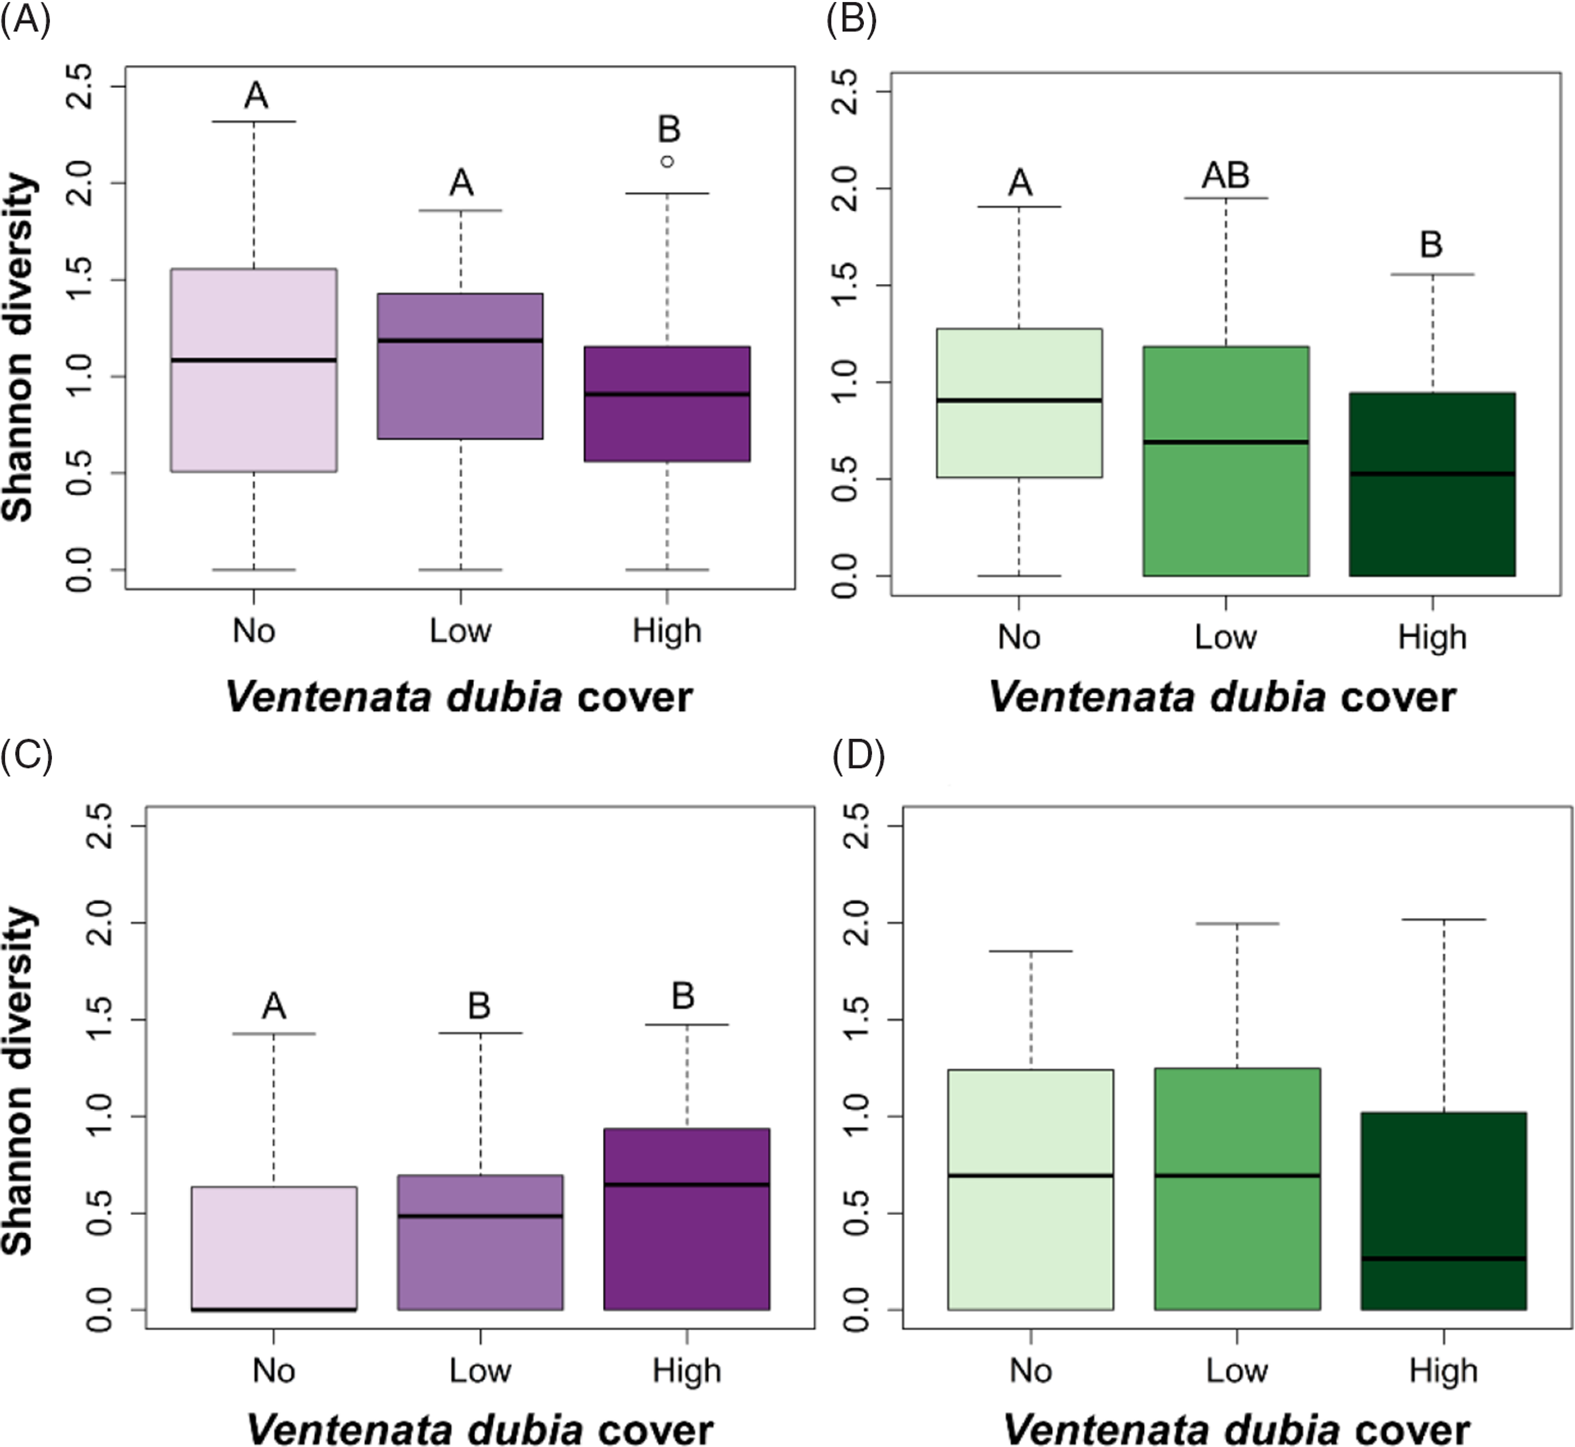
In both ecoregions, the trends for Shannon’s diversity (“diversity”) values were weaker than those from species richness, as there was more variability within the three V. dubia cover classes (Figure 4A–D) relative to observed species richness values.
Box plots of average Shannon diversity indices in (A, C) Palouse prairie and (B, D) canyon grasslands of (A, B) indigenous plants and (C, D) nonindigenous plants within sample plots with no, low (<12.5%), and high (>12.5%) Ventenata dubia cover. Groups with different letters are statistically different (α = 0.05). Higher diversity values indicate greater plant species richness and evenness.

Among indigenous species in PP, diversity values between cover classes differed (Kruskal-Wallis rank sum: χ2 = 7.397, df = 2, P = 0.025; Figure 4A), with diversity lowest in plots with high cover of V. dubia (Dunn post hoc: no vs. low P = 0.862, no vs. high P = 0.048, low vs. high P = 0.042). In CG, diversity values between cover classes differed (Kruskal-Wallis rank sum: χ2 = 11.563, df = 2, P = 0.003; Figure 4B), with diversity lowest in plots with high cover of V. dubia compared with plots with no V. dubia (Dunn post hoc: no vs. low P = 0.166, no vs. high P = 0.002, low vs. high P = 0.106).
Among nonindigenous species, diversity was different in PP (Kruskal-Wallis rank sum: χ2 = 21.865, df = 2, P < 0.001; Figure 4C), but not different in CG (Kruskal-Wallis rank sum: χ2 = 5.160, df = 2, P = 0.076; Figure 4D). In PP, diversity increased as V. dubia cover increased (Dunn post hoc: no vs. low P = 0.034, no vs. high P < 0.001, low vs. high P = 0.060). Landscape metrics (e.g., patch size) could explain the association of increased nonindigenous species diversity with high V. dubia cover. PP remnants are typically small and isolated; in this ecoregion, Davis (Reference Davis2015) found a negative correlation between patch size and plant diversity.
In both ecoregions, there was more variability in diversity values than in simple richness values, indicating high variability in species evenness. Shannon diversity patterns in each system were similar to what we observed with richness data, in that high V. dubia cover was correlated with increased nonindigenous plant diversity in PP and decreased indigenous plant diversity in CG.
Species Rank Abundance
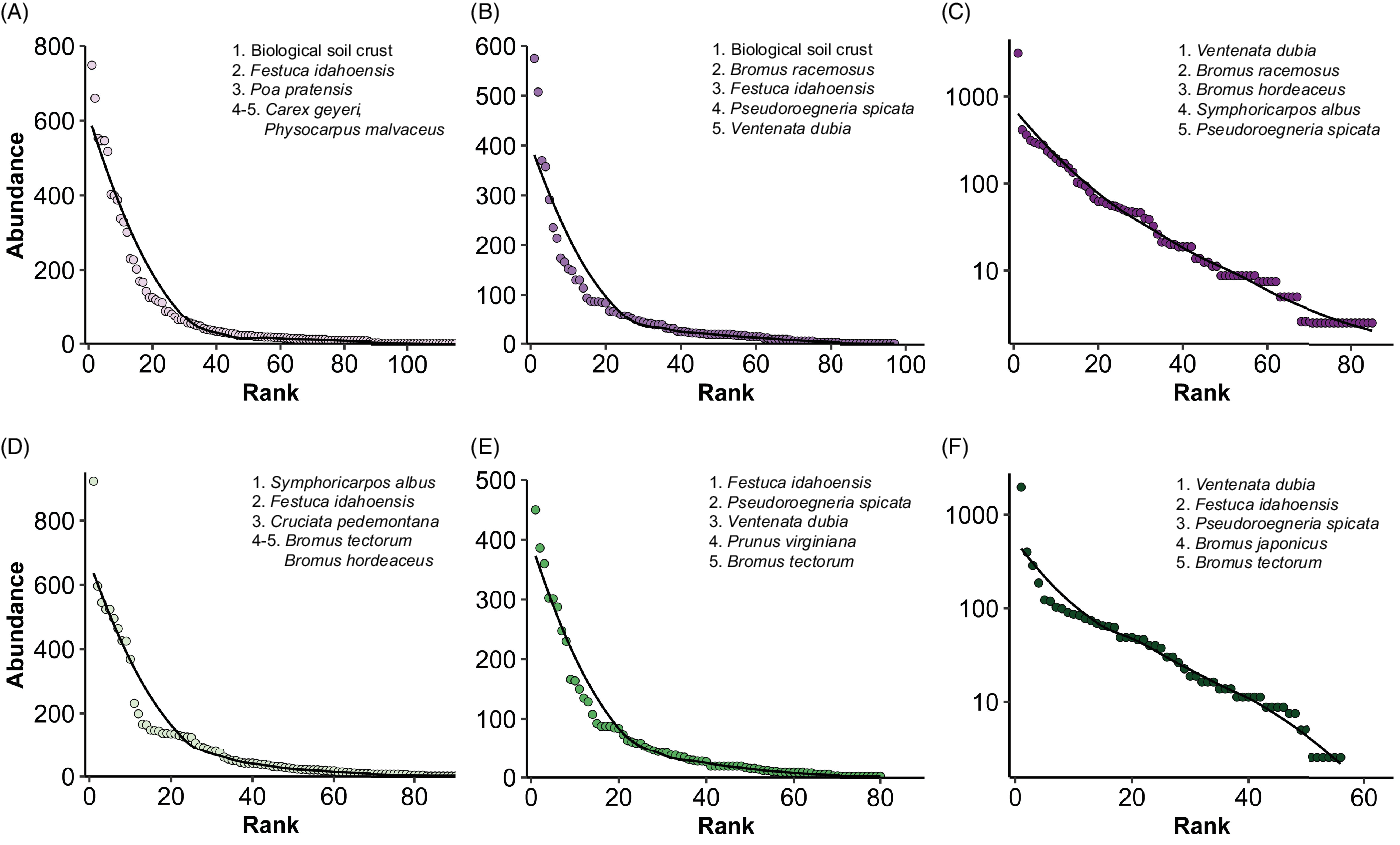
Next, rank abundance models were used to elucidate the dominant species present within plots stratified by the three V. dubia cover classes. In both ecoregions, these models showed that as V. dubia cover increased, perennial bunchgrass abundance decreased (Figure 5A–F). However, with increasing V. dubia, invasive annual Bromus spp. abundance increased in PP but decreased in CG, concordant with richness and diversity data. The association of high V. dubia abundance with high winter annual grass abundance could be an example of invasive plant succession or the creation of novel plant communities.
Rank abundance models in Palouse prairie (A–C) and canyon grasslands (D–F) of plots (A, D) with no Ventanata dubia, (B, E), low (<12.5%) V. dubia cover, and (C, F) high (>12.5%) V. dubia cover across all sites. The solid line represents the best-fit model for each data set and a selection of the most abundant species have been listed in order starting with the highest rank to better reveal differences in community structure. Note changes to the scale of the y axis scale as V. dubia cover increases.

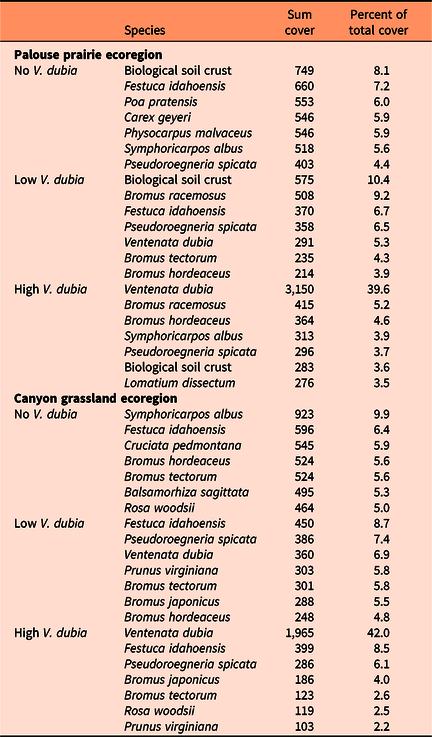
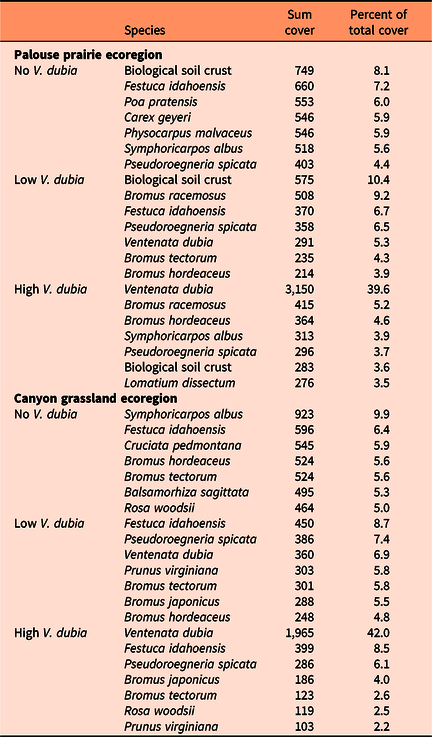
In PP, in plots with no and low V. dubia cover, biological soil crust, including mosses and lichens, was the most abundant (Figure 5A and B). The high rank of biological soil crust indicates the presence of moist microsites, as biological crusts can produce a rough surface microtopography that acts as a detention structure for water, which can increase water infiltration (USDI 2001). In PP, higher cover of biological soil crust was observed on shallow soils. The high rank of biological soil crust with no and low V. dubia cover may be linked to past disturbance regimes where surface rocks of shallow soils acted as an armoring mechanism that protected biological soil crust, thereby reducing opportunities for V. dubia establishment (Davis Reference Davis2015). In CG, in plots with no and low V. dubia cover, S. albus and F. idahoensis were the respective highest-ranking plants (Figure 5D and E). Thus, sites with high cover of biological soil crust, S. albus, or F. idahoensis may be more resistant to invasion by V. dubia. In plots with high V. dubia cover, V. dubia was the most abundant species, with a sum cover five to seven times higher than the next most abundant species (Figure 5C and F). Notably, in both ecoregions, even when V. dubia was highly abundant, indigenous plants were still highly ranked (Figure 5C and F), although their proportional cover was lower compared with their cover in the other V. dubia cover classes (Table 3). The high ranking of indigenous plants when V. dubia cover was high could indicate a possible lag effect in the invasion process. Notably, in PP, S. albus and P. spicata rank fourth and fifth, while in CG, F. idahoensis and P. spicata rank second and third. Because S. albus and F. idahoensis inhabit wetter niches, while P. spicata inhabits drier niches, their maintained high rankings with high cover of V. dubia suggest a generalist moisture niche of V. dubia.
Sum cover values and proportional rank abundances of the most abundant species across all plots in Palouse prairie and canyon grasslands stratified by Ventenata dubia cover classes (low <12.5%, high >12.5%).
In both ecoregions, total V. dubia cover was greater than the total cover of the other invasive annual grasses combined, suggesting that V. dubia is the dominant annual grass in these systems. However, this conclusion must be taken with caution, because site selection was not random. In PP, V. dubia appeared to coexist better with other annual grasses, which could be because PP is more fertile than CG (Tisdale Reference Tisdale1986). This fertility can enhance the ability of species belonging to the same functional group (i.e., winter annual grasses) to coexist (Hobbs and Huenneke Reference Hobbs and Huenneke1992). Furthermore, this region is prominent for supporting dryland grain crops (Hanson et al. Reference Hanson, Sánchez-de León, Johnson-Maynard and Brunsfeld2008), indicating that it is particularly well suited to sustaining annual grasses.
Indicator Species
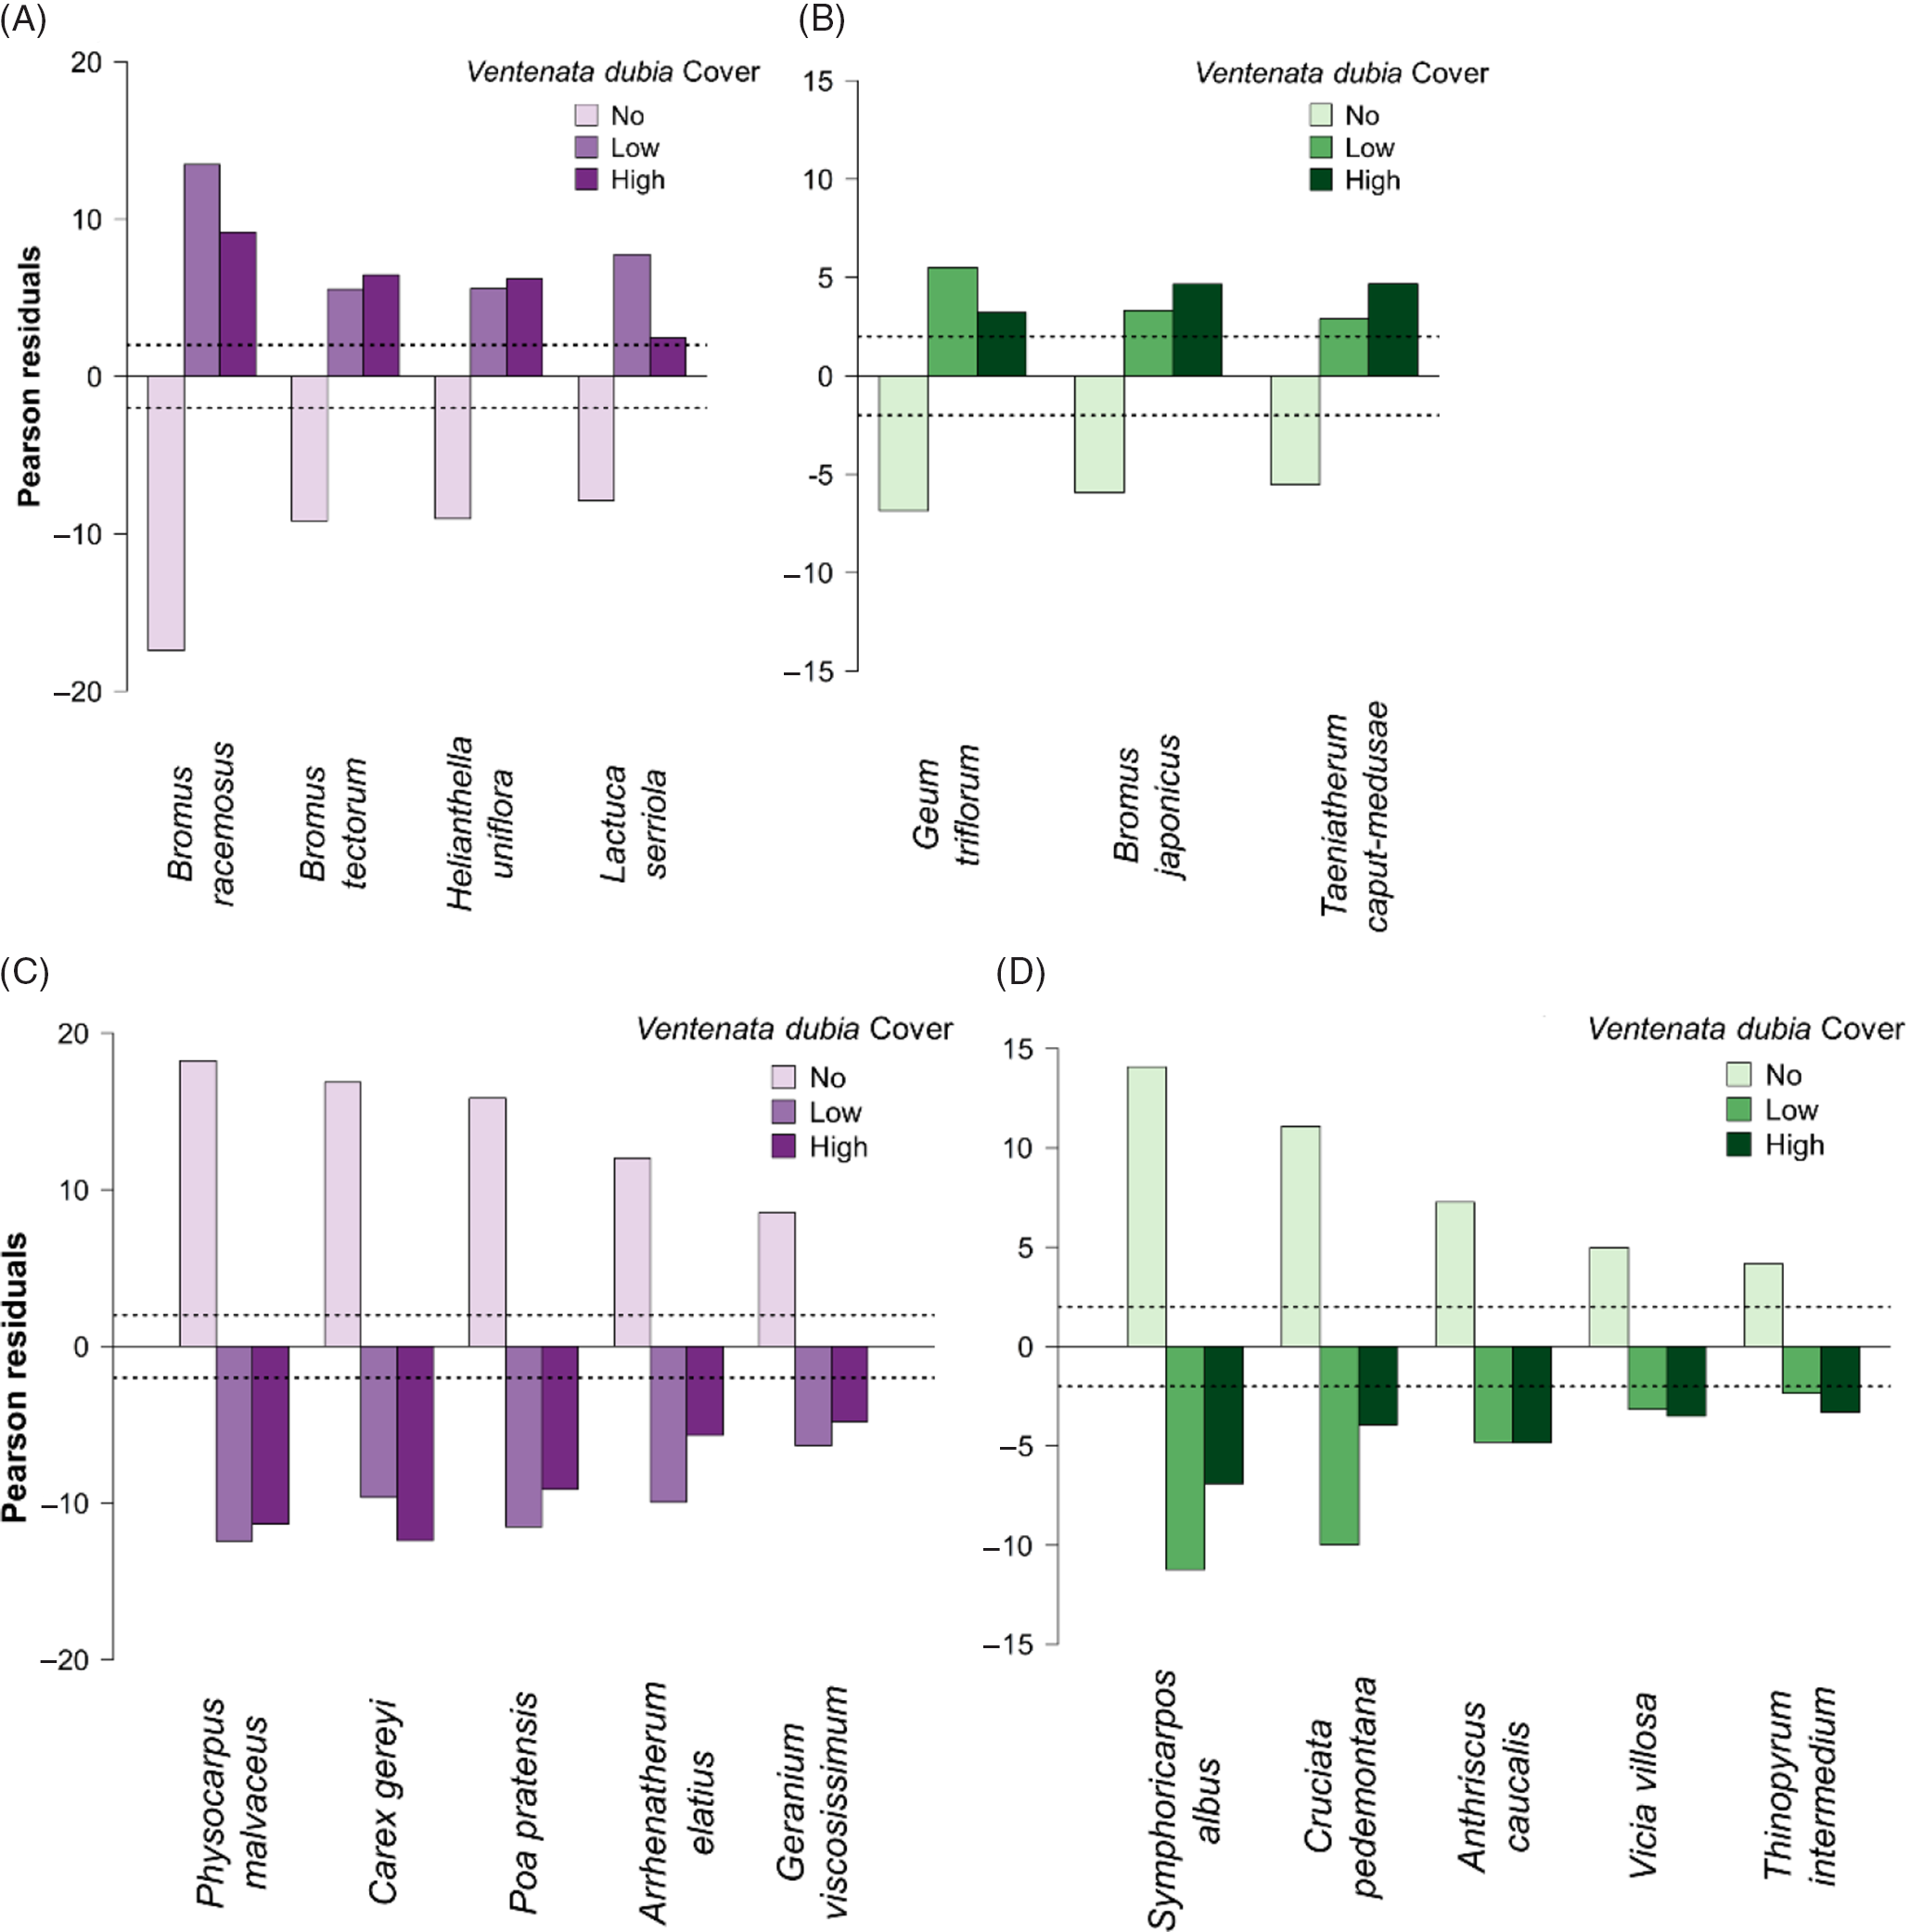
Chi-squared indicator analysis revealed the presence of several species positively or negatively correlated with V. dubia (Figure 6). In PP, species positively associated with V. dubia included bald brome (Bromus racemosus L.), B. tectorum, oneflower helianthella [Helianthella uniflora (Nutt.) Torr. & A. Gray], and prickly lettuce (Lactuca serriola L.) (Figure 6A). The Bromus spp. and L. serriola are annual weeds of dry areas. Because B. racemosus residuals most strongly deviated from 2 and −2 in PP, the presence of B. racemosus can be used to infer a higher likelihood for V. dubia invasion. In CG, species positively associated with V. dubia included prairie smoke (Geum triflorum Pursh), Japanese brome (Bromus japonicus Thunb.), and T. caput-medusae (Figure 6B). The last two are nonindigenous winter annual grasses, while G. triflorum is an indigenous forb associated with relatively moist, early-successional communities (Munger Reference Munger2006). Because V. dubia was equally associated with these three species, their presence can be used to infer a higher likelihood for V. dubia invasion in CG. More generally, in both ecoregions, positive indicators of V. dubia are more common to early-seral, disturbed habitats.
Indicator species in relation to Ventenata dubia cover classes across all survey plots in (A, C) Palouse prairie and (B, D) canyon grasslands. (A and B) Positive indicator species are defined as those with significantly negative Pearson residuals (<−2) in plots without V. dubia, and significantly positive Pearson residuals (>2) in plots with low (<12.5%) and high (>12.5%) V. dubia cover. (C and D) Conversely, negative indicator species are defined as those with significantly positive Pearson residuals (>2) in plots without V. dubia, and significantly negative Pearson residuals (<−2) in plots with low and high V. dubia cover. Pearson residuals define the degree of departure between expected and observed values. Values that deviate farther from −2 and 2 indicate stronger (dis)associations.

Conversely, species negatively associated with V. dubia in PP included mallow ninebark [Physocarpus malvaceus (Greene) Kuntze], Geyer’s sedge (Carex geyeri Boott), Kentucky bluegrass (Poa pratensis L.), tall oatgrass [Arrhenatherum elatius (L.) P. Beauv. ex J. Presl & C. Presl], and sticky purple geranium (Geranium viscosissimum Fisch. & C.A. Mey. ex C.A. Mey) (Figure 6C). These associations indicate that in PP, V. dubia was less likely to occur in very moist shrub and perennial grass habitats. In CG, species negatively associated with V. dubia included S. albus, piedmont bedstraw [Cruciata pedemontana (Bellardi) Ehrend.], bur chervil (Anthriscus caucalis M. Bieb.), hairy vetch (Vicia villosa Roth), and intermediate wheatgrass [Thinopyrum intermedium (Host) Barkworth & D.R. Dewey] (Figure 6D). In canyon grassland, species indicating an absence of V. dubia were those that inhabit very moist areas, with most being nonindigenous species (USDA-NRCS 2019). In both ecoregions, the presence of low shrubs (P. malvaceus and S. albus) strongly indicated an absence of V. dubia, likely because shrubs are better competitors.
While we did not measure soil moisture, the indicator species results suggest that V. dubia occurred with other species that inhabit both dry and moderately wet, disturbed areas, whereas it did not occur in the very wettest areas able to support shrubs. Interestingly, only in PP was V. dubia associated with B. tectorum, even though B. tectorum was also very common in the canyon grassland study area. This observation could be because PP receives an average of approximately 100 mm more precipitation per year than canyon grassland (PRISM Climate Group 2004). Because V. dubia and B. tectorum take advantage of early spring moisture (Pavek et al. Reference Pavek, Wallace and Prather2011), one could speculate that PP typically has more soil moisture for both species to access without harm to the other species.
Community Space and Associated Abiotic Features
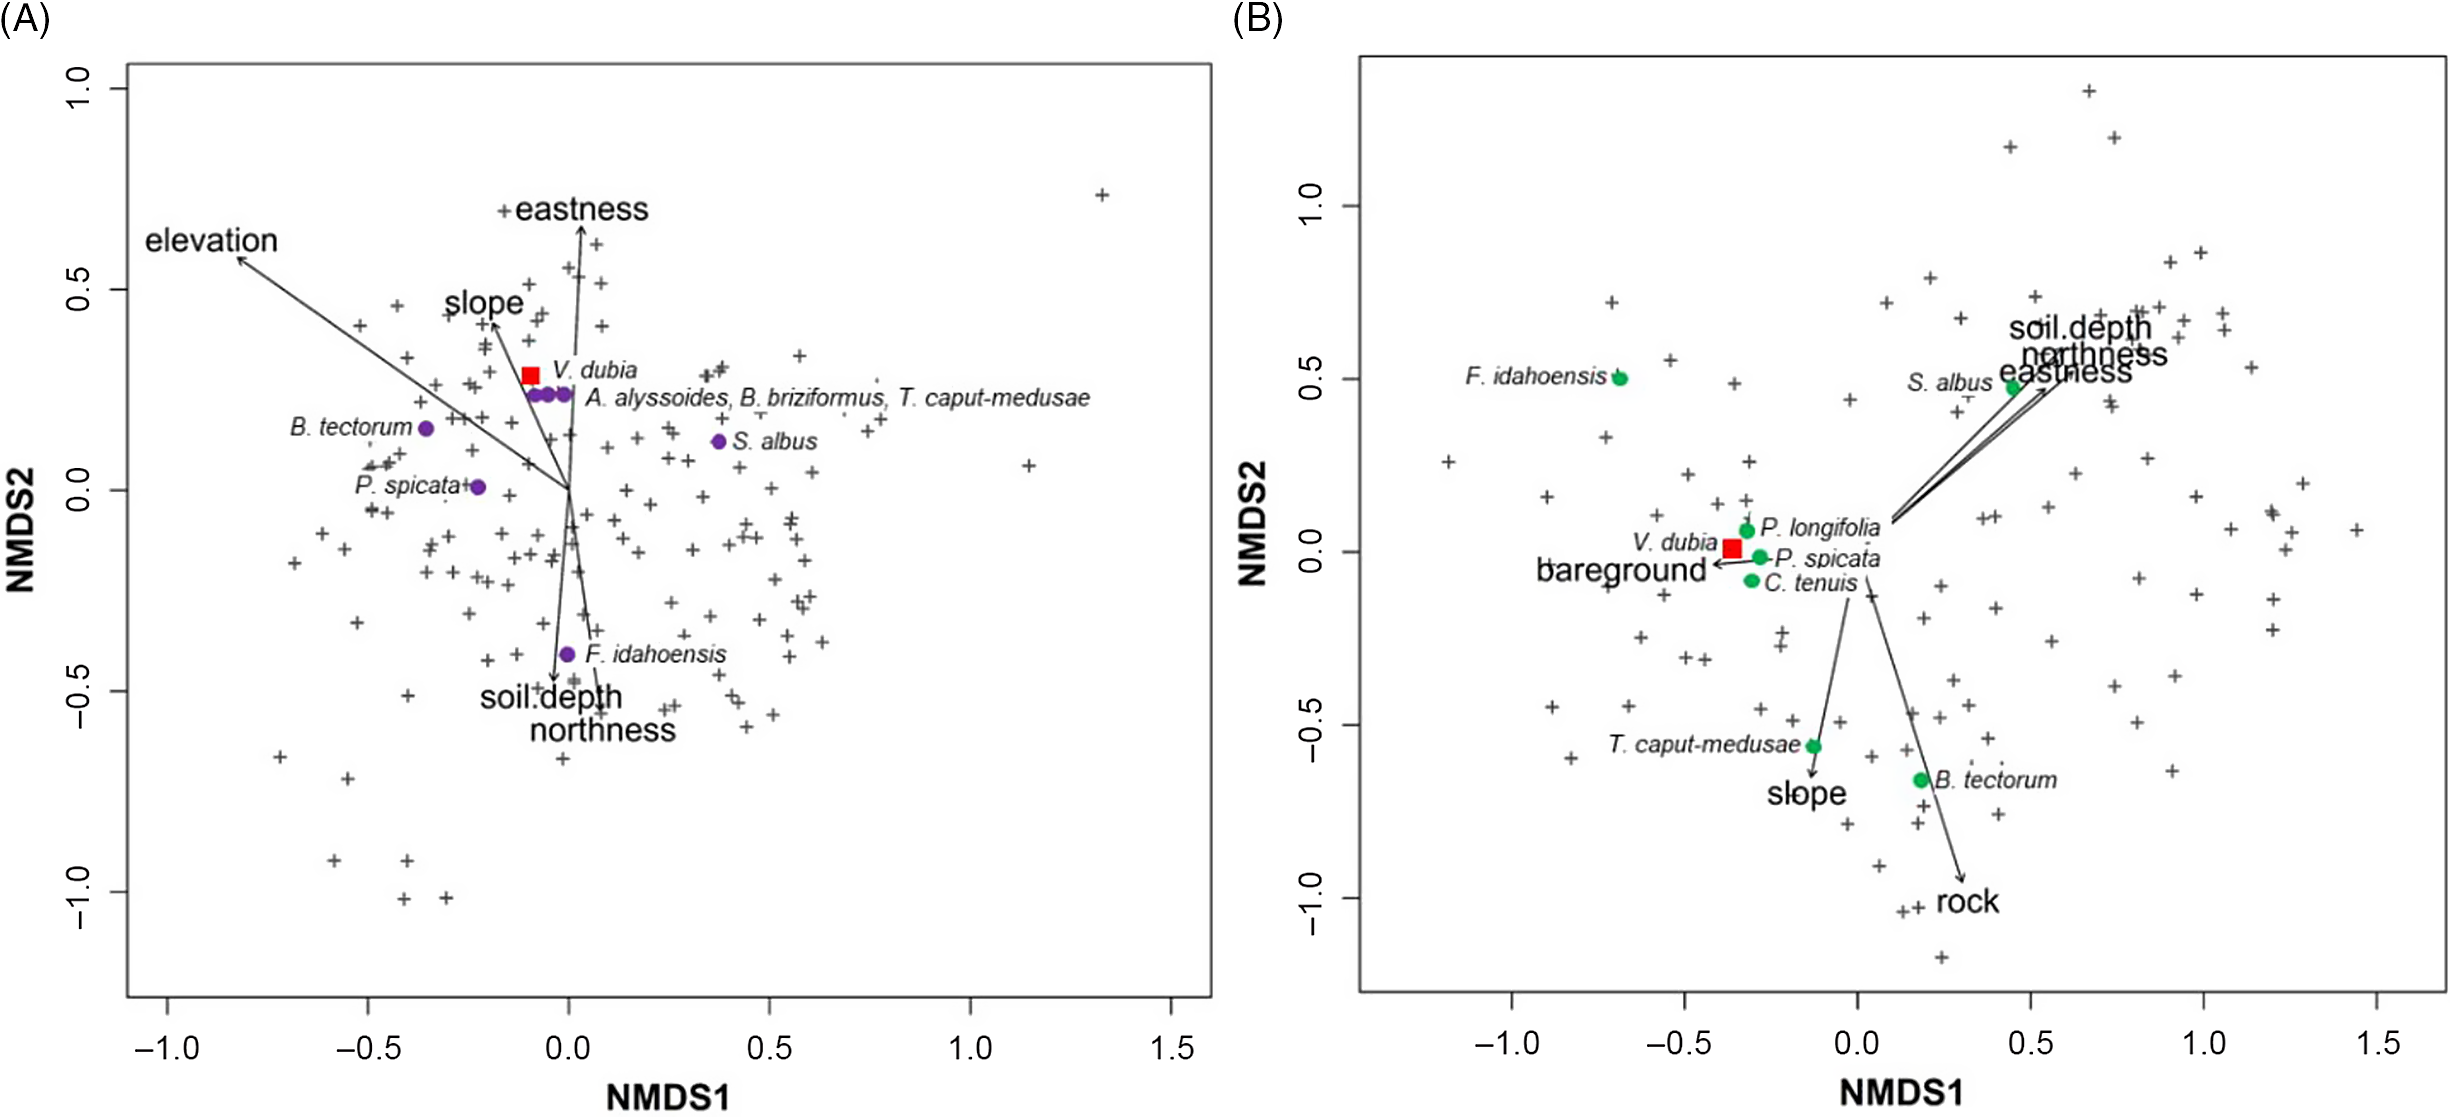
NMDS analysis revealed that in PP, V. dubia, rattlesnake brome (Bromus briziformis Fisch. & C. A. Mey.), and T. caput-medusae were closely associated (Figure 7A). In CG, V. dubia, P. spicata, and longleaf phlox (Phlox longifolia Nutt.) were closely associated (Figure 7B). Species clustering within the two ecoregions were quite different, in that other weedy species (B. briziformis, pale madwort [Alyssum alyssoides (L.) L.], and T. caput-medusae) clustered near V. dubia in PP, whereas mostly indigenous plants (P. longifolia, P. spicata, and hairy Indian paintbrush [Castilleja tenuis (A. Heller) T.I. Chuang & Heckard]) clustered near V. dubia in CG. The species clustering patterns with V. dubia correspond with the diversity analyses that show more nonindigenous species correlated with high V. dubia cover in PP, but fewer nonindigenous species correlated with higher V. dubia cover in CG.
Nonmetric multidimensional scaling (NMDS) of species scores in relation to collected environmental variables across all surveyed plots in (A) Palouse prairie and (B) canyon grasslands. Plus signs indicate all species, and for clarity, colored circles indicate plant species of interest, which are labeled; a red square indicates Ventenata dubia. Only significant (α = 0.05) environmental predictors were included, and arrows show the direction of increasing gradient.

The NMDS analysis revealed that greater abundance of V. dubia in both ecoregions was explained by shallow soils and south/west aspects (Figure 7). Unique to PP, greater abundance of V. dubia was also associated with moderate slopes and elevation (Figure 7A). Unique to CG, greater abundance of V. dubia was explained by more bare ground, less rock, and gentle slopes (Figure 7B). The environmental features associated with V. dubia can be used by land managers when considering which areas are more likely to be invaded by V. dubia. In contrast to V. dubia, B. tectorum abundance was associated with lower elevations and gentle slopes in PP and more rock, less bare ground, and steeper slopes in CG.
Soil Properties
We do not have soil data for the PP sites, because soil was not collected during the vegetation surveys.
In sagebrush steppe rangelands, Jones et al. (Reference Jones, Norton and Prather2018) found a positive correlation between high V. dubia cover and clay percentage. In the canyon grassland ecoregion, linear regressions of V. dubia cover values were performed to test for a relationship between V. dubia cover and clay, sand, and silt content. No relationship between V. dubia and any of the soil particle sizes (P > 0.12) was discovered. Most soils were classified as loams or silt loams.
In sagebrush steppe rangelands, Jones et al. (Reference Jones, Norton and Prather2018) found a negative correlation between high V. dubia cover and soil phosphorus and potassium concentrations. In addition, in pasture and grass-hay production in the PNW, Mackey (Reference Mackey2014) found the same relationship between high V. dubia cover and soil phosphorous and potassium concentrations. In CG, there was no relationship between V. dubia cover and phosphorous or potassium concentrations (P > 0.39). From all samples, measured phosphorus values ranged from 1.9 to 28 ppm and potassium values ranged from 120 to 590 ppm. Perhaps the lack of association between V. dubia and soil properties in this system reflects differences in historic phosphorus levels or V. dubia’s longer residence time compared with sagebrush steppe and agricultural fields.
Implications for Newly Invaded Ecosystems
Exploring similarities and differences in invasion dynamics across ecosystems is an important objective for invasion ecology. Unmack and Fagan (Reference Unmack and Fagan2003) demonstrated that a more highly invaded watershed likely predicts future invasion of a more remote watershed, when the watersheds are otherwise very similar. They concluded it is possible to use the similarity in invasion histories of two systems to predict what future invasion trajectories might be like.
In the early stage of invasion in PNW grasslands, V. dubia was initially observed in seasonally wet areas (Miller et al. Reference Miller, Northam and Callihan1998). Now, however, V. dubia is also found in high abundance in dry, south and west aspects populated by xeric perennial bunchgrasses, such as P. spicata. Data from a similar study conducted in the sagebrush steppe ecosystem (Jones et al. Reference Jones, Norton and Prather2018), where V. dubia is in the early stages of invasion, supported the idea that V. dubia’s current distribution in seasonally wet areas may expand to drier areas as residence time increases. Ventenata dubia cover was greatest in PP, moderately high in CG, and lowest in sagebrush steppe (sum cover of 1,435 across all plots), corresponding with decreasing time since invasion. Herbaria records indicate V. dubia presence in the sagebrush steppe ecosystem in 2010 (Consortium of Pacific Northwest Herbaria 2019).
There were some interesting differences between ecoregions regarding which other nonindigenous winter annual grasses were associated with V. dubia via the indicator species analysis. Bromus tectorum and T. caput-medusae have similar life-history traits as V. dubia and are problem weeds in both the grasslands of the PNW (Northam and Callihan Reference Northam and Callihan1994) and sagebrush steppe (Miller et al. Reference Miller, Clausnitzer, Borman, Sheley and Petroff1999). Ventenata dubia presence was correlated with higher cover of B. tectorum in PP and lower cover of B. tectorum in sagebrush steppe but had no association in CG. In contrast, V. dubia presence was correlated with higher cover of T. caput-medusae in CG and sagebrush steppe but had no association in PP. The varied associations of V. dubia with these other winter annual grass species indicate that V. dubia has a wide soil-moisture niche breadth. Within dry uplands, Bromus tectorum dominates very dry microsites, while T. caput-medusae dominates moist microsites (Hironaka Reference Hironaka1961). In sagebrush steppe, V. dubia was also associated with higher clay content of soils (Jones et al. Reference Jones, Norton and Prather2018), and clay soils hold more water (Marshall and Holmes Reference Marshall and Holmes1988). As V. dubia was observed with both B. tectorum and T. caput-medusae, V. dubia is successful in both soil moisture–limited and nonlimited sites.
More recently, in 2016, V. dubia was discovered in Sheridan County, WY, making it the first documented occurrence in the Great Plains ecoregion (Garner and Lakes Reference Garner and Lakes2019). By 2019, it was known to have invaded more than 800,000 ha of this new region (Garner and Lakes Reference Garner and Lakes2019). The Great Plains covers over 291 million ha of North America, equivalent to one-third of the United States. Uncontrolled invasion here would have substantial negative impacts on native vegetation, grazing lands, wildlife habitat, and wildfire cycles (Sheridan County Weed and Pest 2017). Results from this study and the one in sagebrush steppe rangelands indicate that in the Great Plains, areas with shallow soils and south/west aspects and dominated by annual Bromus spp. or T. caput-medusae are most at risk to V. dubia invasion. This information can be used by land managers for early detection, efficient monitoring, and successful control measures.
It may be possible to predict from a historical vantage point what types of species pose threats and how introductions will spread within systems that have similar abiotic and biotic characteristics. The patterns and impacts of 30-yr-old V. dubia invasion in PP and CG may be a vision into a crystal ball for the new regions V. dubia is invading in the western United States. Namely, V. dubia appears to be a generalist that can invade dry and wet areas and V. dubia cover >12.5% was associated with a decline in indigenous species richness. We hope landowners and land managers will use this information to guide efforts to prevent, minimize, and control V. dubia’s expansion.
Acknowledgments
The authors would like to gratefully acknowledge Lynn Danly (Bureau of Land Management), Connie Jensen-Blyth (Idaho County), and John Wallace (Pennsylvania State University) for their assistance with locating study sites. Christie Hubbard Guetling and Brianna Slothower assisted with field data collection in canyon grasslands. No conflicts of interest have been declared. This research received no specific grant from any funding agency or the commercial or not-for-profit sectors.