1. Introduction
Fold and thrust belts (FTBs) have been extensively explored for hydrocarbons in many parts of the world and in some parts have yielded substantial reserves (e.g. Albania, central Italy, Iran, Iraq and Saudi Arabia) (Bordenave & Huc, Reference Bordenave and Huc1995; Velaj et al. Reference Velaj, Davison, Serjani and Alsop1999; Fox & Ahlbrandt, Reference Fox and Ahlbrandt2002; Bertello et al. Reference Bertello, Fantoni and Franciosi2008). Based on the Information Handling Services (IHS) field reserves data (March 2004), 14% of the world's discovered reserves are within FTBs developed at convergent plate boundaries, a significant proportion of the global reserve base. The FTB in the Balkan Peninsula is known as the external Hellenides in western Greece and the Albanides in Albania. Thus, on- and offshore western Greece are, in terms of geological setting, the southern extension of the prolific Albanian oil and gas provinces, while two different potential hydrocarbon systems (one Mesozoic and one Tertiary) have been distinguished in western Greece (e.g. Zelilidis et al. Reference Zelilidis, Piper, Vakalas, Avramidis and Getsos2003; Schmitz et al. Reference Schmitz, Dobrova and Zelilidis2005; Maravelis et al. Reference Maravelis, Makrodimitras and Zelilidis2012).
The depositional slopes connect deep-marine basins to their coeval shallow-water delivery systems and deposits of this depositional environment record evidence of sediment supply, creation and destruction of accommodation, and tectonic processes (Flint & Hodgson, Reference Flint, Hodgson, Hodgson and Flirt2005). Deep-water sedimentation, including that associated with slope environments, has attracted international interest over the last decade and high-resolution three-dimensional seismic datasets revealed that the slopes and sedimentary bodies that are commonly accumulated can be very complex (e.g. Armentrout et al. Reference Armentrout, Kanschat, Meisling, Tsakma, Antrim, McConnell, Bouma and Stone2000). However, there are few data sets available with substantiated facies relationships and sedimentary body geometries of slope deposits (Romans et al. Reference Romans, Hubbard and Graham2009). Outcrops provide an opportunity for such high-resolution investigation, but the preservation of extensive, and stratigraphically intact, continental-margin slope systems is rare. Outcrop studies of such deposits allow a precise documentation of their internal structures, thicknesses, grain-size, sorting and composition (Maravelis et al. Reference Maravelis, Konstantopoulos, Pantopoulos and Zelilidis2007; Konstantopoulos & Zelilidis, Reference Konstantopoulos and Zelilidis2012).
Even in mud-rich slope systems, sand-prone elements are abundant and represent attractive hydrocarbon exploration targets (Piper & Normark, Reference Piper and Normark2001). Transfer and re-deposition of organic matter (OM) from continental margins to deep-sea basins by turbidity flows is common. Characterizing the OM from sedimentary rocks is one of the main objectives of organic geochemistry and is now widely recognized as a critical step in the evaluation of the hydrocarbon potential of a prospect (Lafargue et al. Reference Lafargue, Marquis and Pillot1998). During the last two decades, various authors (e.g. Espitalie et al. Reference Espitalie, Laporte, Madec, Marquis, Leplat and Paulet1977, Reference Espitalie, Marquis, Barsony and Voorhees1984; Peters & Simoneit, Reference Peters and Simoneit1982; Peters, Reference Peters1986; Maravelis & Zelilidis, Reference Maravelis and Zelilidis2010) have used pyrolysis methods to provide data on the potential, maturity and type of the source rocks in different sedimentary basins.
Basin analysis requires precise dating and thus the use of the remarkably complete and continuous coccolithophore fossil record is an ideal tool for biostratigraphic and palaeoceanographic studies (Perch-Nielsen, Reference Perch-Nielsen, Bolli, Saunders and Perch-Nielsen1985; Bown et al. Reference Bown, Lees, Young, Thierstein and Young2004). Coccolithophores are of remarkable interest to a wide range of scientists, for example marine biologists and oceanographers, as they are among the main primary producers and play a distinct role in oceanic ecosystems (e.g. Bown et al. Reference Bown, Lees, Young, Thierstein and Young2004). Calcareous nannofossils are an important part of the marine phytoplankton community and play an important role in the global carbon cycle (Winter & Siesser, Reference Winter and Siesser1994). They have been widely used in recent biostratigraphic studies (Wade & Bown, Reference Wade and Bown2006; Villa et. al. Reference Villa, Fioroni, Pea, Bohaty and Persico2008; Maravelis & Zelilidis, Reference Maravelis and Zelilidis2012). Because of their microscopic size (2–20μm), great diversity, fast evolutionary rates, wide geographic distribution and astronomical number in marine sediments, this group provides one of the most complete fossil records for Cenozoic times (Bown et al. Reference Bown, Lees, Young, Thierstein and Young2004).
A great opportunity to examine some of the attributes mentioned above is offered by the well-exposed Lower Oligocene to Lower–Middle Miocene slope succession on the western flanks of the Hellenic FTB on Diapondia Islands, Ionian Sea, NW Greece. This research is the first detailed biostratigraphic–sedimentological–hydrocarbon potential study of these rocks. This study aims to provide a detailed overview of the facies, facies associations and architecture of these sediments, allowing the depositional processes and sub-environments to be elucidated. It also attempts to refine the biostratigraphic dating by analysing the biostratigraphy of calcareous nannofossils and to provide original data concerning their organic geochemical characteristics. The results of the study also permit the basin history to be deduced and provide information on the prospect of the Tertiary petroleum concern on the Hellenic FTB.
2. Exploration history of western Greece
Even though the demand for oil and gas is growing worldwide, Greece's potential in this sector remains poorly explored. The country recently opened up a little to foreign investments and this may entice international oil/gas exploration companies to compete for acreage. The Hellenic Republic, acting through its competent authority, the Ministry of Environment, Energy and Climate Change, invited (through an open-door licence round) oil/gas operators to apply for authorization to explore and exploit hydrocarbon in respect of certain acreage in western Greece. The Ministry of Environment, Energy and Climate Change additionally invited companies to submit applications for participation in a non-exclusive seismic survey off the shores of western and southern Greece.
Western Greece remains poorly explored even though evidence of petroleum seepage is commonly found. So far, none of the ten shallow and deep wells that have been drilled to test structures for hydrocarbons have given positive results, apart from some older wells of Katakolon structure offshore in the Peloponnesus region, where oil in non-commercial quantities was tested. In spite of the failure to find commercial quantities of oil, the presence of indications of oil and gas (shows) was clearly important from the point of view of demonstrating that western Greece does contain a working source rock. The occurrence of dry holes can be attributed to differences in the rock structures drilled, and are therefore possibly localised, thus not condemning the entire area (Zelilidis et al. Reference Zelilidis, Piper, Vakalas, Avramidis and Getsos2003; Schmitz et al. Reference Schmitz, Dobrova and Zelilidis2005; Maravelis et al. Reference Maravelis, Makrodimitras and Zelilidis2012).
Regional analysis indicates a Mid-Mesozoic hydrocarbon system as the main system in western Greece, which is similar to that found in Albania (e.g. Karakitsios, Reference Karakitsios1995; Rigakis & Karakitsios Reference Rigakis and Karakitsios1998; Karakitsios & Rigakis, Reference Karakitsios and Rigakis2007). The Lower Oligocene to Lower–Middle Miocene slope succession studied in this part of the Hellenic FTB may serve as first-class cap rocks for the underlying Mesozoic Ionian source rocks. Source rocks are also thought to occur at Mid/Late Tertiary and may constitute the core of the Mid/Late Tertiary hydrocarbon system, similar to that found in the Albanian Durres Basin (Zelilidis et al. Reference Zelilidis, Piper, Vakalas, Avramidis and Getsos2003). Migration occurred through major fault conduits, while the critical modelling of migration/expulsion vs structural geology is strongly associated with local factors. This model suggests: (1) reservoir diagenesis; (2) thrusting of the pre-Miocene section; (3) karstification of top layers and sediment cover at Late Miocene; (4) hydrocarbon migration/expulsion during Late/Mid-Miocene; and (5) tectonic pulse at pre-Late Pliocene (Schmitz et al. Reference Schmitz, Dobrova and Zelilidis2005).
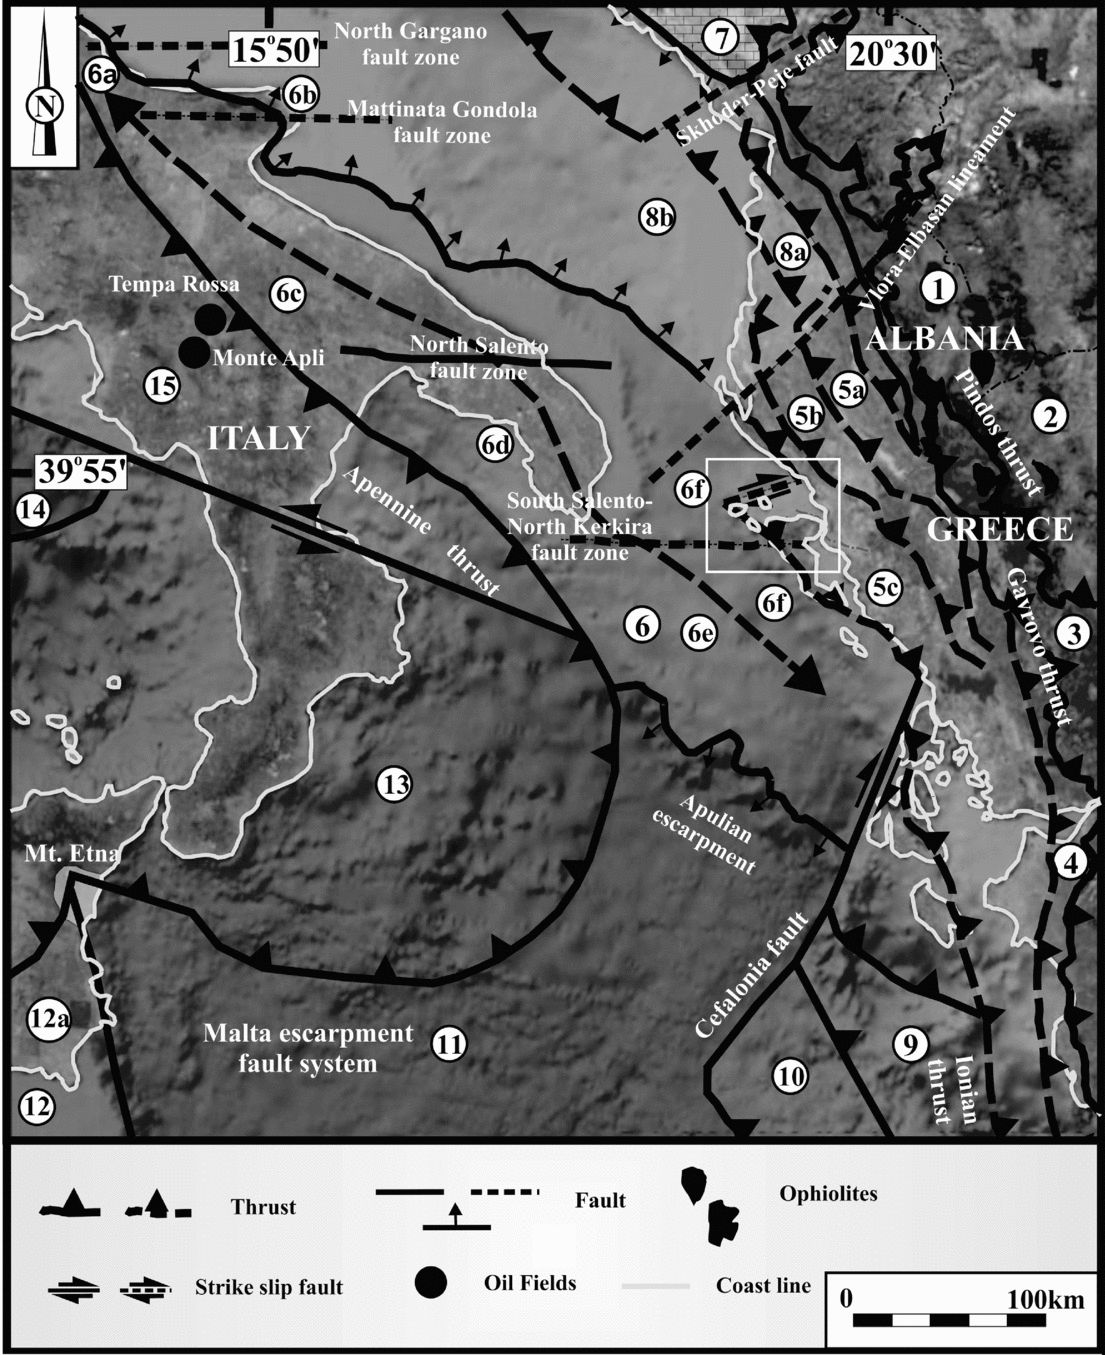
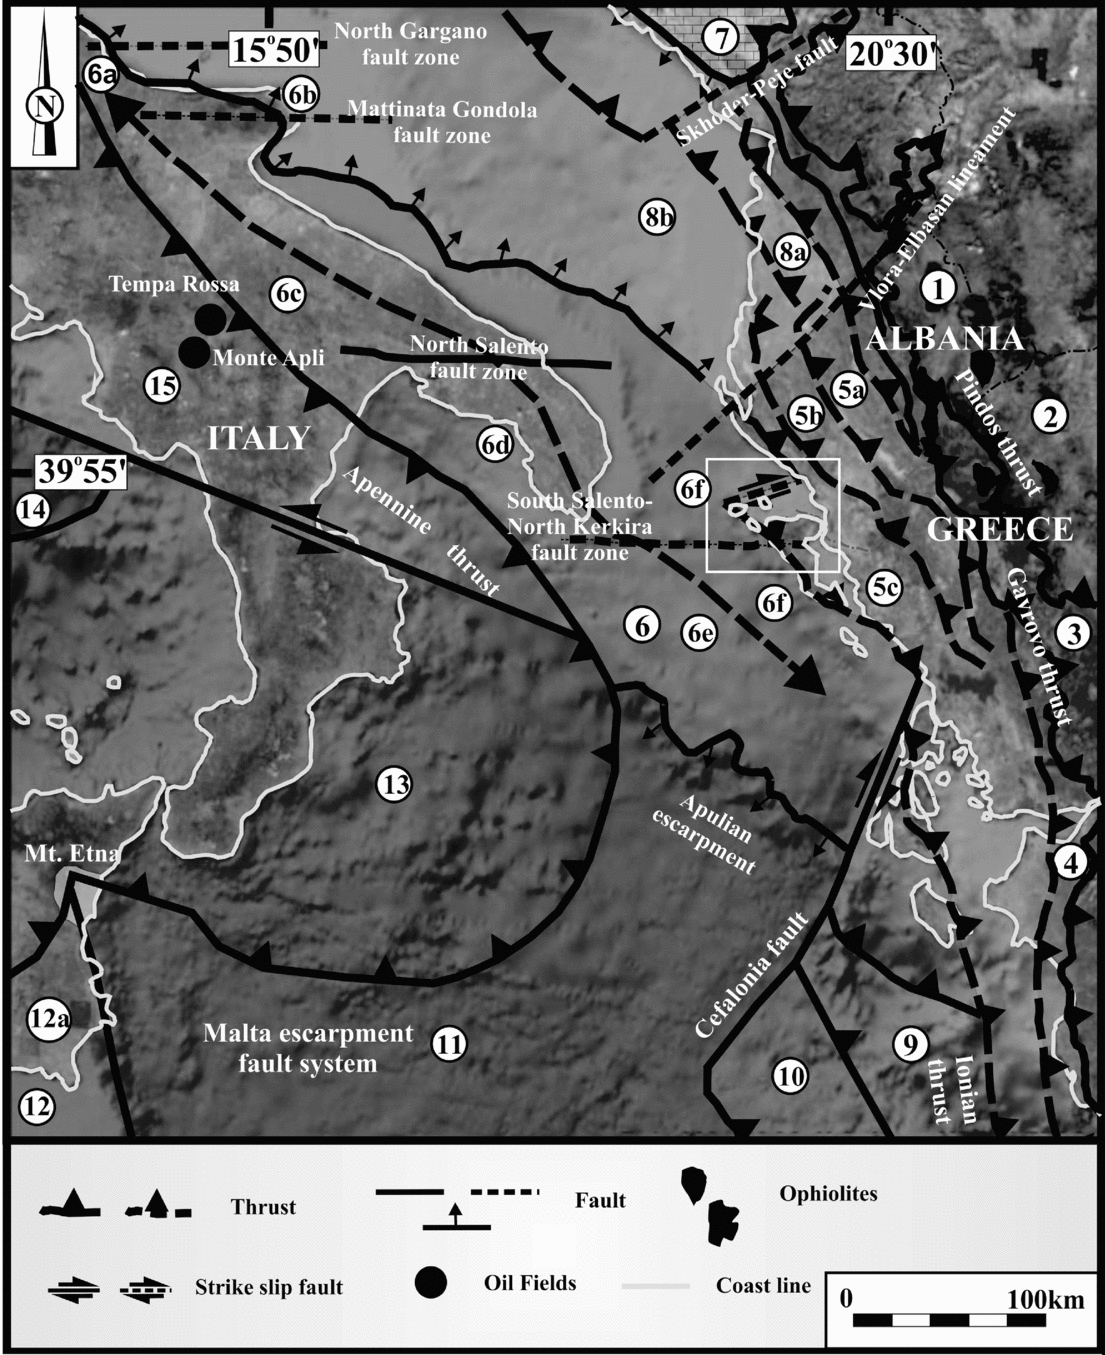
The three basin types of western Greece that deserve further hydrocarbon exploration have been examined and are grouped, correlated with major tectonic features, into foreland (Ionian thrusts’ foreland basin), piggy-back (Ionian thrusts’ back-arc basin) and strike-slip basins (Fig. 1). Additionally, strike-slip basins are further subdivided into north of the Borsh–Khardhiqit strike-slip fault basin and the Preveza basin, north of the Cephalonia transfer fault (Fig. 2) (Maravelis et al. Reference Maravelis, Makrodimitras and Zelilidis2012).
Geological map of western Greece and adjacent regions. (1) internal Albanides, (2) internal Helenides, (3) Pindos Zone (Krasta), (4) Gavrovo Zone (Kruja), (5a) internal Ionian Zone, (5b) middle Ionian Zone, (5c) external Ionian Zone, (6) Apulian platform, (6a) Rospo plateau, (6b) Gargano promontory, (6c) Murge ridge, (6d) Salento peninsula, (6e) Apulia plateau, (6f) pre-Apulian (or Paxi) Zone, (7) Albanian Alps, (8a) Dures basin, (8b) Ionian–Albania basin, (9) Hellenic trench, (10) Mediterranean ridge, (11) Ionian abyssal plain, (12) Africa, (12a) Hyblean plateau, (13) Calabrian arc, (14) South Tyrrhenian Sea, (15) south Apennine.
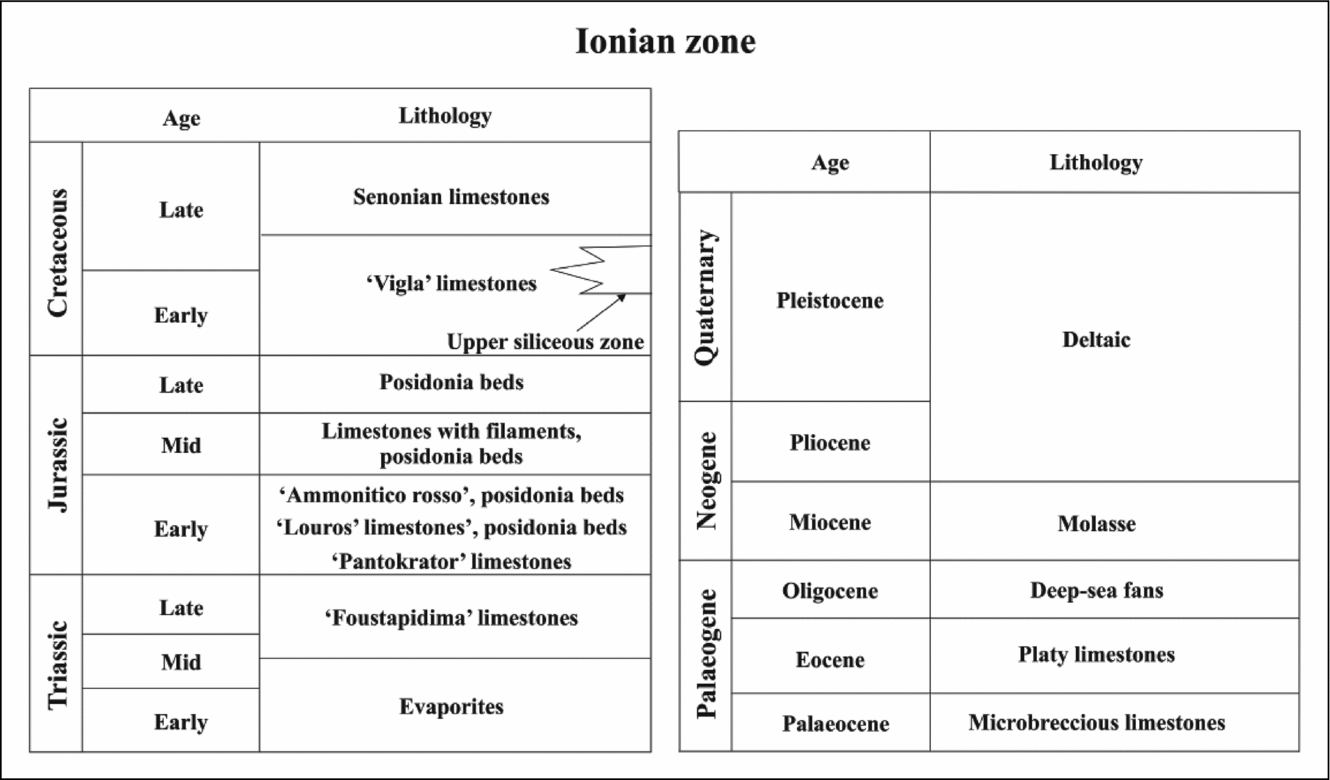
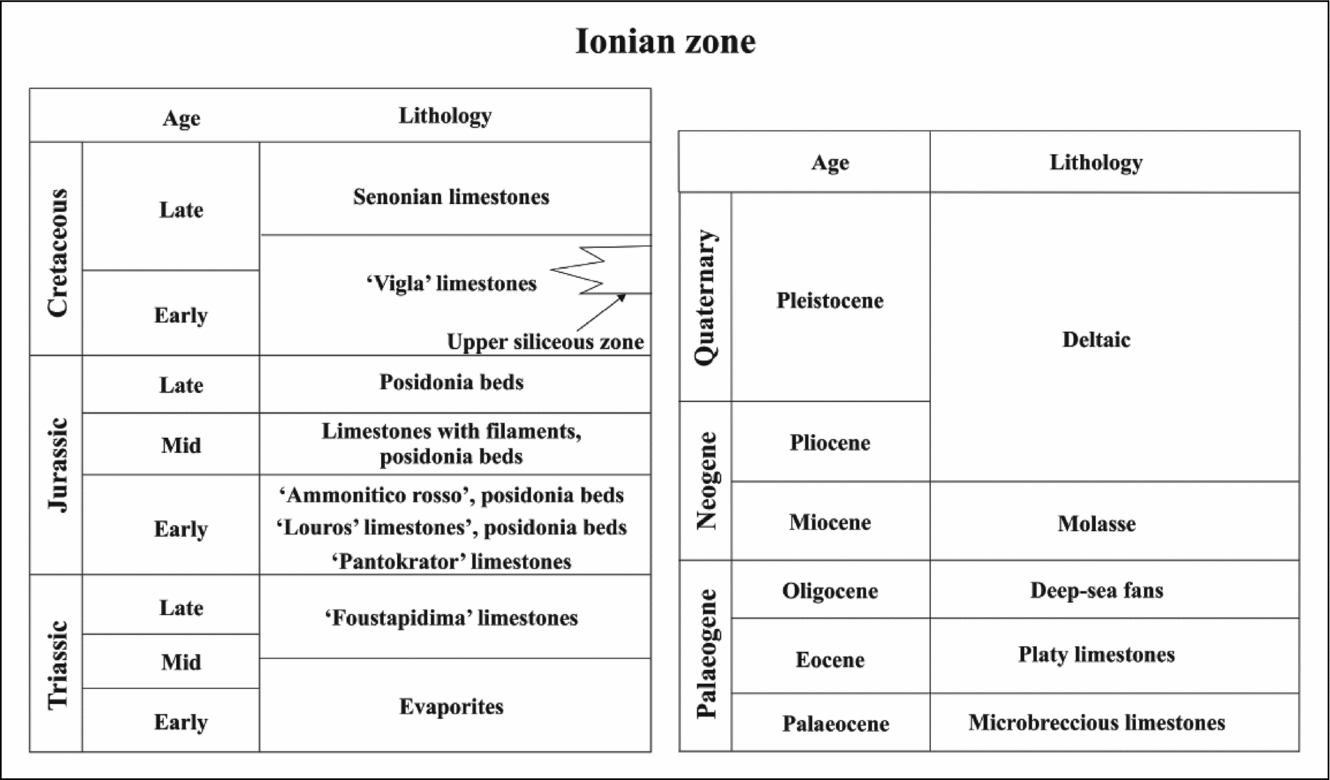
Triassic to Quaternary generalized stratigraphic column of the Ionian Zone (modified after Karakitsios, Reference Karakitsios1995).
3. Tectonostratigraphy
The study area lies within the western flanks of the Hellenic FTB and was developed because of the collision and continued convergence of the African and Eurasian Plates since the Mesozoic (Fig. 1). During the Triassic to Late Cretaceous the area was part of the Apulian continental block on the southern Tethys’ passive margin, while the Pliensbachian is designated by extensional stresses associated with the opening of the Tethys Ocean, resulting in the Ionian Basin's opening (Bernoulli & Renz, Reference Bernoulli and Renz1970; Karakitsios, Reference Karakitsios1992).
Deformation associated with this convergence is expressed as a progressive westward-migrating ‘deformation front’, which compressed (telescoped) the previous predominantly extensional basin and platform morphology (Clement et al. Reference Clement, Hird, Charvis, Sachpazi and Marnelis2000). The Ionian Zone is a fault-controlled extensional basin adjacent to the Pindos Ocean during the Triassic and Early Jurassic periods, accumulating a 10-km pile of sediments (Fig. 2). Major orogenic movements took place at the end of the Burdigalian (IGRS-IFP, 1966) with the inversion of the Ionian Basin succession (Karakitsios, Reference Karakitsios1995). Tectonic processes observed within the Ionian Zone exhibit folds and thrusts features in the central and western parts of the zone that are displaced westwards, whereas in its eastern part they are displaced eastwards. This trend is attributed to structures inherited from the Jurassic extensional phase that were reactivated during compression with westward and eastward displacement, respectively. The extensional faults, of Jurassic age, in the external Ionian Zone (Apulian side), dip eastwards and were reactivated during the compressional phase in the form of compressional westward displacements, whereas extensional faults in the internal Ionian Zone (Gavrovo side) dip westwards and were reactivated as compressional eastward displacements (Karakitsios & Rigakis, Reference Karakitsios and Rigakis2007). The Ionian Zone constitutes a good example of inversion tectonics in a basin with an evaporitic substratum (Karakitsios, Reference Karakitsios1995). The structural differentiation separated the Ionian Basin into smaller (up to 5 km) parts with half-graben geometry, as recorded by the abrupt change of the synrift formations thickness, which take the form of synsedimentary wedges (Karakitsios, Reference Karakitsios1995). This palaeogeographic configuration associated with minor off- and onlap movements along the basin margins continued till the late Eocene, when orogenic movements and submarine fan sedimentation dominated the study area.
Three distinct stratigraphic sequences have been identified within the Ionian Zone (Fig. 2) (Karakitsios, Reference Karakitsios1992, Reference Karakitsios1995). A pre-rift sequence represented by Lower Liassic Limestones (Pantokrator) overlying Lower–Middle Triassic evaporites and Ladinian–Rhaetian Limestones (Foustapidima), an overlying synrift sequence represented by pelagic limestones (Siniais) and their laterally equivalent hemipelagic Pliensbachian limestones (Louros), reflecting the general deepening of the Ionian domain and the Ionian Basin's formation, and a post-rift sequence corresponding to pelagic limestones (Vigla) that mark the Ionian Basin's formation onset in the early Berriasian (Karakitsios, Reference Karakitsios1992). The Senonian limestones, overly Vigla limestones, correspond to a period of basinal sedimentation, and its facies distribution reflects the Ionian Basin's separation into a complex structural and basinal topography consisting of a central topographically higher region with reduced sedimentation, and two surrounding talus slopes with higher sedimentation rates (IGRS-IFP, 1966). Additionally, carbonate platforms (Gavrovo and Apulia) provided the study area with clastic carbonate material. Turbidites accumulated across the Eocene – Oligocene boundary and conformably overly upper Eocene limestones (Karakitsios & Rigakis, Reference Karakitsios and Rigakis2007).
4. Methodology
A suite of 16 outcrops spread over the exposure belt were studied on Ereikousa and Othonous Islands. Outcrops on Mathraki Island were impossible to measure since the sediments were extremely distorted. Facies types were delineated and interpreted while mutually associated facies types were clubbed under three different facies associations. The sand bodies were studied by describing measured sections. Depositional processes and environments were interpreted from primary sedimentological features (sedimentary structures, grain size, palaeoflow indicators) and shifts in palaeogeography were interpreted through variations in interpreted bathymetry across the stratigraphic column. Facies, as defined by Mutti & Ricci-Lucchi (Reference Mutti and Ricci-Lucchi1975), is used herein to indicate a group of strata or a single stratum with well-defined lithology, stratification, sedimentary structures and texture. Palaeoflow direction was determined by means of data derived from sole marks, as they provide the best estimate of the mean flow direction.
Biostratigraphic investigations were carried out on 50 mudstone samples in order to refine the biostratigraphic dating of those outcrops by analysing, for the first time in the area, the biostratigraphy of calcareous nannofossils. Samples were prepared on smear slides using the standard technique proposed by Monechi & Thierstein (Reference Monechi and Thierstein1985). Calcareous nannofossils were analysed under light microscopy at 1250× magnification, as described by Perch-Nielsen (Reference Perch-Nielsen, Bolli, Saunders and Perch-Nielsen1985) and Young (Reference Young and Bown1998), while the age determination was based on the biozonation of Martini (Reference Martini1971).
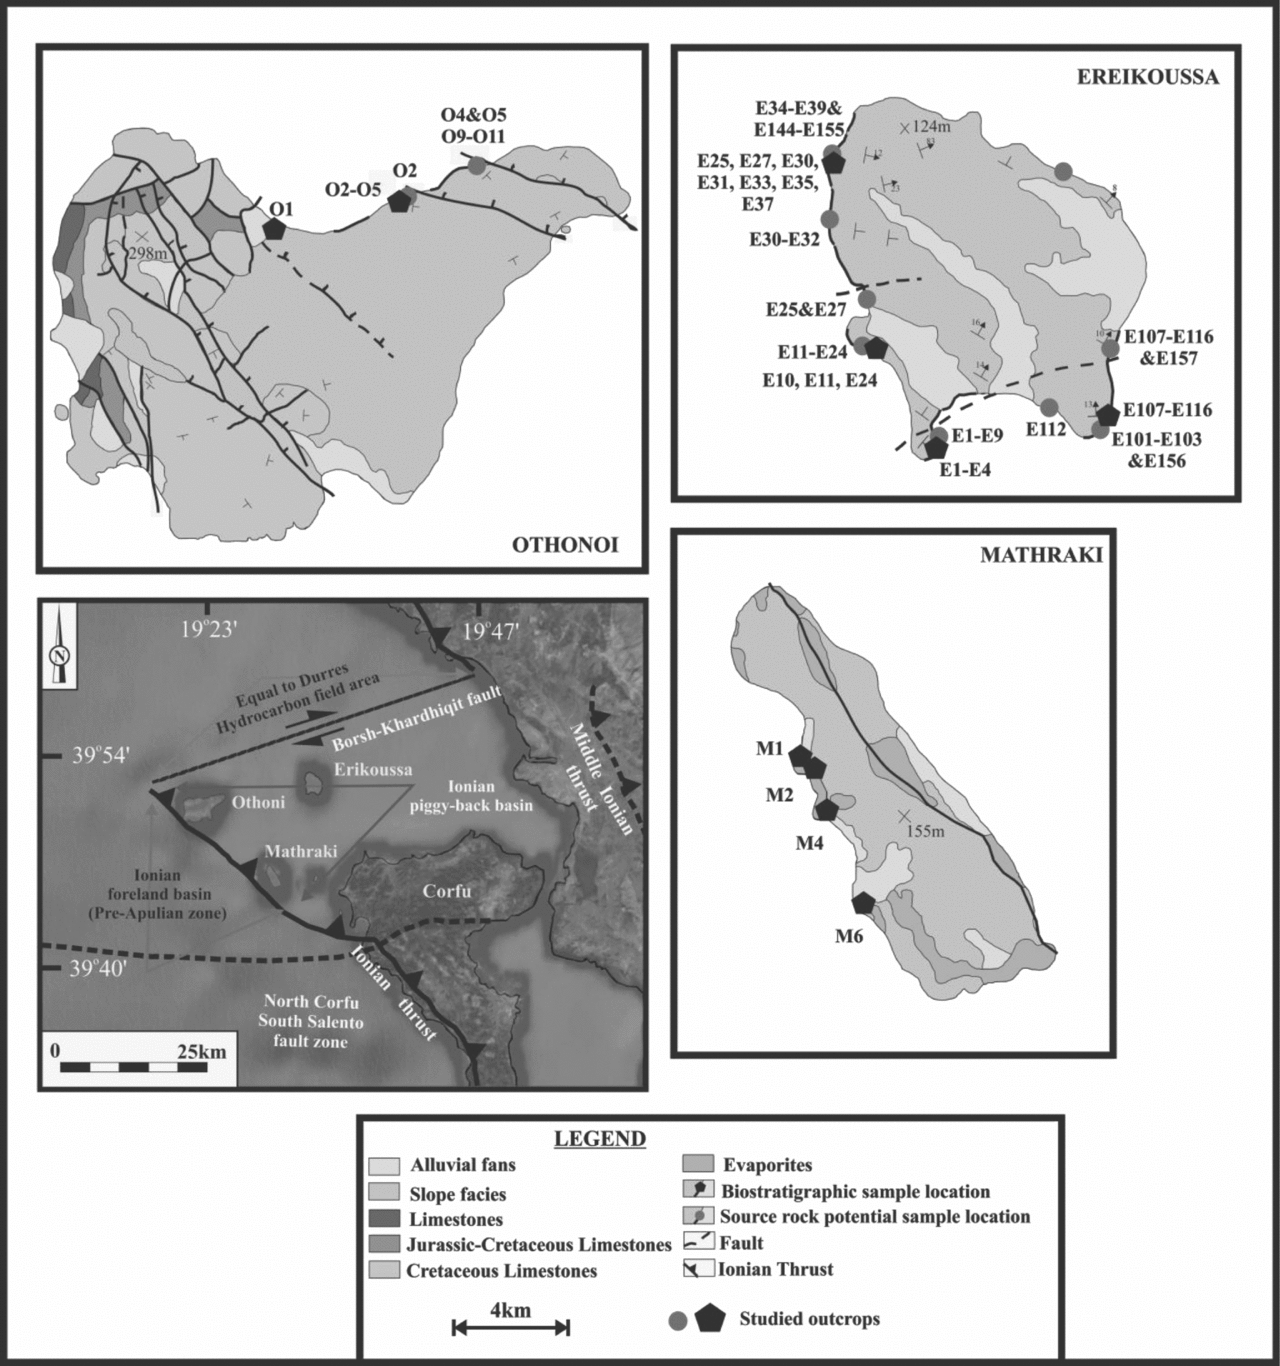
Fifty-three organic-rich mudstones were selected by colour and collected from natural outcrops, while to minimize the effects of weathering, the surface material was removed before sampling. All analysed samples were selected with a view to be representative of the regional basin history (Figs 3, 4). Petroleum source rock characterizations were conducted using the Rock-Eval pyrolysis method with a Rock-Eval II (Delsi Inc.) analyser under standard conditions (see Espitalié et al. Reference Espitalie, Deroo and Marquis1985a , Reference Espitalie, Deroo and Marquis b , Reference Espitalie, Deroo and Marquis1986; Peters, Reference Peters1986; Lafargue et al. Reference Lafargue, Marquis and Pillot1998; Béhar et al. Reference Behar, Beaumont, De and Penteado2001) while the interpretive guidelines used were from Tissot & Welte (Reference Tissot and Welte1984), Peters (Reference Peters1986), Peters & Cassa (Reference Peters, Cassa, Magoon and Dow1994), Burwood et al. (Reference Burwood, De Witte, Mycke, Paulet and Katz1995) and Dymann et al. (Reference Dymann, Palacos, Tysdal, Perry and Pawlewicz1996). Essentially, this method uses approximately 70 mg of pulverized rock and heats it in a nitrogen atmosphere in a special oven and standard notations, such as free and pyrolysable hydrocarbons (S1 and S2, mgHC/g rock), hydrogen index (HI, mgHC/g Corg), oxygen index (OI, mgCO2/g Corg), Tmax (°C), total organic carbon (TOC) content (wt %), hydrocarbon potential (S1 + S2, mgHC/g rock) and production index (PI, S1/S1 + S2), were determined. Source-rock potential has been evaluated on the basis of three fundamental attributes: quantity, quality and maturity of the OM.
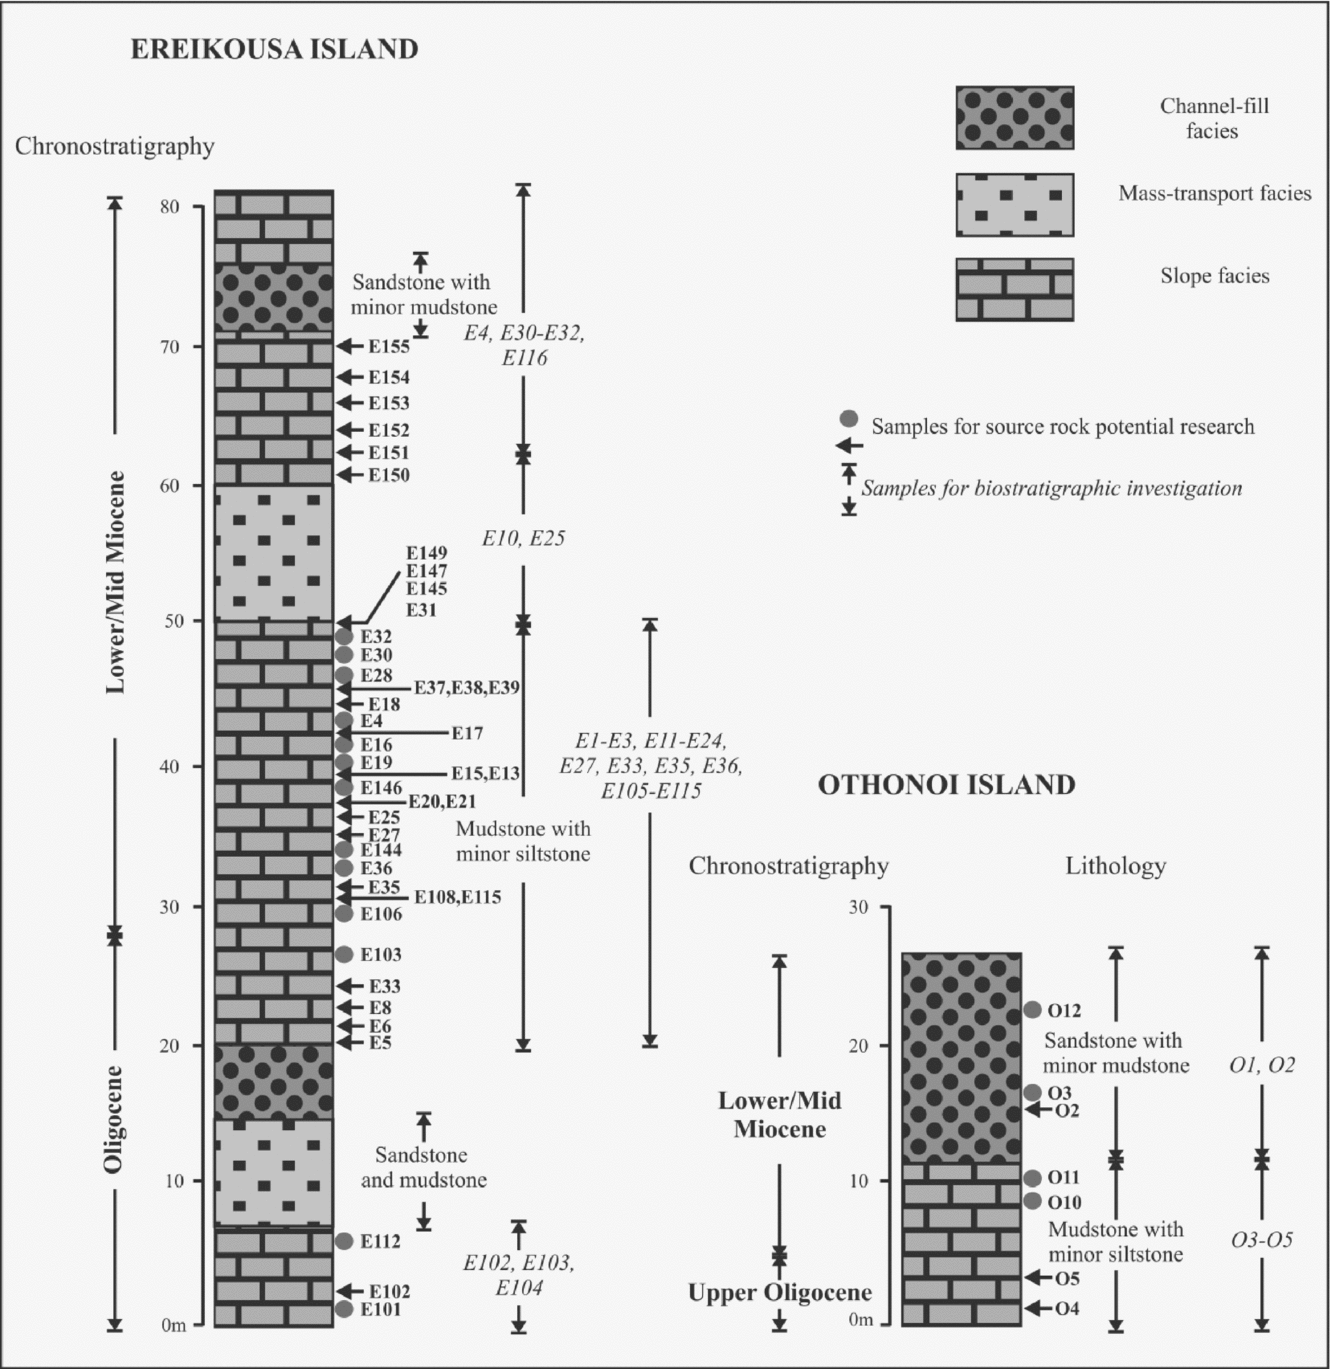
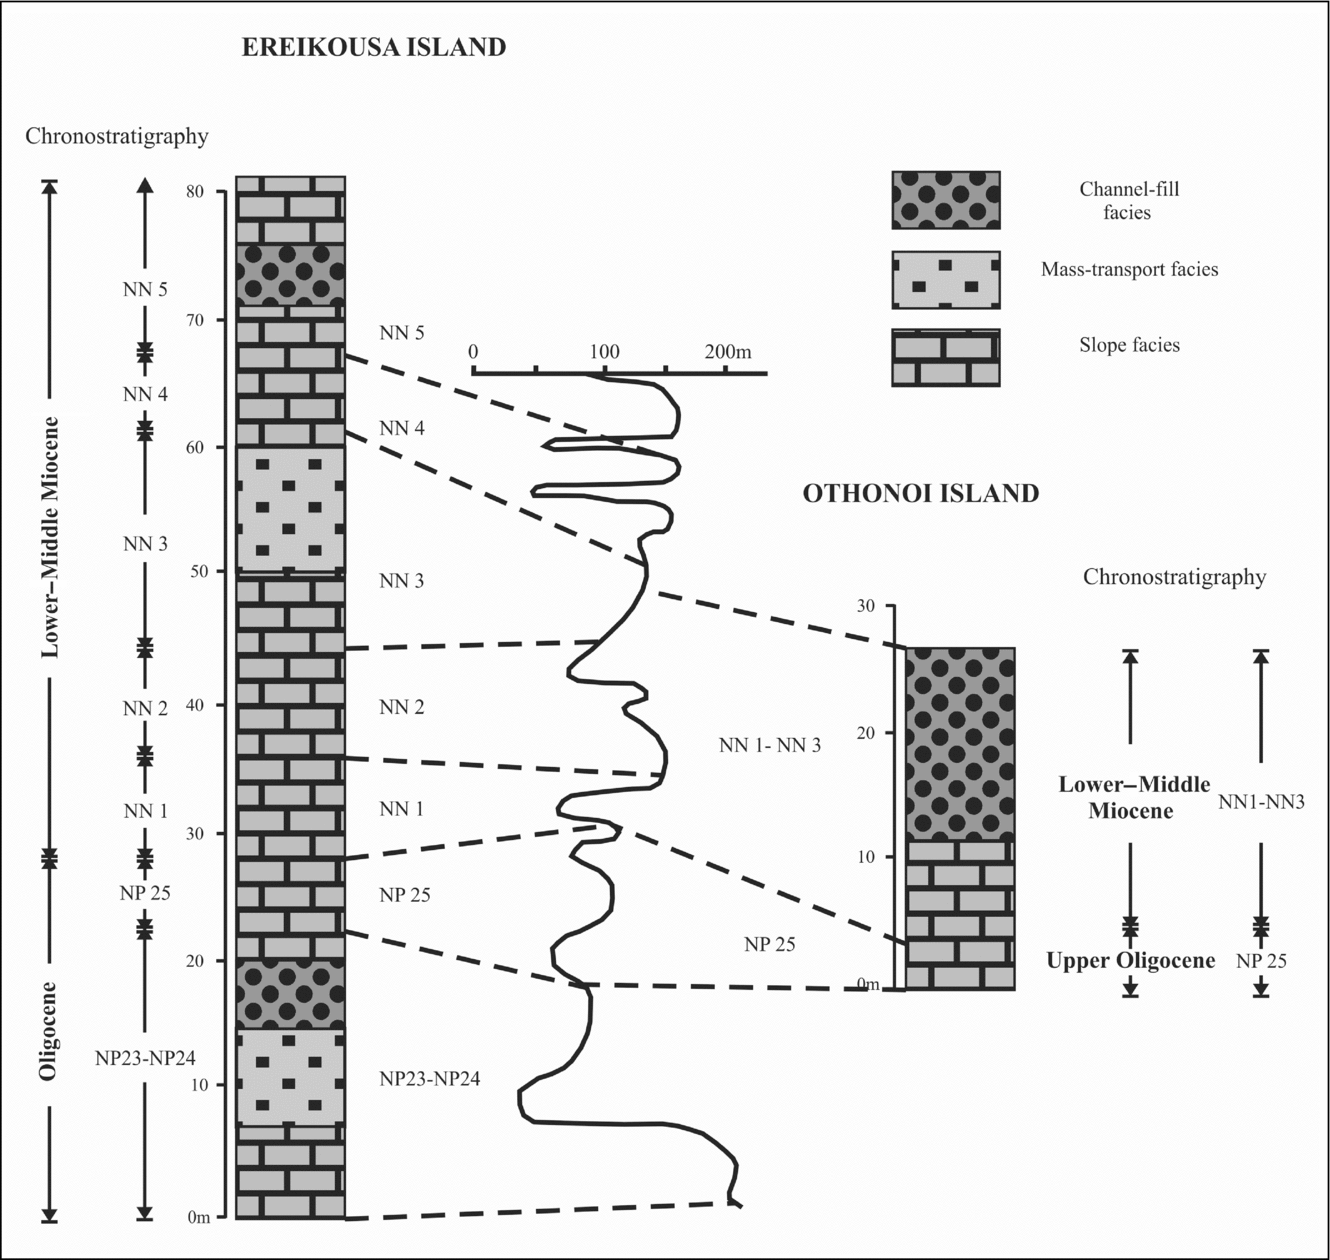
Lithological (metre-scale) section of the studied sediments showing the sample positions investigated.

Location of the study area on a simplified geological map where the positions of the selected samples are indicated.

A commonly accepted minimum TOC content for a potential source rock is 0.5%. Rocks containing less than 0.5% TOC are considered to have negligible hydrocarbon source potential. Between 0.5 and 1% TOC indicates marginal potential and more than 1% TOC has substantial source potential. Here we consider a mudstone as an oil-prone source when its original TOC and HI values exceed about 1.5 wt % and 250–300 mgHC/g organic carbon (Corg), respectively.
5. Sedimentary facies and environments
Three main facies associations have been recognized in the study area and are grouped into sandstone with minor mudstone (facies association 1), mudstone with minor siltstone (facies association 2) and mass transport deposits (MTDs; facies association 3). Additionally, facies association 1 is further subdivided into thin-bedded sandstone and mudstone, and thick-bedded, occasionally amalgamated, sandstone and mudstone.
5.a. Facies association 1: Sandstone with minor mudstone
5.a.1. Facies 1a: Thin-bedded sandstone and mudstone
Facies 1a (F1a) consists of fine-grained, thin-bedded sandstone and mudstone. Sharp-based beds of structureless sandstone contain the coarsest grain size observed (Fig. 5a). Occurrences of plane-laminated, very fine-grained to fine-grained sandstone are typically interlaminated with mudstone. Ripple-laminated, very fine-grained to fine-grained sandstone is also present but is not as common. Plane-laminated mudstone is, in some cases, interbedded with the thin-bedded and finer-grained sandstone described above. More commonly, however, this mudstone facies is present as a distinct interval ten to hundreds of centimetres thick (Fig. 5b).
Outcrop photographs of thin-bedded sandstone and mudstone facies 1a (F1a). (a) Finegrained, thin-bedded structureless sandstone and laminated mudstone. White arrows point to sharp contacts of coarsest sandstone with underlying mudstone. (b) Structureless and ripple-laminated very fine-grained to fine-grained sandstone. Note the sharp contacts with underlying mudstone (white arrows) and the distinct mudstone intervals between sandstone beds. Ta, Tc – Bouma divisions.
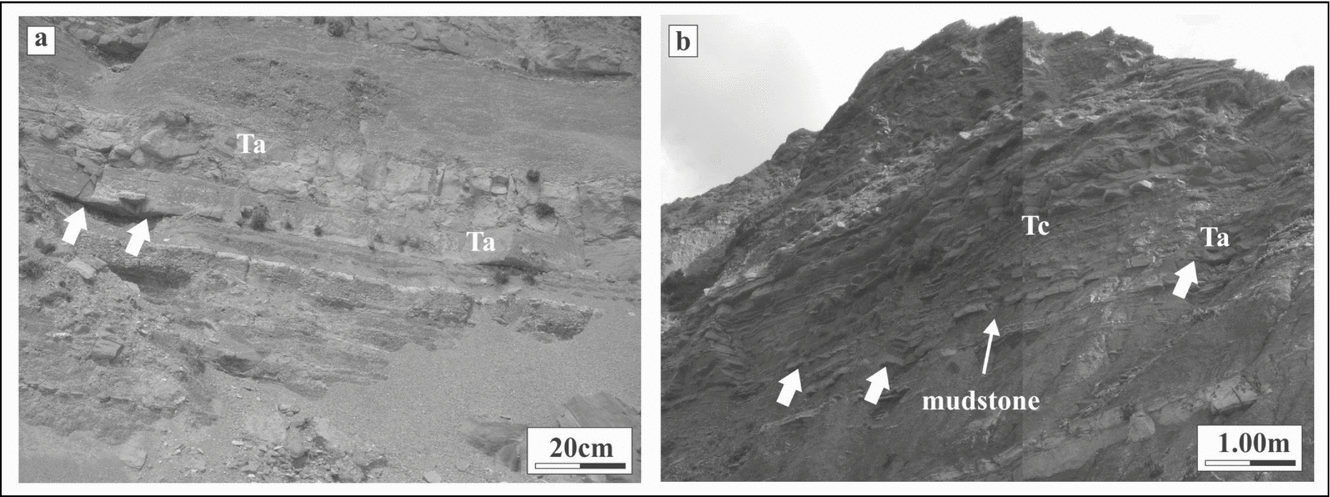
Most of the deposits in F1a record mixed suspension and traction sedimentation associated with waning low-destiny turbidity currents. The thicker (10–20 cm), structureless beds represent suspension sedimentation from the high concentration bases of overall low-density turbidity currents (Ta division of Bouma, Reference Bouma1962). The plane-laminated and ripple-laminated sandstones are described by the Tb and Tc divisions of Bouma (Reference Bouma1962), respectively. The laminated mudstone-dominated successions are the product of dilute low-density turbidity currents (Td division of Bouma, Reference Bouma1962). Flute and groove marks are not very common at the base of the sandstones beds but are of great importance since they provide the best of the mean flow direction. Groove and flute marks observed in the study area typically have lengths of 11–21 and 6–10 cm, respectively, while flute marks typically exhibit widths of 2–4 cm.
5.a.2. Facies 1b: Thick-bedded (occasionally amalgamated) sandstone and mudstone
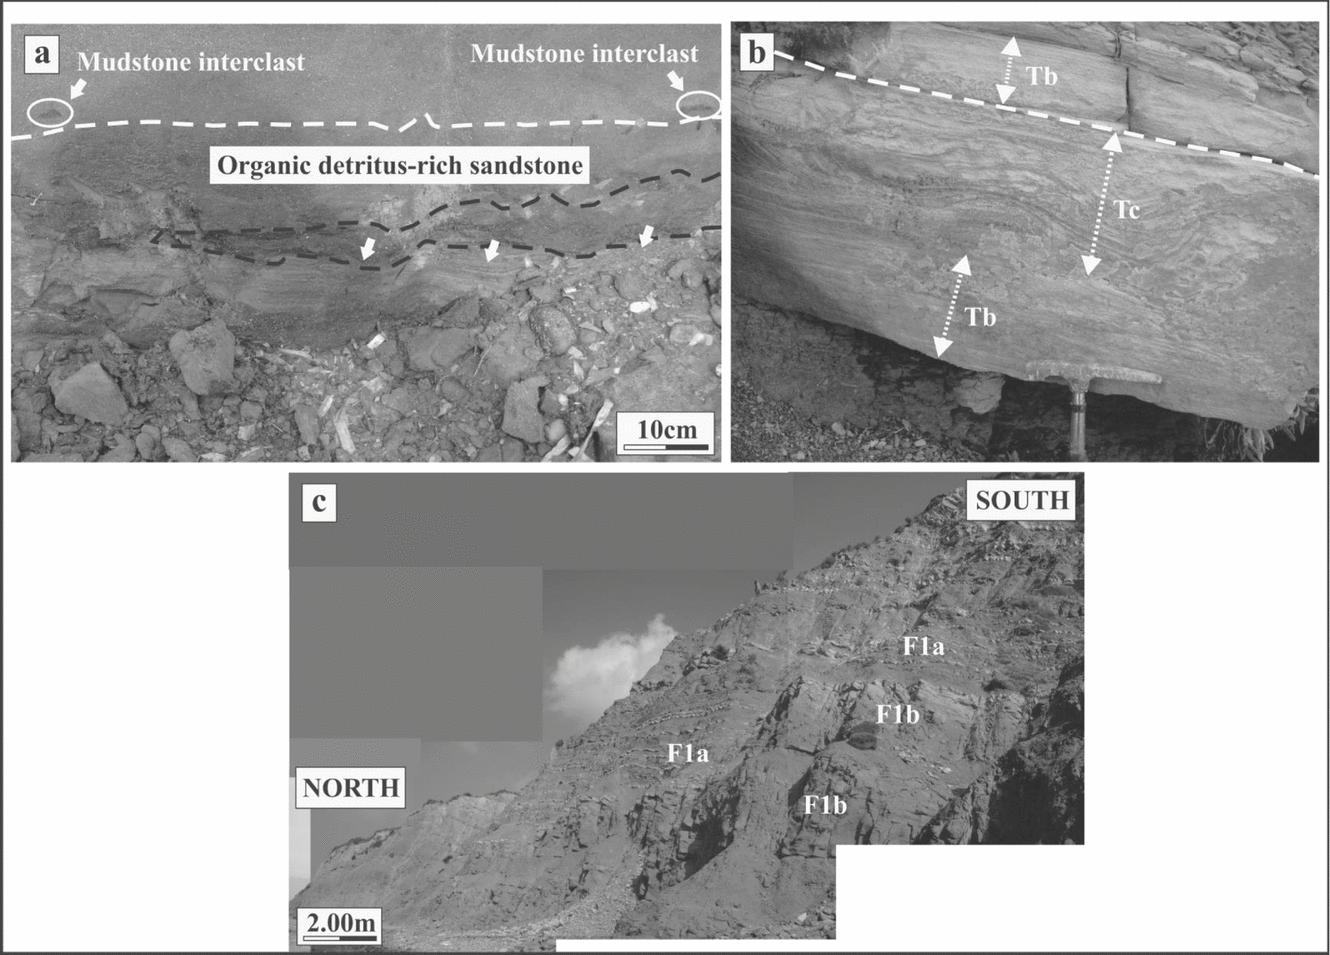
Facies 1b (F1b) consists largely of thick (0.5–3 m) to medium-bedded (0.1–0.4 m), thin to medium-grained sandstone in alternation with mudstone. Sandstone beds are typically structureless and normal graded while mudstone interclasts are common in the basal parts of some beds (Fig. 6a). High concentrations of organic detritus in the form of coal fragments are observed in F1b. In many cases, plane-laminated and ripple-laminated fine-grained sandstone is preserved (Fig. 6b). Vertical alteration of F1a and F1b is observed in the upper parts of thick sandstone-rich intervals (Fig. 6c). The mudstone-dominated successions are the product of dilute low-density turbidity currents (Td division of Bouma, Reference Bouma1962). Sole marks, at the base of the sandstones beds, occur more often than in F1a while the groove and flute marks observed typically have lengths of 15–25 and 6–10 cm, respectively, while flute marks typically exhibit widths of 3–5 cm.
Outcrop photographs of thick-bedded sandstone facies 1b (F1b). (a) Dashed line denotes amalgamation surface between underlying fine-grained structureless sandstone sedimentation unit and overlying medium-grained sandstone sedimentation unit containing sparse mudstone interclasts near base. Dark organic detritus is commonly concentrated in laminae and interbedded with mudstone. (b) Plane to ripple-laminated sandstone bed. Dashed line denotes amalgamation surface. (c) F1b is commonly interbedded with finer-grained, thinner-bedded F1a at the bedset scale. Tb, Tc – Bouma divisions.
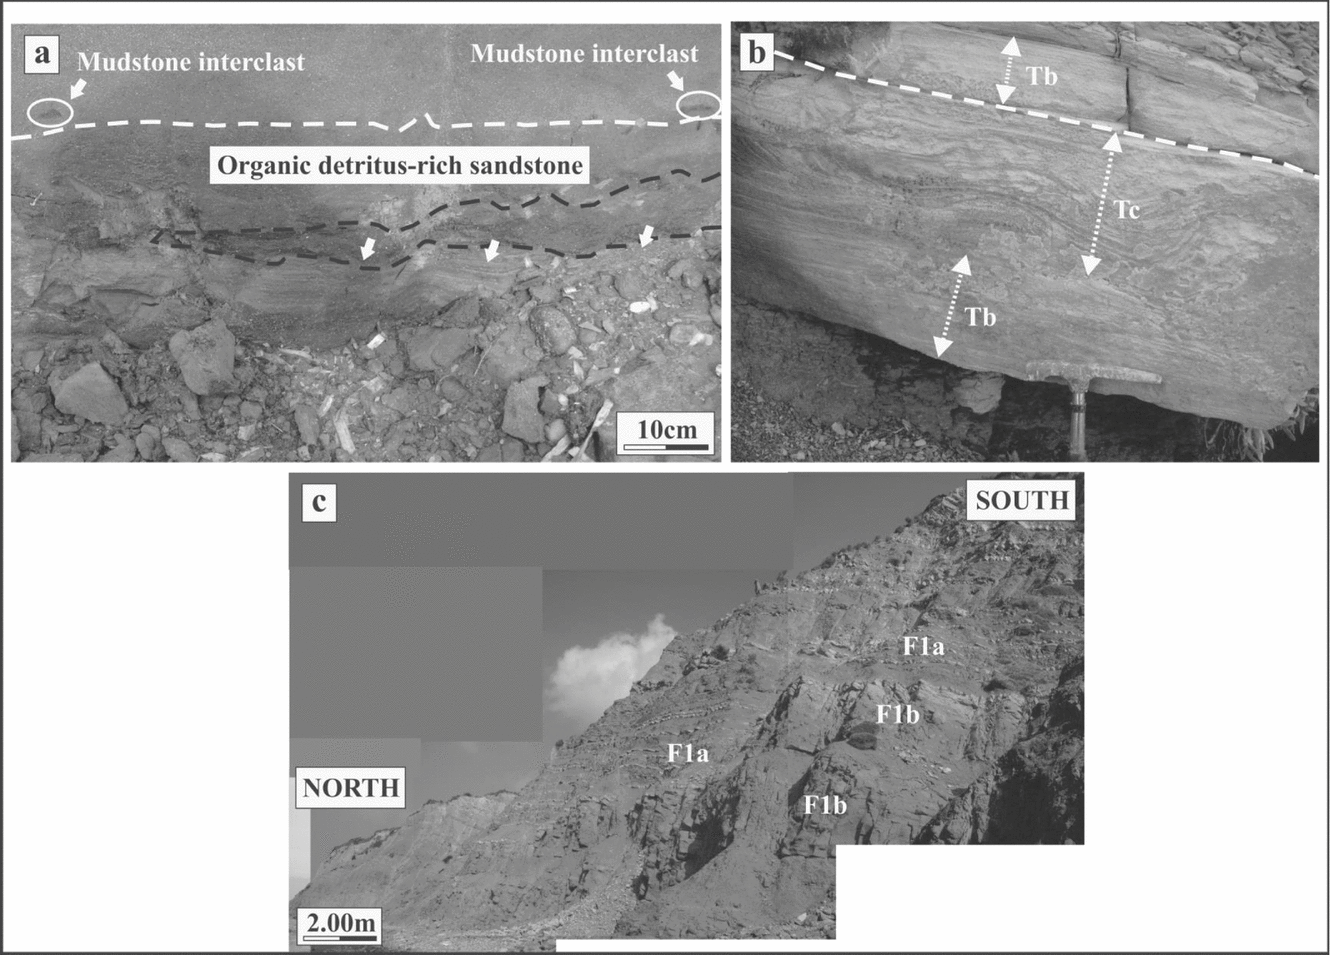
F1b deposition records the highest flow energy and/or degree of confinement recognized in the study area. F1b is dominated by deposits of high-density turbidity currents (sensu Lowe, Reference Lowe1982). Lack of internal sedimentary structures and normal grading indicate rapid sedimentation from suspension (S3 division of Lowe, Reference Lowe1982; Ta division of Bouma, Reference Bouma1962). Fine-grained to medium-grained, plane and ripple-laminated sandstone indicate traction sedimentation related to a waning low-density turbidity current phase of deposition (i.e. Tb division of Bouma, Reference Bouma1962).
5.b. Facies association 2: Mudstone with minor siltstone
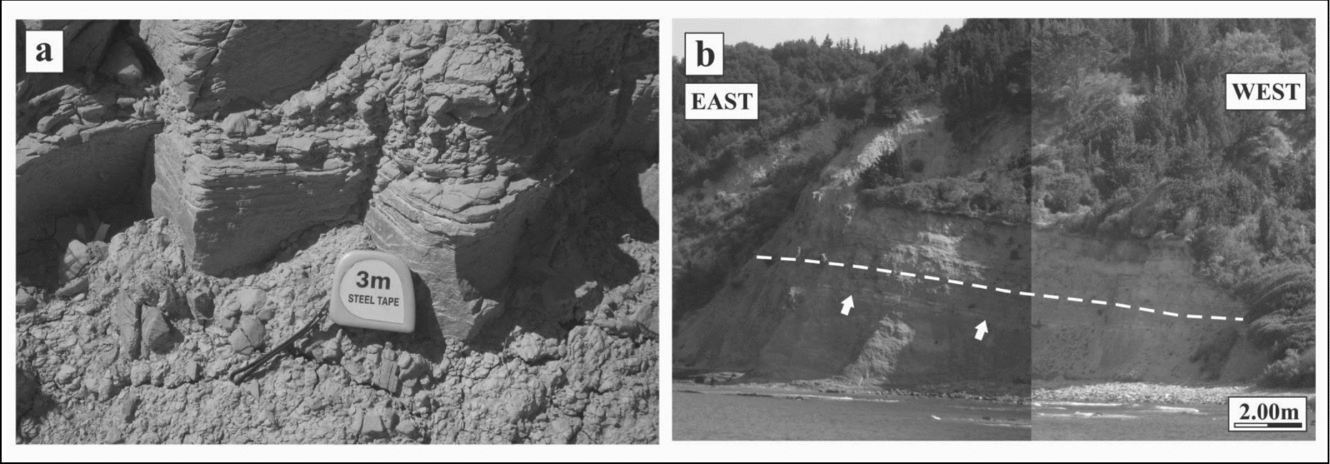
This facies association (F2) consists almost entirely of massive to laminated mudstone (Fig. 7a). Mudstone and thin (<5 cm) beds of very fine-grained sandstone are rare and occur in close stratigraphic proximity to the major sandstone-rich successions. The mud facies are moderately to intensively bioturbated while sandstone beds within mudstones are unusual, but when they occur they are very thin-bedded and fine-grained (Fig. 7b).
Outcrop photographs of mudstone with minor siltstone facies 2 (F2). (a) Massive to laminated mudstone. (b) Rare occurrence of fine-grained thin-bedded sandstone (white arrows) within F2 in close stratigraphic proximity to the major sandstone-rich successions. Dashed line marks the transition from mudstone-rich to sandstone-rich succession.
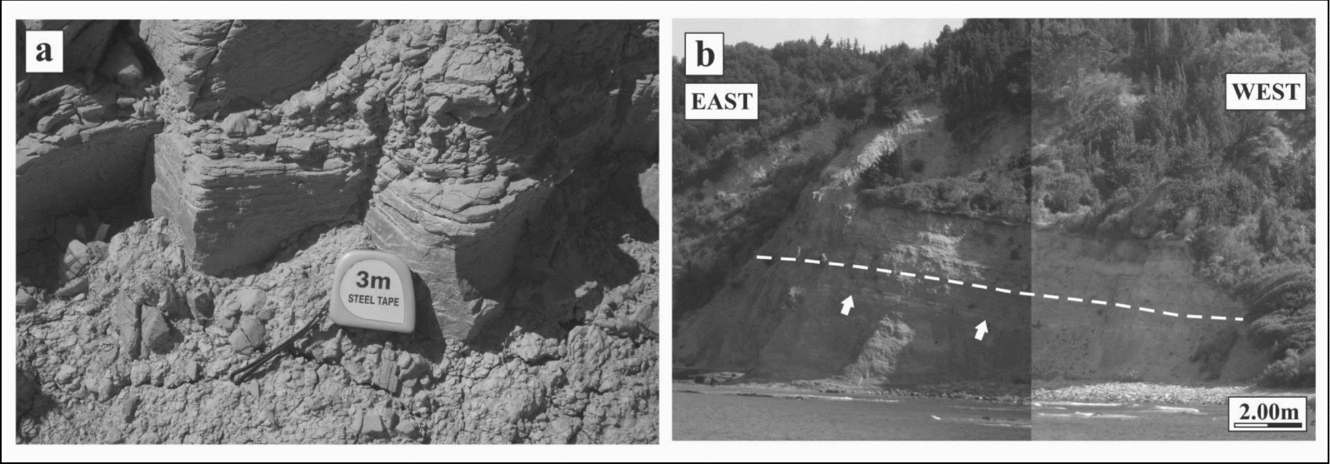
F2 is dominated by deposits from hemipelagic sedimentation or very dilute, low-density sediment gravity flows. The boundary between F2 and overlying strata is commonly, but not always, sharply overlain by F1 or, in some cases, mudstone-rich MTDs of facies association 3 (F3).
5.c. Facies association 3: Mass transport deposits
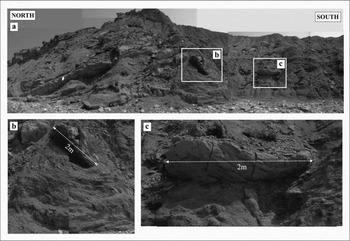
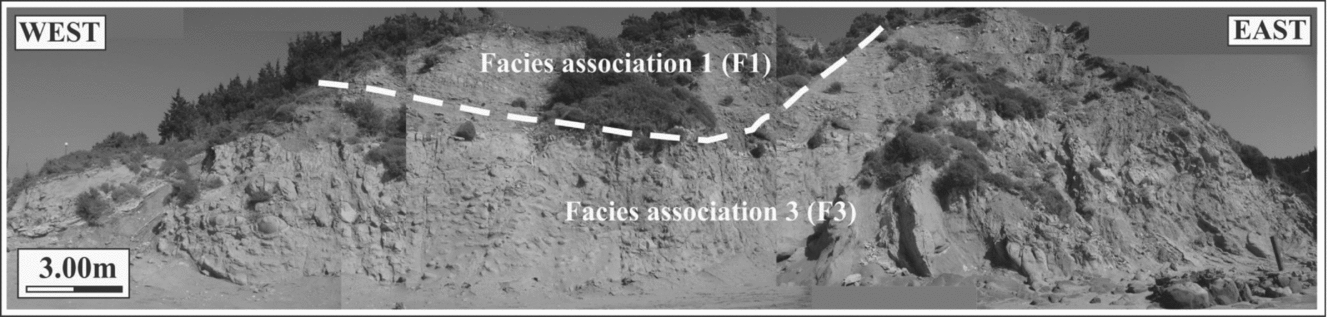
MTDs represent a volumetrically significant component in the study area and are associated with the fine-grained deposits which encase it. F3 is generally mudstone-rich with sparse and disorganized sections of sandstone (Fig. 8a). Discordant blocks of mudstone that typically show evidence of soft sediment deformation are common (Fig. 8b). MTDs contain deformed sandstone clasts up to 2 m in diameter (Fig. 8b, c). Contacts between discordant sections show no evidence of erosional truncation and commonly are disorganized to unrecognizable (Fig. 8). Internally, these discordant blocks display a range of soft-sediment deformation from nearly intact and displaced to chaotically folded and deformed blocks (Fig. 8).
Outcrop photographs of fine-grained facies associated with chaotic facies association 3 (F3). (a) Injected sand is commonly associated with chaotic, discordant mudstone. White arrow points to the angular surface separating blocks. (b) Discordant mudstone. Note the deformed sandstone clast within the mudstone matrix. (c) Lenticular sandstone bed within discordant mudstone.

These characteristics suggest complex sliding and/or slumping processes that are not associated with complete disaggregation of material during transport. Slump-generated topography on the sea floor influences the distribution of sediment from subsequent gravity flows, as evidenced by the occurrence of lenticular sandstone beds on top of slumped units locally (Fig. 8b, c). The primary sedimentological characteristics of the transported blocks are similar to those described for F1a.
6. Sedimentary bodies
Sedimentary bodies, or depositional elements, are the fundamental building blocks that make up a deep-water succession (Mutti & Normark, Reference Mutti, Normark, Weimer and Link1991; Pickering et al. Reference Pickering, Clark, Ricci Lucchi, Smith, Hiscott, Kenyon, Pickering, Hiscott, Kenyon, Ricci Lucchi and Smith1995). Characterizing the geometry, spatial configuration (i.e. architecture) and palaeoflow attributes of sediment gravity flow deposits within the context of sedimentary bodies is essential for interpreting the palaeogeomorphic evolution of a system (Romans et al. Reference Romans, Hubbard and Graham2009). These fundamental bodies are used here to characterize the evolution of this system and record a combination of processes and geomorphic conditions over time, and thus rarely represent a single geomorphic element.
Three sedimentary body types are recognized in the study area: (1) channel-fill, (2) non-amalgamated wedge and (3) MTDs. Apart from MTDs, these body types are defined by cross-sectional geometry, internal bedding architecture and facies distribution.
6.a. Channel-fill
Characterization of channel-fill successions in deep-water outcrops is an active area of deep-water research (Hickson & Lowe, Reference Hickson and Lowe2002; McCaffrey et al. Reference McCaffrey, Gupta and Btunt2002). The genetic inference of channelization for this body type is derived primarily from evidence for significant erosional truncation of underlying strata. The underlying strata are typically mud-rich deposits genetically unrelated to the development of the overlying channel-fill body and its fill. The basal erosional surface is a composite surface, suggesting that the feature was a conduit of numerous sediment gravity flows over a period of time. The nature of the fill is highly variable and can be quite complex, as evidenced by smaller-scale cut-and-fill features and juxtaposition of F1a and F1b.
6.b. Non-amalgamated wedge
The non-amalgamated wedge body type is based primarily on cross-sectional geometry. The wedge shaped is typically achieved over the lateral scale of tens of metres and is a result of the depositional thinning and/or complete pinching out of sandstone bedsets of F1a into more mudstone-rich deposits. This body type has a low proportion of thick-bedded sandstones (F1b) and in some cases is predominantly mudstone with some very fine-grained sandstone beds.
6.c. Mass transport deposits
MTDs are readily distinguishable from the other facies associations because of their mudstone-rich and internally disorganized nature. This body type has a direct relationship with the facies association (F3) that describes it. MTD bodies do not exhibit a repeated or systematic shape, and appear to grade into concordant shale (F2) in some cases.
7. Stratigraphic evolution
The study area is characterized by the cyclic packaging of sandstone and mudstone units that form two distinct sedimentary cycles. Three stratigraphic units within each cycle have been distinguished (Fig. 3). Patterns of facies distribution and types of sedimentary bodies are evaluated for each of the three stratigraphic units. The stratigraphic sub-units (3a and 3b) represent one of the three sedimentary body types. Interpretations of depositional processes and setting are summarized through an analysis of the lateral and vertical relationships within and among the sub-units. Several outcrops were selected in order to define facies distribution and stratigraphy in the study area. The stratigraphic architecture and the two-dimensional geometry were further determined by means of several stratigraphic cross-sections that are constructed by arranging composite columnar sections.
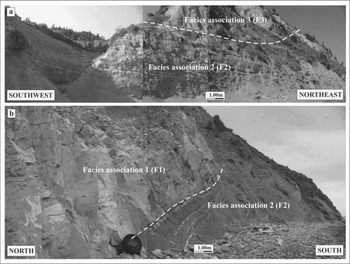
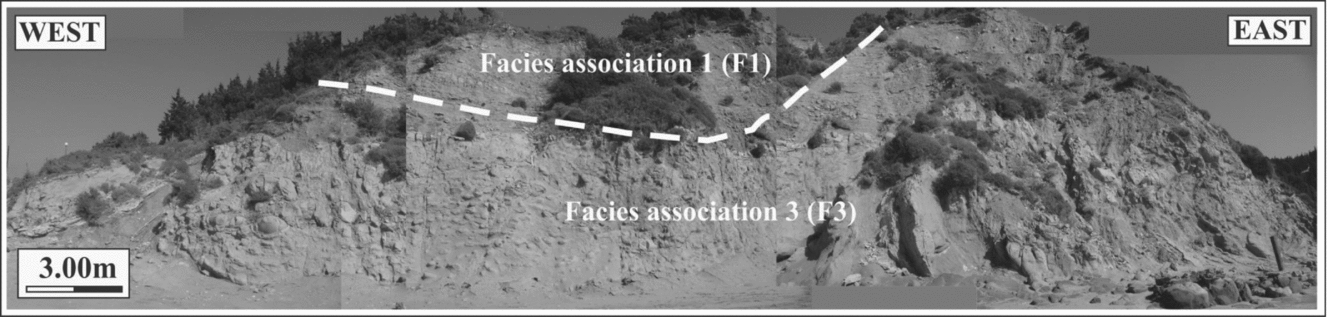
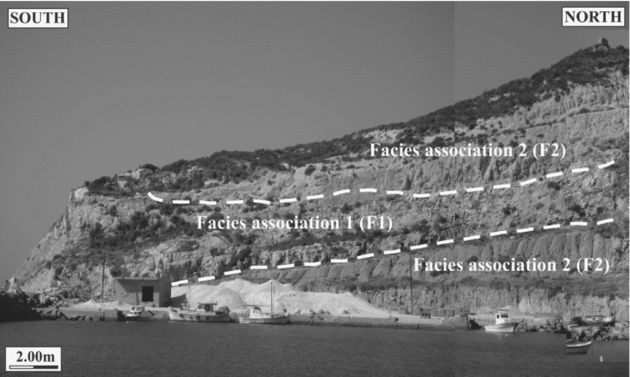
Unit 1 is the lowest sedimentary succession exposed at the study area, is approximately 7 m in total thickness and consists of F2. The boundary between F2 and overlying strata is commonly, but not always, a composite erosional surface that shows evidence for truncation of these mud-rich strata. F2 mostly overlie the mudstone-rich MTDs of F3 (Fig. 9a) or, in some cases, F1 (Fig. 9b). The overlying unit 2 consists of F3, is 8 m in total thickness and has a relatively sharp contact with the overlying unit 3, suggesting minimal erosion (Fig. 9a). This unit, which represents remobilized sedimentary layers, is generated from slumping and/or sliding on sloped surfaces. The lowering of sea level has been observed to destabilize the upper slope, instigating mass-wasting of fine-grained material onto the basin. The occurrence of large-scale mass-transport complex deposits within the entire study area supports this hypothesis. The overlying unit 3 (Fig. 10) is well-exposed in the study area, is approximately 7 m in total thickness and is subdivided into two main sub-units, 3a and 3b.
Outcrop photographs of mudstone with minor siltstone facies association 2 (F2) in Ereikousa Island that underlay (a) facies association 3 (F3) and (b) facies association 1 (F1), respectively.

Outcrop photographs of the thick-bedded (occasionally amalgamated) sandstone and mudstone facies association 1 (F1) in Ereikousa Island that overly facies association 3 (F3).
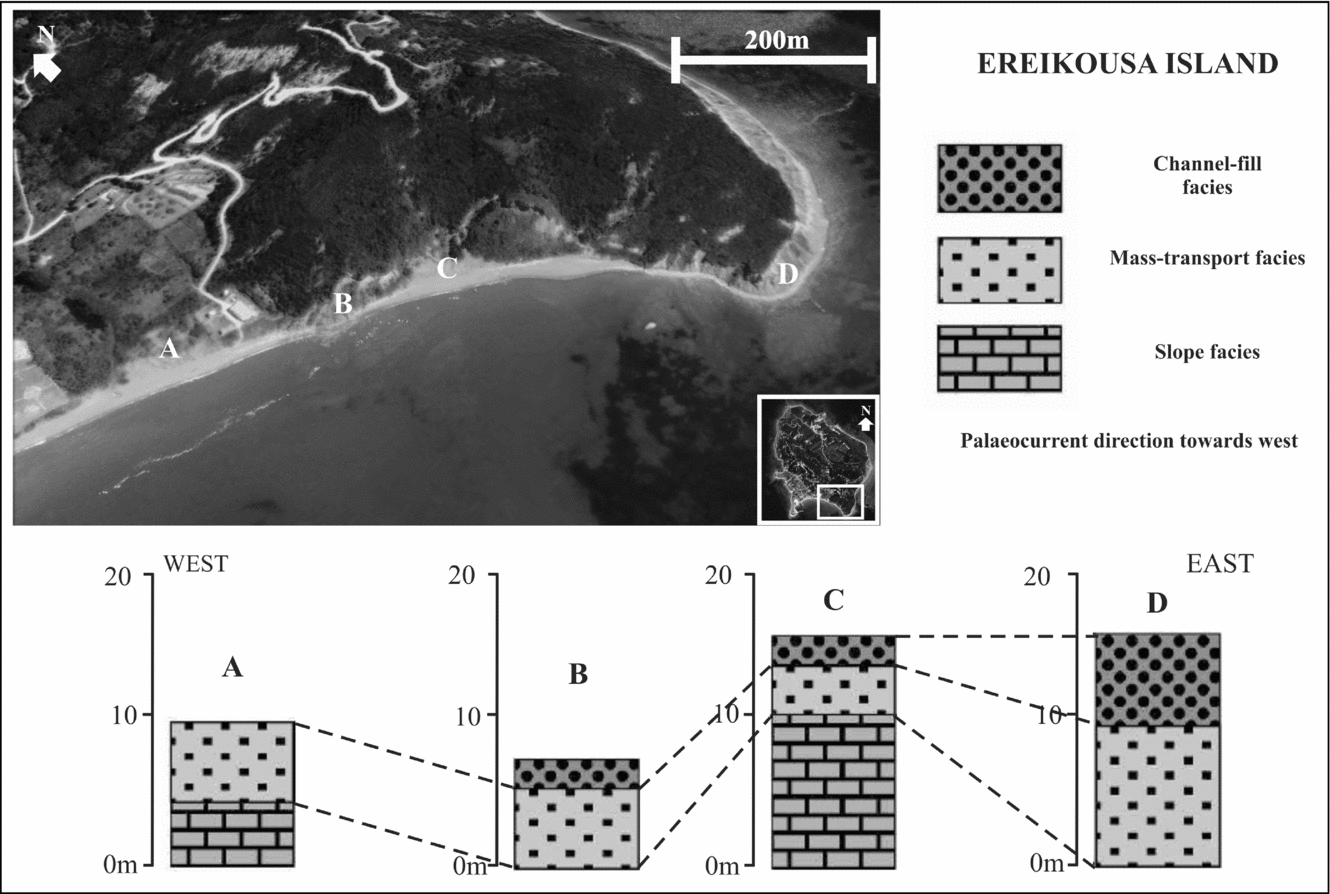
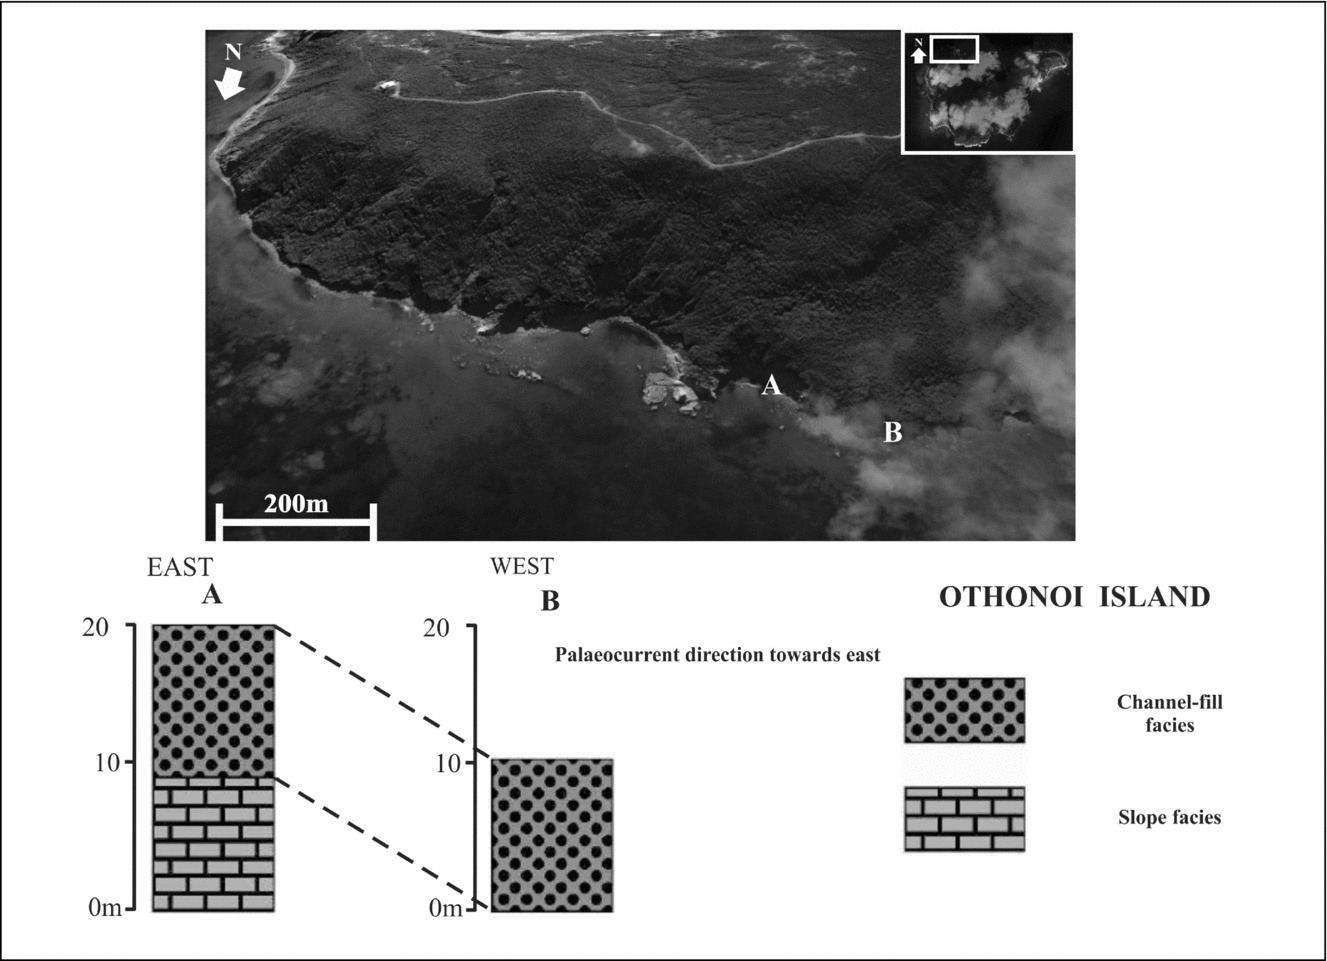
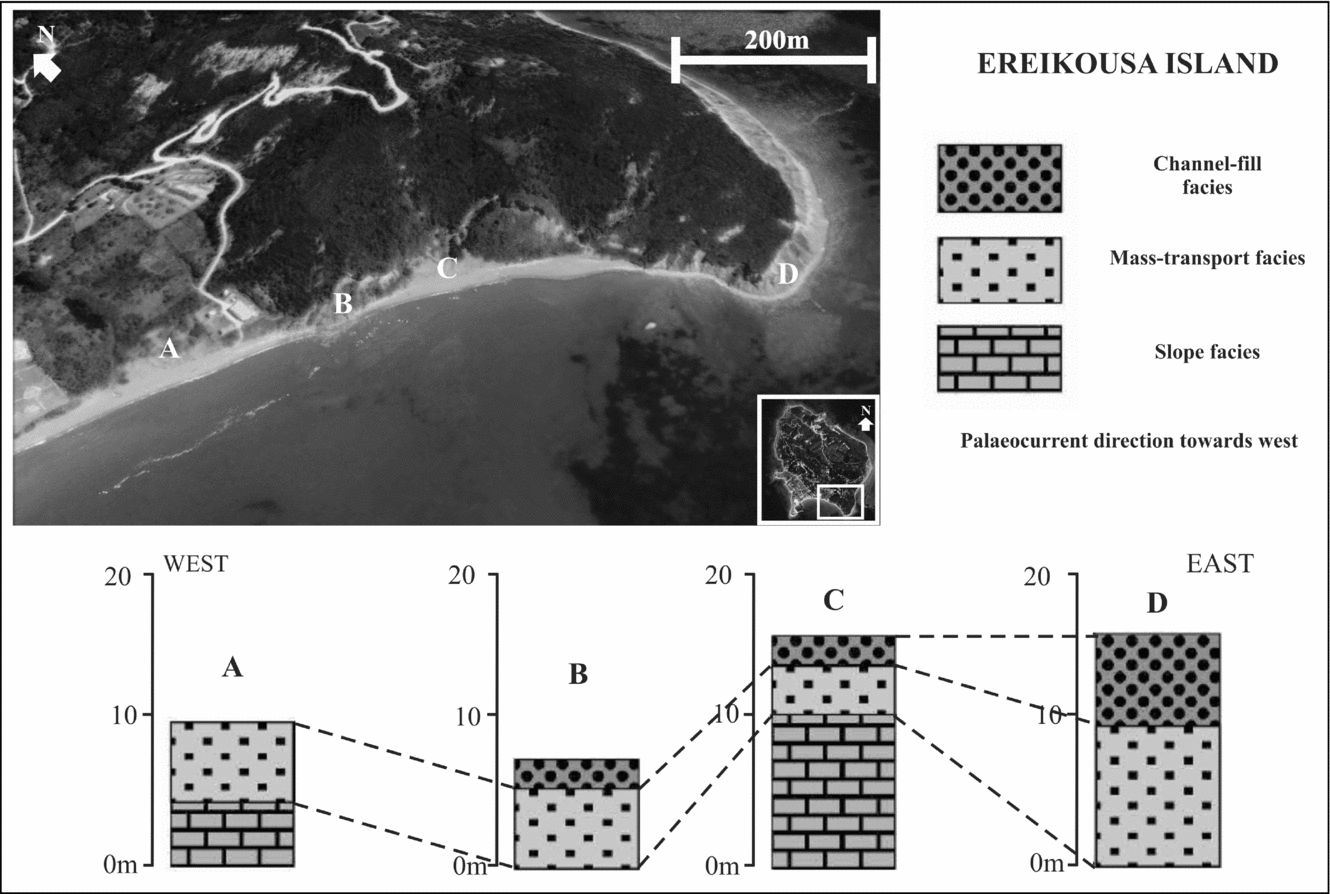
The internal architecture of sub-unit 3a is characterized by complex cut-and-fill features that juxtapose F1a and F1b. Sub-unit 3a (approximately 4 m in total thickness) has been described here as a channel-fill sedimentary body that records the formation and subsequent filling of a submarine channel. This interpretation is based on the onlapping internal architecture. The internal cut-and-fill architecture reflects a history of erosion and bypass combined with deposition as accommodation created by the initial channelization is filled. The correlation diagrams (Figs 11, 12), constructed slightly parallel to the main palaeoflow direction, display the gradual transition from F2 to F3 and F1. The thickening of the channel-fill sedimentary body towards the channel axis is also presented.
Correlation diagram of Ereikousa Island's stratigraphy showing four measured outcrops and distribution of several facies associations in western parts of the study area. Measured outcrops were correlated physically in the field. The regional palaeoslope is to the west (left). Note the gradual transition from facies association 2 (F2) to facies associations 1 (F1) and 3 (F3).
Correlation diagram of Othonous stratigraphy showing two measured outcrops and distribution of several facies associations in eastern parts of the study area. The regional palaeoslope is to the east (left). Note the gradual transition from facies association 3 (F3) to facies association 1 (F1).
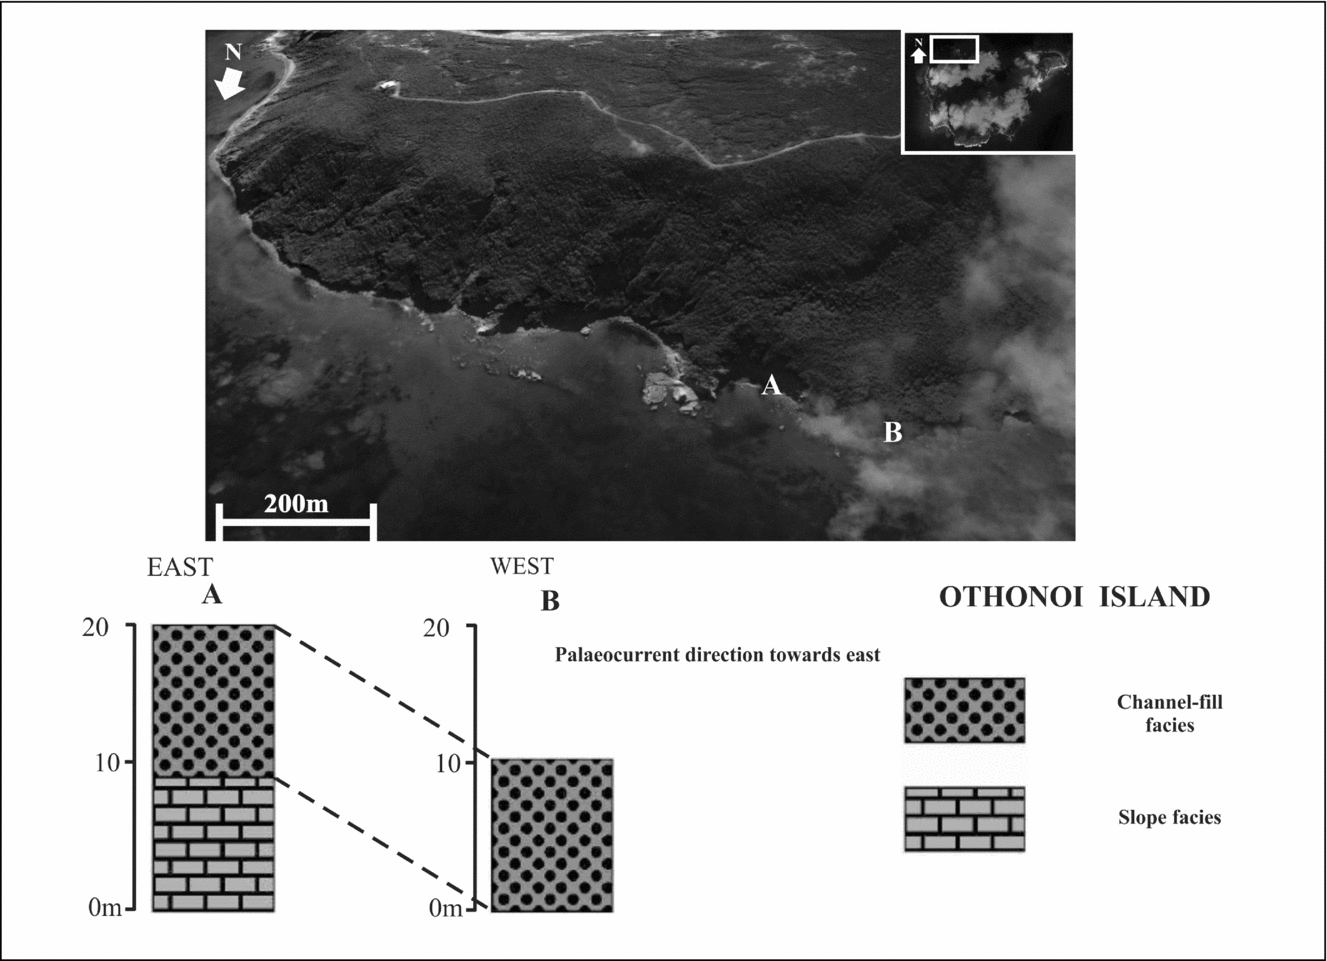
Sub-unit 3b (approximately 3 m in total thickness) directly overlies sub-unit 3a and is distinguished by the channel-fill sedimentary body 3a by: (1) a widespread stratigraphic surface, (2) internal characteristics and (3) the overall geometry. Sub-unit 3b is less lenticular and richer in thin-bedded turbidites (F1a) than sub-unit 3a. Internally, it exhibits evidence for lateral changes of facies as a result of depositional thinning of individual sandstone beds.
Together, these two units form a larger complex that reflects the filling of accommodation that initially formed as a result of channelization. As the channel-fill accommodation was filled (sub-unit 3a), subsequent flows responded to a diminished gradient and smoother topography as a result of preceding deposition (sub-unit 3b). This stacking pattern is probably a result of migration of the axial part of the system away from this site. The upper boundary of sub-unit 3b is characterized by a sharp boundary with overlying concordant mudstone (F2; Fig. 13) and MTDs (F3), suggesting an avulsion process.
Outcrop photograph of the thick-bedded (occasionally amalgamated) sandstone and mudstone facies association 1 (F1) in Ereikousa Island that overly facies association 2 (F2), suggesting an avulsion process.

The deposition of sub-unit 3a marks the end of the first cycle of sedimentation (up to 20 m in total thickness) while the overlying F2 (approximately 30 m in total thickness) marks the next sedimentary cycle initiation. Thus, MTDs (F3) (up to 10 m in total thickness) overlie these sediments while a thick unit (approximately 16 m in total thickness) of F2 mudstone intervenes before the 5-m thick unit 3 (F1a and F1b). Accumulation of F2 (approximately 6 m in total thickness) above the channel-fill facies marks the next sedimentary cycle but cannot be seen in the study area.
Patterns of facies distribution and types of sedimentary bodies observed in the study area suggest a lower slope channel-fill complex environment. This interpretation is based on: (1) evidence of erosion and sediment bypass along the basal bounding surface; (2) onlap of beds/bedsets onto the basal bounding surface and overall pinch-out of the channel-fill body; and (3) internal cut-and-fill architecture. These attributes are characteristic of the mixed erosional/depositional channel-fills described in the literature (Mutti & Normark, Reference Mutti, Normark, Legett and Zuffa1987) and reflect increased gradient conditions and sediment supply relative to underlying strata.
8. Age determination/palaeocurrent analysis
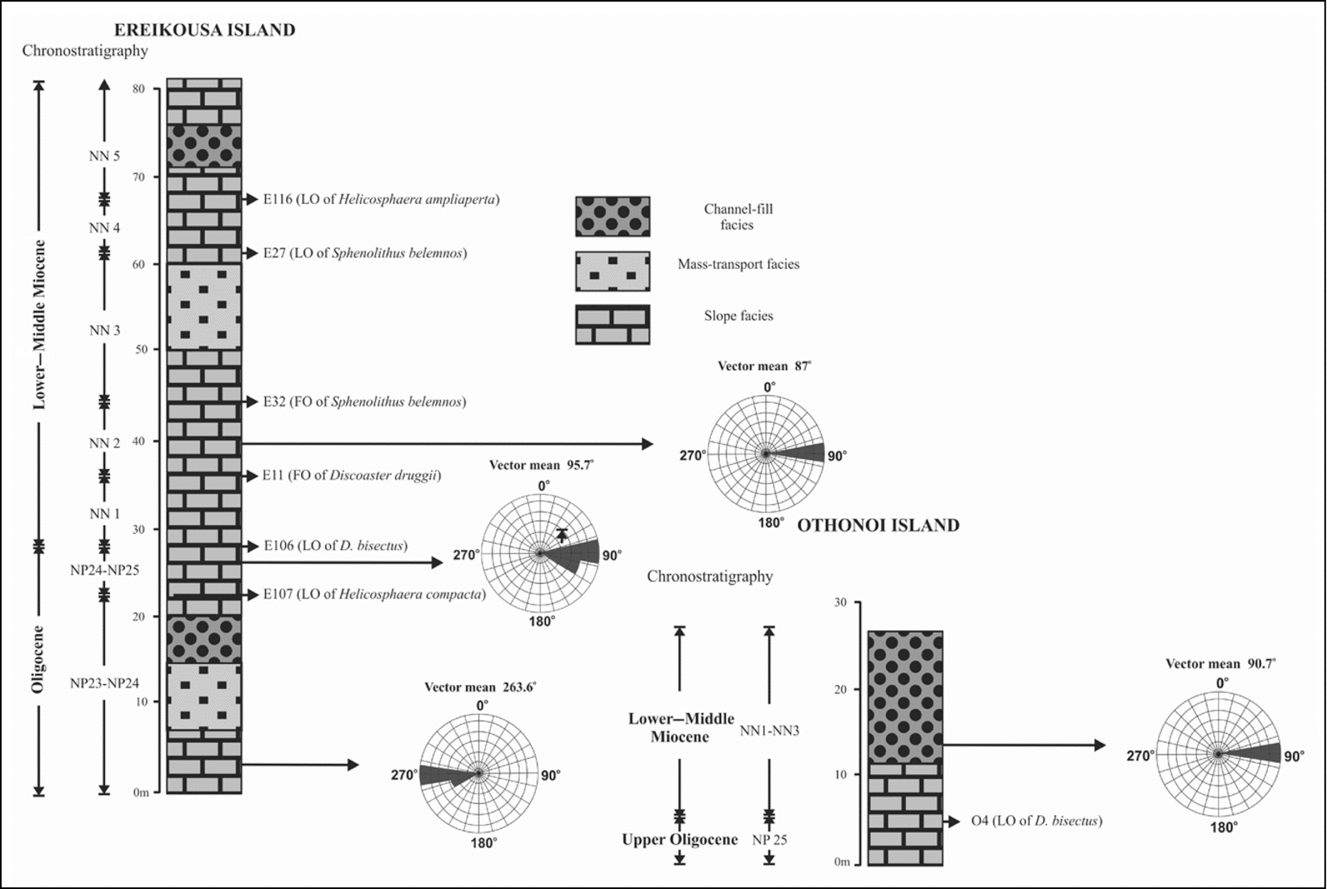
A precise biostratigraphic dating of the succession was obtained through the analysis of calcareous nannofossils. Sediments are of Late Oligocene to Early–Middle Miocene in age (NP23–NN5). The occurrence of reliable index species allowed us to identify several nannoplankton zones in the Othonous and Ereikousa Islands (Fig. 14).
Palaeocurrent direction, range chart for the recognized reliable index of calcareous nannofossils species and recognized nannoplankton zones on the Diapondia Islands.
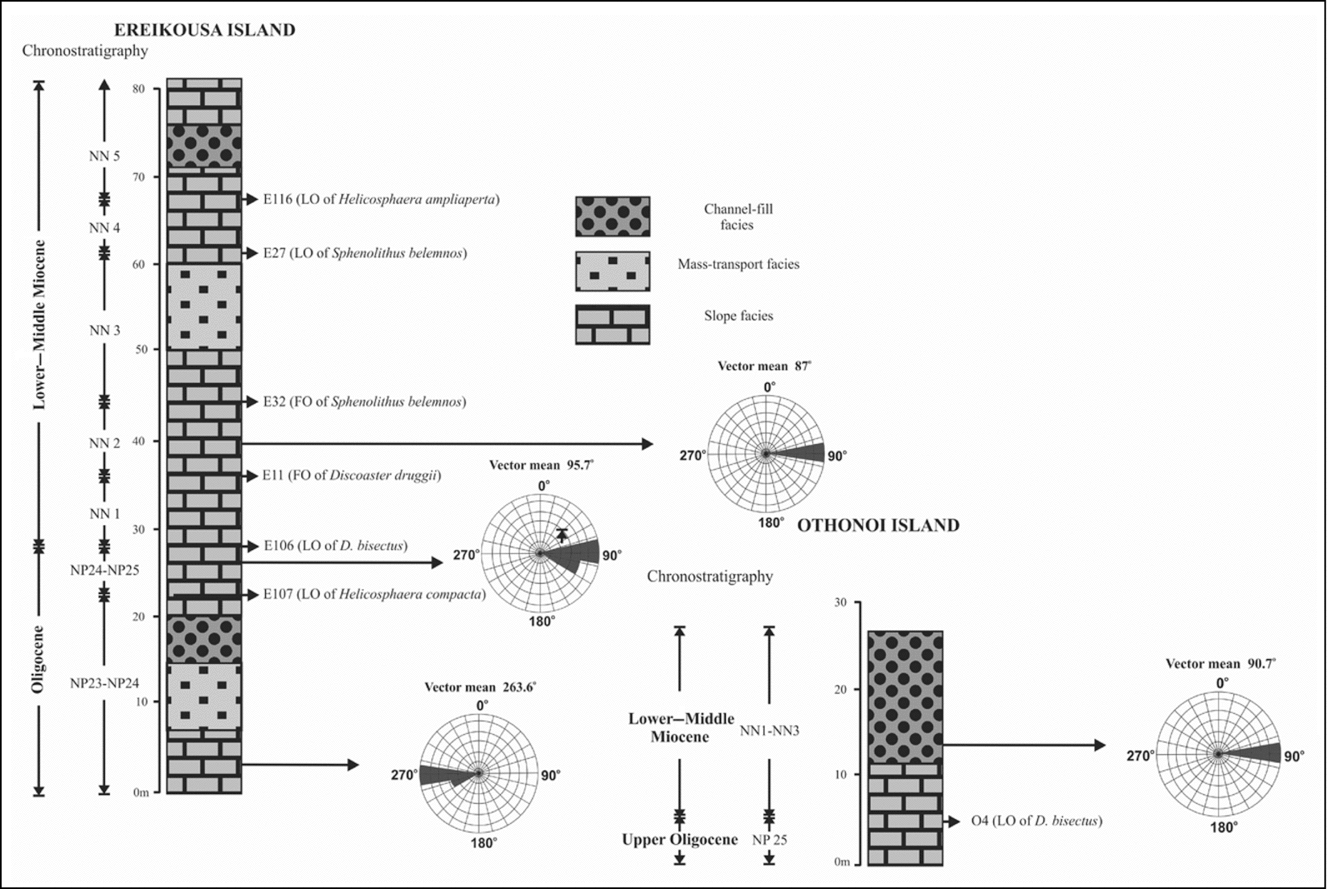
In particular, the last occurrence (LO) of Helicosphaera compacta has been used in this study as a rough index of the NP23/NP24 boundary. The Oligocene–Miocene boundary in terms of calcareous nannofossils is placed at the top of NP25 by some authors and within NN1 by others (Perch-Nielsen, Reference Perch-Nielsen, Bolli, Saunders and Perch-Nielsen1985). In this study this boundary is defined by the LO of Discoaster bisectus. The NN1 zone is defined by the LO of Helicosphaera recta to the first occurrence (FO) of D. druggii. The base of the NN2 zone is defined by the FO of D. druggii. This interval ends with the LO of Triquetrorhabdulus carinatus, which has not been observed in studied samples. The NN3 zone is defined by the FO and LO of Sphenolithus belemnos. This interval has been dated as Burdigalian and records high abundances of S. conicus and S. moriformis. The NN4 zone is defined by the LO of S. belemnos to the LO of H. ampliaperta. This interval has been dated as Langhian, while the occurrence of Cyclicargolithus floridanus (sample E116) is suggested to be close to upper NN4 parts. The base of the NN5 zone is defined by the LO of H. ampliaperta. This interval has been dated as Early–Middle Miocene and records abundances of C. floridanus and S. moriformis.
Nannofossil abundance, species richness and preservation of nannofloral assemblages in study samples are generally good. Slight reworking is indicated by the presence of a few Cretaceous, Paleocene and Eocene species. Cretaceous species mainly consist of Arkhangelskiella cymbiformis and Uniplanarius gothicus, whereas Fasciculithus and Fasciculithus spp are the dominant species of the reworked Paleocene nannofloral assemblage. Occurrences of D. lodoensis, D. germanicus, Reticulofenestra umbilica and Rhabdosphaera inflate indicate Eocene reworking. The Ereikousa and Othonoi Islands, in relation to calcareous nannofossils biostratigraphy, display a gradual transition from Late Oligocene (NP23) to Early–Middle Miocene (NN4).
To estimate the palaeoflow direction, palaeocurrent data from four outcrops were collected and the flute and groove marks measured. Data were derived from both channel-fill and slope deposits. The number of measurements from each outcrop ranged from 10 to 17 and were plotted in rose diagrams. Rose diagrams that had a consistency ratio less than 0.7 were not taken into consideration during interpretation of the results. Palaeocurrent indicators at the base of the sandstone beds are directed towards the west during the Late Oligocene time, while an eastward palaeoflow direction seems to have dominated the study area since Early Miocene time (Fig. 14). This interpretation is based on the occurrence of eastward-directed flute marks at the base of sandstone beds on the west Ereikousa and Othonous Islands, and can be attributed to major orogenic events that took place in the study area at the end of Burdigalian time (e.g. the inversion of the Ionian Basin succession).
9. Organic geochemical investigations
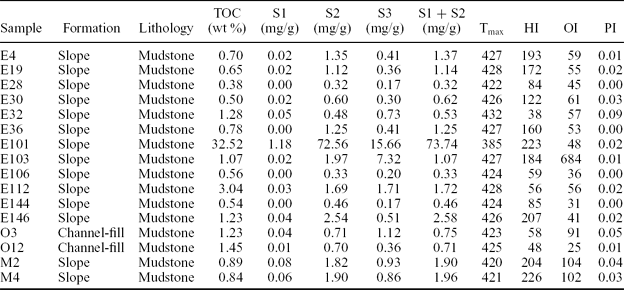
A total of 53 mudstone samples from the Diapondia Islands were selected for establishment of the petroleum-generation potential and assessment of the regional thermal maturity. Since the principal parameter in source rock identification is the total OM content (% TOC), only samples with TOC > 0.5% were taken into consideration for further analyses (Table 1).
Total organic carbon (TOC wt %) values and results of Rock-Eval II pyrolysis of the selected samples.
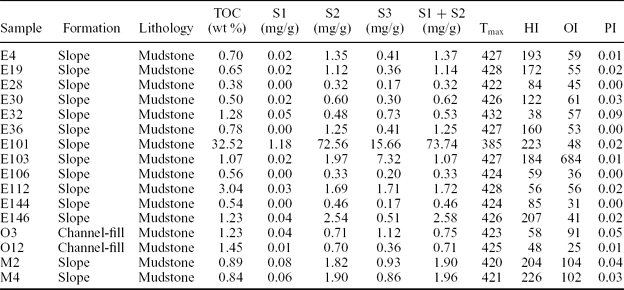
HI – hydrogen index; OI – oxygen index; PI – production index
9.a. Source rock potential
The obtained TOC content suggests that the studied samples can be designated as potential source rocks (TOC > 0.5%). Organic carbon content exhibits variable richness, ranging from 0.5 (sample E30) to 32.52% (sample E101), suggesting from fair to very good source rock potential. On the basis of the amount of organic carbon, the study area contains samples that might be of slight interest (between 0.5 and 1.0%, samples E4, E16, E19, E30, E36, E106, E144, M2 and M4) and are definitely worthy of further consideration (>1.0%, samples E32, E101, E103, E112, E146, O3 and O12). Nevertheless, TOC is not a clear indicator of petroleum potential. For example, graphite is essentially 100% carbon, but it will not generate petroleum.
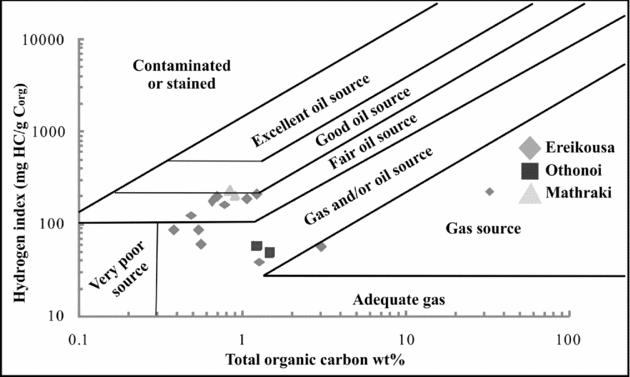
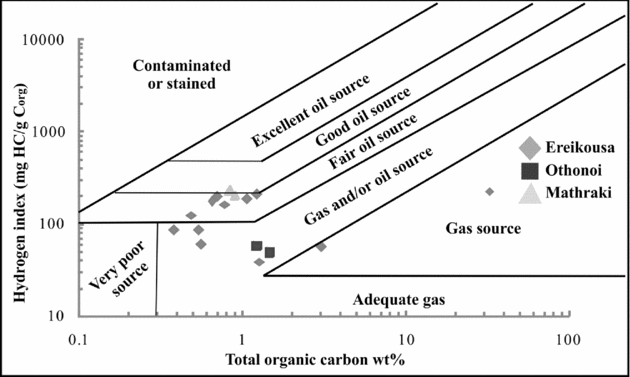
Some Tertiary deltaic marine mudstones contain up to 5% TOC but generate little if any petroleum due to the OM being gas prone or inert (Peters & Cassa, Reference Peters, Cassa, Magoon and Dow1994). Thus, high TOC values are a necessary, but not a sufficient, criterion for good source rocks. HI values and hydrocarbon generation potential SP and S2 are indicative of the quality of OM. A better rating of source rock potential is given by a cross plot of HI versus TOC. This plot clearly suggests hydrocarbon potential since samples represent diverse source types ranging from gas to good oil source (Fig. 15). However, with the ratings obtained from these plots it is necessary to integrate the chemistry with the maturation data and description of OM before a rock can be truly considered as having potential for oil. The ratings, however, do give a good indication of the relative hydrocarbon source potential (Jackson et al. Reference Jackson, Hawkins and Bennett1985).
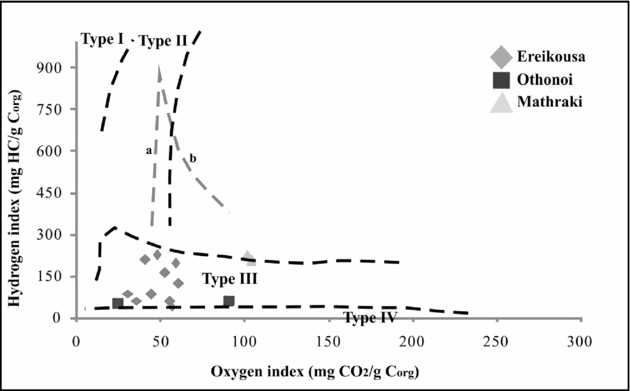
Results of Rock-Eval II pyrolysis plotted on a hydrogen index versus oxygen index kerogen classification diagram.
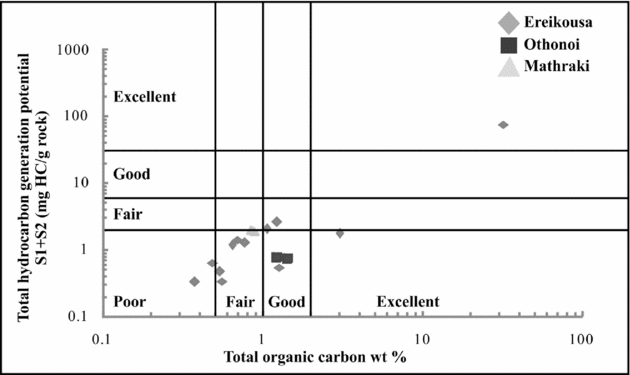
SP is defined as the total generative hydrocarbon potential determined by the Rock-Eval II pyrolysis (S1 + S2). Rocks with SP less than 2 kg/t suggest insignificant oil but some gas potential, rocks with SP ranging between 2 and 6 kg/t are classified as moderately rich source rocks with fair oil potential and rocks with SP greater than 6 kg/t are classified as good to excellent source rock potential (Tissot & Welte, Reference Tissot and Welte1984; Dymann et al. Reference Dymann, Palacos, Tysdal, Perry and Pawlewicz1996). The total generative hydrocarbon potential ranges between 0.32 and 73.74 mgHC/g rock (samples E28 and E101, respectively) and is typical of sediments with fair/moderately rich and very good gaseous potential (Fig. 16).
Source rock characterization using plot of total hydrocarbon generation (S1 + S2) versus total organic carbon (TOC) (Hunt, Reference Hunt1995).
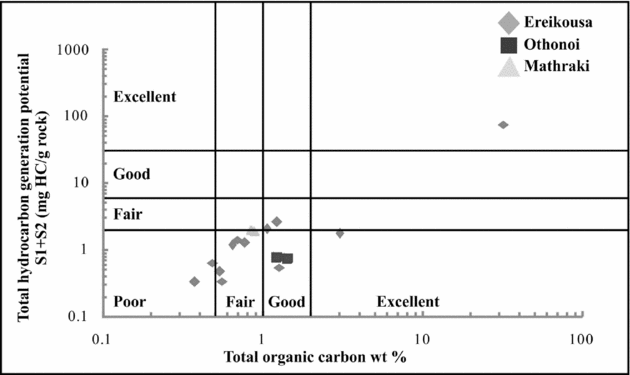
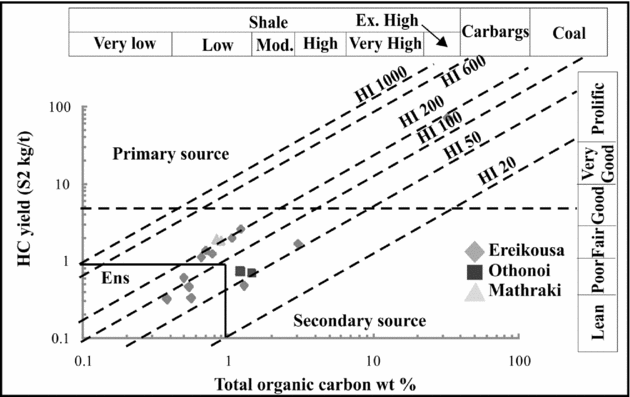
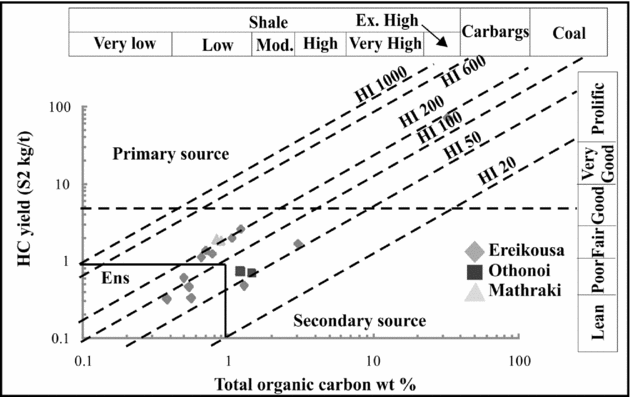
Note that the results of Rock-Eval II analyses from outcrops should be interpreted with caution since OM may have been oxidized, resulting in low S1 and S2 values and eventually in deterioration of organic geochemical parameters (Peters, Reference Peters1986; Lafargue et al. Reference Lafargue, Marquis and Pillot1998). Moreover, the results provide information only on the present-day hydrocarbon generative capacity of kerogen in the rock (Lafargue et al. Reference Lafargue, Marquis and Pillot1998; Behar et al. Reference Behar, Beaumont, De and Penteado2001). The hydrocarbon yield S2 versus TOC cross-plots of Burwood et al. (Reference Burwood, De Witte, Mycke, Paulet and Katz1995) classified effective primary source rocks as those having S2 > 5 kg/t of rock, and effective non-source rocks (ENS) grouping below S2 < 1 kg/t of rock. A summary of this source rock information plot classifies the studied mudstones principally as secondary source rocks with potential to generate gas (Fig. 17).
Distribution of the source rock quality of the studied samples. The primary source field is ascribed to sediments with S2 > 5 kg/t of rock. ENS, effective non-source field. Carbags – any sediment containing 10 to 60% disseminated carbonaceous matter.
9.b. Organic material type
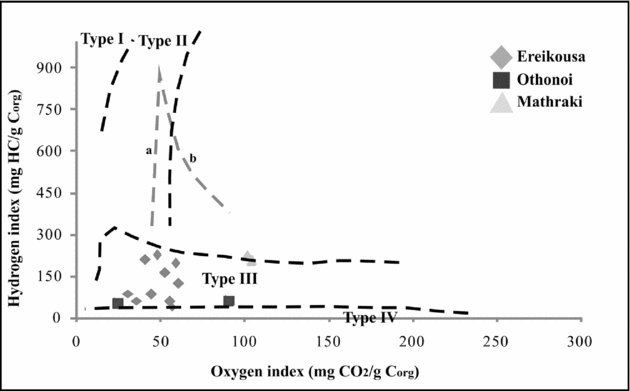
The HI values of the Upper Oligocene to Lower–Middle Miocene continental slope sequence vary between 38 mgHC/g TOC (sample E32) and 226 mgHC/g TOC (sample M4). Application of the Bordenave (Reference Bordenave and Bordenave1993) and Jones (Reference Jones and Palacas1984) classification schemes indicates the occurrence of type III kerogen, which is suitable for gas generation. Type III kerogen is attributed to partially oxidized terrestrial OM deposited in a self/slope environment. To further determine the kerogen types, the HI–OI diagram was used. The application of this diagram indicates that all the examined mudstones are suitable for gas production since they contain OM of type III kerogen (Fig. 18). The samples M2 and M4, which might potentially exhibit some oil-generation potential and are plotted within or very close to the type II kerogen field, have very low S2/S3 values and thus the oil generation should be excluded.
Results of Rock-Eval II pyrolysis plotted on a hydrogen index versus oxygen index kerogen classification diagram.
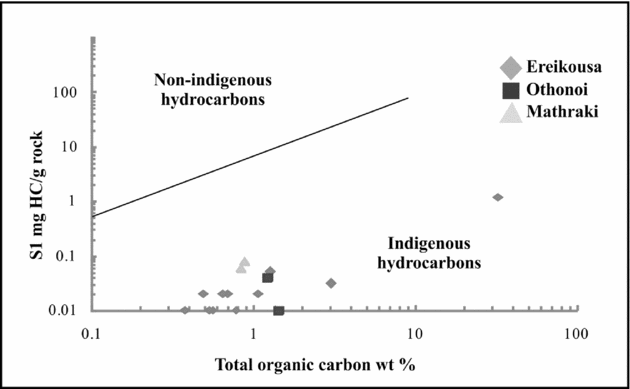
The examined mudstones, with HI values below 250–300 mgHC/g TOC and TOC < 1.5%, suggest the absence of a significant amount of oil-generative lipid materials. Their gaseous generation potential is further indicated using the HI and S2/S3 scheme proposed by Peters (Reference Peters1986). Most of the studied samples have HI values below 150 mgHC/g Corg and S2/S3 ratios below 3, typical values of a gas prone source. Even though mudstones with HI values that range between 150 and 300 HC/g Corg and S2/S3 ratio above 3 occur, they contain OM of type III kerogen and thus oil-generation potential is unlikely. The S1–TOC diagram further indicates autochthonous hydrocarbon production with gas-generation potential (Fig. 19).
Plot of S1 vs TOC wt % (Hunt, Reference Hunt1995).

9.c. Thermal maturity
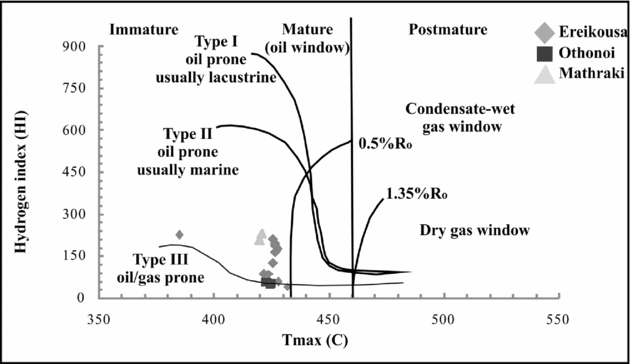
The thermal maturity of the OM can be determined by pyrolysis analyses (Tmax, PI) and organic petrographic methods (e.g. spore-colour index, vitrinite reflection). An assessment of the degree of thermal maturity reached by the studied Tertiary rocks is provided by Tmax, values which vary between 421 and 487°C (average 427°C). Because of the relatively small thickness of studied intervals (20–25 m), the large range in Tmax cannot be assigned to differences in the maturity of the OM and is most likely due to differences in the amount of recycled and oxidized OM. In any case, the studied Tertiary rocks are immature with respect to oil generation and so have not experienced high temperature during burial and therefore contain very little charcoal or recycled material from older mature rocks. In the HI–Tmax diagram, Tmax values suggest that all studied mudstones are of immature oil stage but close to the mature oil window, indicating a gas-prone type III kerogen (Fig. 20).
Classification of kerogens of Ereikousa Island on a hydrogen index versus Tmax diagram.

10. Discussion
Cyclic packaging of sandstone and mudstone units within the continental slope system on the western flanks of the Hellenic FTB, on the Diapondia Islands, can be ascribed to dominant allogenic drivers, such as (1) global eustatic changes (Vial et al. Reference Vial, Hardenbol and Todd1984; Posamentier et al. Reference Posamentier, Jervey, Vial, Wilgus, Hastings, Kendal, Posamentier, Ross and Van Wagoner1988); (2) tectonism (i.e. uplift/subsidence) (Catuneanu et al. Reference Catuneanu, Willis and Miall1998); (3) autogenic processes such as slope avulsion (Pirmez & Flood, Reference Pirmez, Flood, Flood, Piper and Klaus1995); and (4) more proximal delta-lobe switching (Steel et al. Reference Steel, Crabaugh, Schellpeper, Mellere, Plink-Bjorklund, Deibert, Loeseth and Weimer2000).
The characteristics of the studied sediments generally are consistent with attributes of prograding slope models that emphasize sand delivery (e.g. Steel et al. Reference Steel, Crabaugh, Schellpeper, Mellere, Plink-Bjorklund, Deibert, Loeseth and Weimer2000; Mutti et al. Reference Mutti, Tinterri, Benevelli, Di Biase and Cavanna2003). Most of the sedimentary bodies are distinct, mud-encased features interpreted as recording mixed erosion and deposition. Sand delivery is punctuated by mass wasting of the slope, reflecting the high mud accumulation rate in high-gradient areas up-system. The lack of thick successions of deposits indicative of mud-rich overbank settings suggests that long-lived aggradational channel-levee systems did not develop. This suggestion is consistent with the notion that slope channels in this setting are relatively short-lived, probably filled soon after creation. High sedimentation rates combined with frequent lateral shifting of feeder systems results in numerous and short-lived slope channels and gullies (Moore & Fullman, Reference Moore, Fullman and Broussard1975). Additionally, slope readjustment processes result in the generation of mud-rich MTDs that can lead to coarse-grained sediment accumulation on the middle to the base of the slope (Galloway, Reference Galloway1998).
Studied outcrops preclude the ability to confirm the occurrence of a large-scale and long-lived feeder canyon but, based on the interpretation of the progradational/aggradational slope, it is inferred that long-lived feeder canyons were not probable. Depositional slopes, by definition, record greater accumulation than degradation over time. In the context of continental-margin evolution, Hedberg (Reference Hedberg1970) and Ross et al. (Reference Ross, Hallwell, May, Watts and Syvitski1994) discussed the distinction between (1) progradational, or graded, margins that advance basinward in equilibrium with external forcing and (2) erosional, or out-of-grade, slopes that become over-steepened, resulting in mass wasting and bypass of sediment to lower-gradient areas. At large stratigraphic scales (hundreds to thousands of metres thick), out-of-grade margins commonly evolve into graded margins as accommodation in lower to base-of-slope areas is filled (Ross et al. Reference Ross, Hallwell, May, Watts and Syvitski1994). At smaller scales (tens to hundreds of metres thick), the role of degradation v. accumulation with respect to slope construction is far more complex and thus not as well understood. The scale of stacking of MTD and turbiditic sandstone lithofacies on the studied slope system suggests an alternation of graded v. non-grade conditions at a higher temporal order and the mass wasting events are critical phases in the evolution and associated accretion of the slope.
Siliciclastic sediments in this part of the Hellenic FTB record the dynamics between tectonics and eustasy progradation and basinward accretion of the slope that influenced by both processes. Major sea-level fall across the NP23–NP24 boundary is reflected in the accumulation of large-scale MTDs, while the influence of tectonic activity is expressed by the base-level fall during NN3, in a time interval with no significant sea-level changes (Fig. 21). The major orogenic events that influenced the Hellenic FTB at the end of Burdigalian time (e.g. the inversion of the Ionian Basin succession) can be invoked to account for the palaeoflow direction shifting. Several other prograding slope systems documented from outcrop data exhibit patterns that suggest a dominance of graded conditions (i.e. a paucity of large-scale and numerous intervals of MTDs, e.g. the Eocene strata of Spitsbergen; Steel et al. Reference Steel, Crabaugh, Schellpeper, Mellere, Plink-Bjorklund, Deibert, Loeseth and Weimer2000). Conceptually, a graded slope system builds basinward because the slope profile is maintained at equilibrium (or near equilibrium) during depositional phases. The result is a relatively systematic stacking of facies, reflecting their position on the slope. In contrast, the significant phases recording out-of-grade conditions evident in the study area suggest a more topographically complex slope profile typical of larger-scale prograding margins (e.g. Moscardelli et al. Reference Moscardelli, Wood and Mann2006). Depositional slopes, particularly continental margin-scale examples, commonly have topographically complex profiles that can result in turbidite-system accumulation in various positions along the profile. The interpretation of slope progradation is based on sedimentological and architectural criteria, and reflects relative changes in gradient over significant stratigraphic thickness, as well as on the facies tract and depositional environment approach.
Comparison of Ereikousa and Othonoi Oligocene–Miocene sequences and the Haq et al. (Reference Haq, Hardenbol and Vail1987) inferred eustatic record.

A low degree of maturity for the studied sediments is evidenced by Tmax values. The average value is 427°C and the wider range of measured Tmax values (421–487°C) for all samples is attributed partly to analytical errors but mostly to variations in the composition of the OM depending on its type and on the extent of the alteration it suffered during early diagenesis. In any case, the average Tmax values below 430°C indicate that the OM did not experience high temperatures during burial and is uniformly immature with respect to oil generation. The average ~1% TOC is significantly greater than the average TOC of 0.2% measured for recent deep-sea sediments but is typically in the range determined for margin sediments (McIver, Reference McIver1975) and is evidently related to the high delivery of OM associated with the sedimentary systems on this part of the FTB setting of the Balkan Peninsula.
Organic geochemical analysis indicates an OM of type III kerogen. If we assume that the HI value for fresh marine OM is approximately 400 mgHC/g Corg and ~100 mgHC/g Corg for the terrigeneous end-member (Espitalié et al. Reference Espitalie, Deroo and Marquis1985a ), the studied area received terrigeneous inputs by the tectonic activity of the Ionian thrust and its relative submarine canyon system. The predominance of the terrigeneous source suggests short transportation from the source affecting the delivery of OM.
11. Conclusions
Slope series on the western flanks of the Hellenic FTB (Diapondia Islands), Ionian Sea, and NW Greece provide a typical example of progradation and basinward accretion of a continental margin-scale depositional slope system. Sandstone-rich units, in alternation with mudstone-rich intervals and MTDs, form two distinct sedimentary cycles. The degree of net bypass/erosion is assessed within the context of relative confinement of coarser-grained gravity flows. Basinal mudstone-rich units are indicative of hemipelagic sedimentation or sedimentation of very dilute, low-density sediment gravity flows, the overlying large-scale MTDs suggest relative sea-level lowering while the upper sand-rich unit exhibits increased evidence of channelization indicative of a slightly higher gradient position on the slope. This observation is interpreted as a record of the basinward accretion of the system.
The palaeoflow trend exhibits a W trending direction during the Late Oligocene whereas since the Early Miocene shifts towards the East, related to the major orogenic events, occurred at the end of Burdigalian time (e.g. the inversion of the Ionian Basin succession). Progradation and basinward accretion of the slope is attributed to both eustacy and tectonic activity. Sediments are Late Oligocene to Early–Middle Miocene (zones NP23–NN5) in age, established on the youngest index species of calcareous nannofossils found in the studied samples, allowing us to correct older ages based on reworked species. Slight reworking is indicated by the presence of a few Cretaceous, Paleocene and Eocene species.
Organic geochemical research on this part of the Hellenic FTB led to establishment of the regional Tertiary gaseous source rock potential and enabled the analysis of their characteristics in terms of the total content of OM, its type, quality and maturity level, together with the analysis of their generative potential. TOC content is the primary parameter for source rock appraisal, with a threshold of 1% at the immature stage for potential source rocks. With average TOC values close to this lower limit (0.96%) and occurrence of samples exceeding this threshold (and nearly up to 32.5%), the studied fine-grained slope series appear to be potential source rocks. Such TOC values indicate that sediment emplacement occurred under conditions favourable for OM preservation related to short distance transportation and deposition at rather low water depth. The second prerequisite for good petroleum source rock is the quality of the OM. Rock-Eval II parameters indicate that the studied organic-rich facies have gas-prone potential.
Even though the sedimentary overburden was not sufficient to reach the beginning of the oil window in this part of the basin, the down-slope deep-water mudstone facies associated with sandy reservoirs should be considered as potential source rocks in different parts of the basin, where they experience a higher thermal evolution and their organic geochemical parameters are amended because of no OM oxidization.
Acknowledgements
The work presented in this article reflects the research conducted by the Department of Geology, University of Patras, Greece and the Hydrocarbon Chemistry and Technology Research Unit, Technical University of Crete, Chania, Greece. The authors gratefully thank K. Stoykova (University of Sofia) for the determination of calcareous nannofossils. The authors acknowledge journal editor Andy Whitham (CASP, University of Cambridge, UK), V. Karakitsios (University of Athens) and the anonymous reviewer for their thoughtful reviews, which greatly improved the manuscript.