Coffee ranks among the most widely consumed beverages worldwide(Reference Poole, Kennedy and Roderick1), and its health implications have been a subject of extensive scientific investigation over the past decades. Accumulating epidemiological evidence suggests that habitual coffee consumption is associated with reduced risk of multiple chronic diseases(Reference Safe, Kothari and Hailemariam2–Reference Grosso, Godos and Galvano5). However, the vast majority of existing research has focused predominantly on the quantity of daily coffee intake, while coffee consumption timing patterns and their potential physiological implications remain largely unexplored. As a distinct and readily identifiable dietary behaviour, coffee consumption timing can be captured in 24-hour dietary recall data, making it a practical and population-relevant exposure for epidemiological investigation(Reference Ahluwalia, Dwyer and Terry6). Moreover, coffee contains numerous bioactive compounds beyond caffeine, including chlorogenic acids, polyphenols and other antioxidants, whose collective effects on metabolic health cannot be reduced to caffeine alone(Reference Nguyen, Taine and Meng7,Reference Tajik, Tajik and Mack8) . Therefore, coffee consumption timing represents a behaviourally and biochemically meaningful exposure distinct from caffeine intake or caffeine timing.
Metabolic syndrome (MetS), characterised by a constellation of interconnected metabolic abnormalities including central obesity, hypertension, dyslipidaemia and insulin resistance(9,Reference Fahed, Aoun and Bou Zerdan10) , represents a significant worldwide public health concern, with prevalence rates reaching approximately 25–30 % of adults worldwide(Reference Saklayen11). Individuals with MetS face substantially elevated risks of cardiovascular morbidity, type 2 diabetes and all-cause mortality(Reference Li, Liu and Li12). Given coffee’s established effects on glucose homeostasis and metabolic regulation(Reference Kim, Kim and Jung13), understanding its relationship with MetS is of particular clinical and public health relevance.
Timing-dependent effects of dietary intake on metabolic health have gained increasing attention in the field of chrono-nutrition, with evidence demonstrating that the timing of food and beverage consumption may significantly influence metabolic outcomes, independent of total intake(Reference Beccuti, Monagheddu and Evangelista14–Reference Potter, Cade and Grant18). Emerging evidence suggests that morning coffee intake is associated with lower all-cause and cardiovascular mortality compared with afternoon or evening consumption(Reference Wang, Ma and Sun19,Reference Yang, Lei and Liu20) . However, no study has specifically examined the association between coffee consumption timing patterns and MetS prevalence. Therefore, we conducted this study to examine this association in a nationally representative sample of USA adults and to explore potential effect modifications by demographic and lifestyle factors.
Methods
Study population
This study utilised data from the National Health and Nutrition Examination Survey (NHANES), a continuous surveillance programme conducted by the National Center for Health Statistics designed to evaluate the health and nutritional status of the USA population. The survey implements a complex, multistage probability sampling strategy featuring oversampling of certain demographic groups and weighted analysis to ensure national representativeness. The NHANES protocol was approved by the National Center for Health Statistics Research Ethics Review Board, and written informed consent was obtained from all participants. This secondary analysis used publicly available de-identified data from the NHANES database and was exempt from institutional review board approval. This study was conducted and reported in accordance with the STROBE-Nut checklist (online Supplementary Material 2).
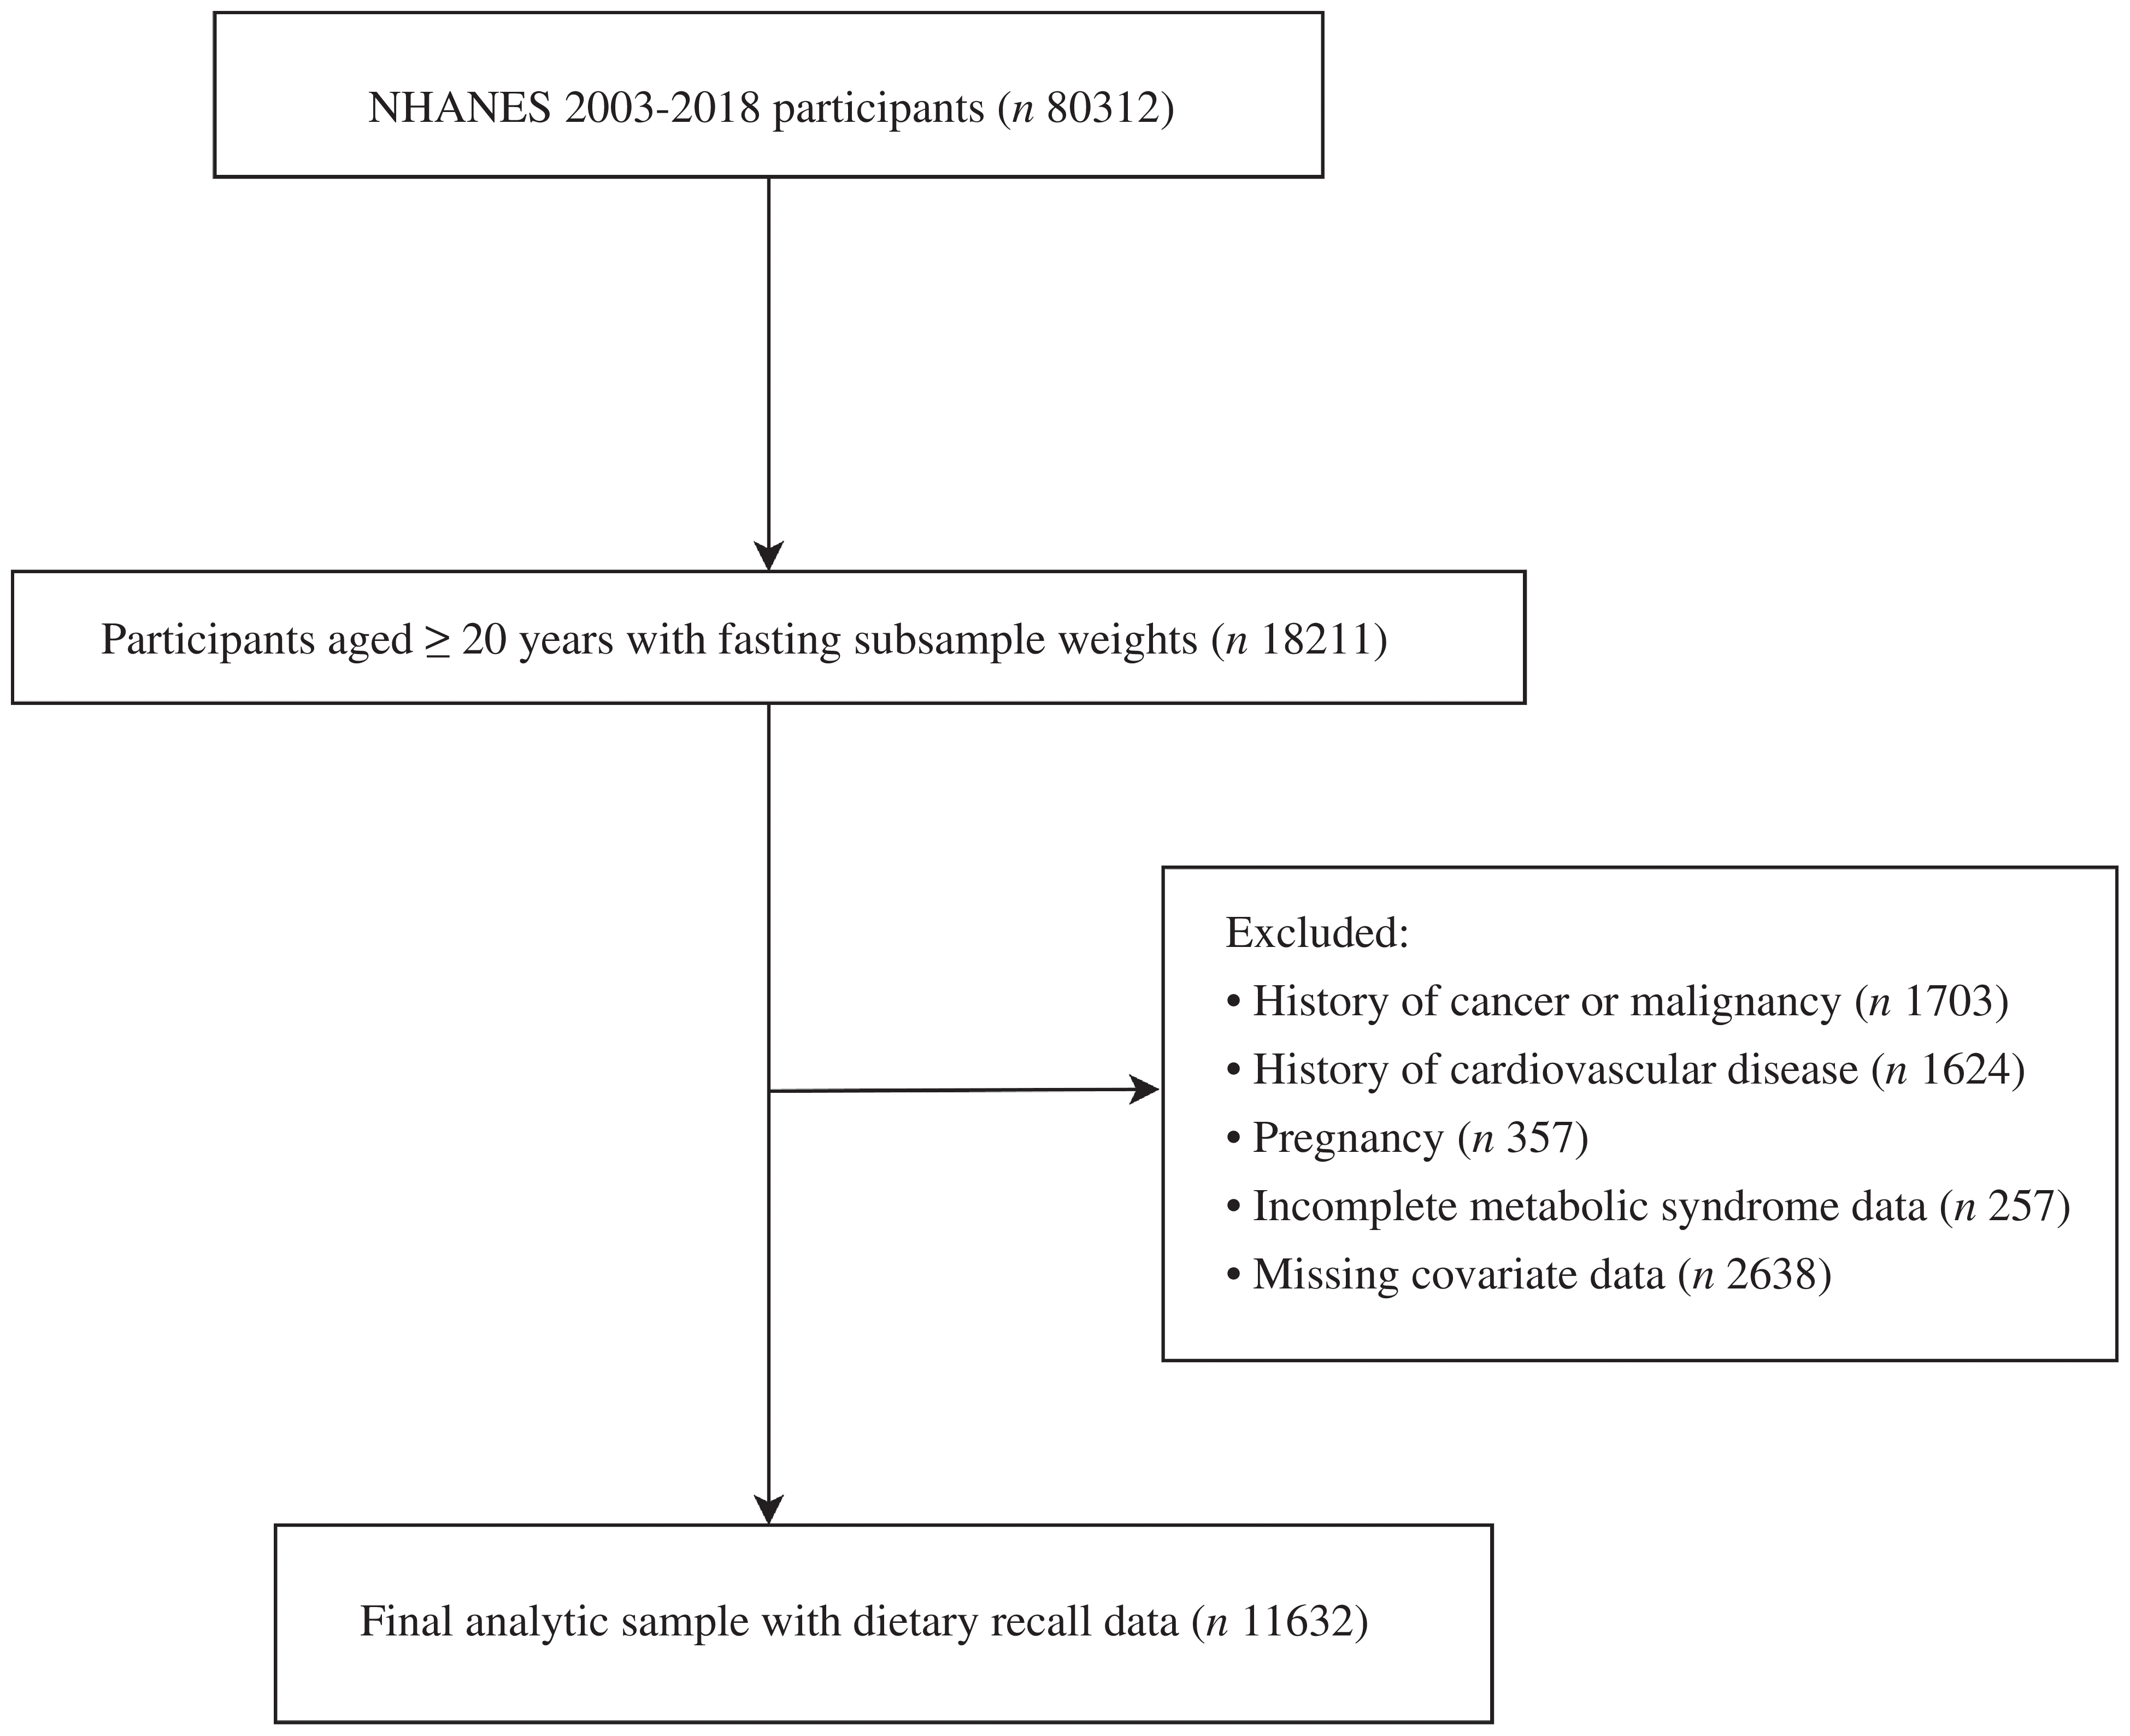
This study utilised data from eight consecutive NHANES cycles (2003–2018). This period was selected because the Food and Nutrient Database for Dietary Studies replaced the Survey Nutrient Database beginning in 2003, providing a standardised dietary assessment methodology maintained consistently across subsequent cycles. Participants aged ≥ 20 years with valid fasting subsample weights were eligible for inclusion. No specific dietary, physiologic or nutritional characteristics were used as primary selection criteria, as the study aimed to examine the cross-sectional association between coffee consumption patterns and MetS in a nationally representative general adult population. However, participants were required to have complete fasting laboratory data to enable accurate assessment of MetS components. We excluded participants who had a history of cancer or malignancy (n 1703), CVD (n 1624), pregnancy (n 357), could not be classified for MetS status due to missing data across multiple components (waist circumference, triglycerides, high-density lipoprotein cholesterol, blood pressure and fasting glucose), such that fewer than three of the five components were assessable (n 257), or had missing covariate data (n 2638). The final analytic sample comprised 11 632 participants (Figure 1).
Study flowchart. Boxes represent each stage of selection with solid black borders. The initial sample of 80 312 participants was restricted to adults aged ≥ 20 years with fasting subsample weights (n 18 211). Exclusions included cancer or malignancy history (n 1703), CVD (n 1624), pregnancy (n 357), incomplete metabolic syndrome data (n 257) and missing covariates (n 2638). The final analytic sample included 11 632 participants with complete dietary recall and covariate data.

Assessments of coffee consumption timing patterns
Participants’ coffee consumption patterns were systematically evaluated using 24-hour dietary recall data. NHANES employs a standardised two-day recall protocol: the first interview is conducted face-to-face at the Mobile Examination Center, while the second is administered via telephone 3–10 days later. In the primary analysis, only first-day dietary recall data were used (n 11 632). Of these, 10 374 (89·2 %) completed the second dietary recall. To evaluate the robustness of this approach, among coffee consumers with complete two-day recall data, temporal consumption patterns were re-derived using the average distribution across both days, and the resulting classifications were compared with those from the Day 1-only clustering. Participants whose pattern differed between the two approaches were excluded in this sensitivity analysis to evaluate whether the main findings were robust among individuals with stable timing classifications. The sensitivity analysis was thus conducted among non-drinkers (non-coffee drinkers) and coffee consumers with concordant classifications under both approaches (n 9842). Key variables that were extracted included food codes, consumption time, intake weights and food descriptions. Coffee beverages were identified through food description fields, with non-beverage coffee-containing items (e.g. coffee-flavoured desserts) excluded to focus specifically on beverage consumption patterns. Both caffeinated and decaffeinated coffee beverages were included in the exposure definition. The exposure was defined as the temporal pattern of coffee beverage consumption, irrespective of caffeine content, reflecting coffee drinking as a dietary behaviour rather than a proxy for caffeine intake.
To identify coffee consumption timing patterns, we employed cluster analysis based on established literature. Coffee consumption was categorised into three time periods(Reference Wang, Ma and Sun19): morning (04.00–11.59), afternoon (12.00–16.59) and evening (17.00–03.59). The proportion of consumption in each period was calculated and standardised using z-score transformation. K-means clustering (k = 2, nstart = 25) was then performed to classify participants into two consumption patterns based on their temporal distribution of coffee intake. The resulting clusters were characterised as morning-concentrated pattern and evenly distributed pattern.
Definition of metabolic syndrome
MetS was defined according to the National Cholesterol Education Program-Adult Treatment Panel III criteria (2001)(9). Participants were classified as having MetS if three or more of the following components were present: (1) waist circumference ≥ 102 cm in men or ≥ 88 cm in women; (2) triglycerides ≥ 150 mg/dl; (3) high-density lipoprotein cholesterol < 40 mg/dl in men or < 50 mg/dl in women; (4) systolic blood pressure ≥ 130 mmHg and/or diastolic blood pressure ≥ 85 mmHg, or use of antihypertensive medication; and (5) fasting plasma glucose ≥ 110 mg/dl, self-reported diabetes diagnosis, or use of glucose-lowering medication.
All biochemical measurements were obtained from blood samples collected after a minimum 8-hour fast and were analysed at NHANES-designated laboratories. Blood pressure was measured at the Mobile Examination Center by certified physicians, and the final value was calculated as the arithmetic mean of all nonzero readings (up to four measurements). Waist circumference was measured at the Mobile Examination Center by trained personnel following a standardised protocol. All procedures adhered to NHANES standardised operating procedures.
Assessment of covariates
Covariates included age, sex, race/ethnicity, education level, marital status, poverty income ratio, smoking status, alcohol drinking, recreational activities, BMI and dietary factors. Education level was classified as < high school and ≥ high school. Marital status was classified as married/living with partner or other. The poverty income ratio, defined as the ratio of household income to the federal poverty threshold, was classified as ≤ 1·0 or > 1·0. BMI was calculated as weight in kilograms divided by height in metres squared and categorised as < 25·0 kg/m2 (normal/underweight), 25·0–29·9 kg/m² (overweight) and ≥ 30·0 kg/m² (obese). Smoking status was classified as non-smokers, former smokers and current smokers. Alcohol drinking was defined as consumption more than once per month in the 2017–2018 cycle or ≥ 12 drinks in the past year in previous cycles, based on cycle-specific questionnaire items. Recreational activities were grouped into three levels (no activity, moderate-only or vigorous) based on self-reported weekly exercise or fitness activities. Dietary intake data, including energy (kcal/d), total sugar (g/d), sodium (mg/d), dietary fibre (g/d), saturated fat (g/d) and total coffee intake (g/d), were obtained from the first 24-hour dietary recall interview. Tea consumption status (yes/no) was determined based on any reported tea intake during the 24-hour dietary recall.
Statistical analysis
Baseline characteristics were compared between coffee consumption timing pattern groups. Continuous variables were summarised as weighted median (weighted interquartile range) due to skewed distributions. Between-group differences were evaluated using survey-weighted Wald F-tests on weighted means, which are robust to moderate departures from normality given the large sample size and account for the complex survey design. Categorical variables were presented as unweighted frequencies (weighted percentages), with group differences assessed using Rao-Scott adjusted chi-square tests.
Weighted multivariable logistic regression models were employed to examine the cross-sectional associations between coffee consumption timing patterns and MetS, with non-drinkers serving as the reference group. Associations were quantified using OR and 95 % CI. Three models were constructed: Model 1 adjusted for age, sex, race/ethnicity, education level, marital status, poverty income ratio, smoking status, alcohol drinking, recreational activities and BMI; Model 2 additionally adjusted for total coffee intake to assess associations with timing patterns independent of total coffee intake; and Model 3 further adjusted for dietary factors and tea consumer status.
Interactions between coffee intake (g/d) and timing patterns were tested using multiplicative terms in weighted multivariable logistic regression. A composite exposure variable was then created by cross-classifying timing patterns with daily intake levels (0–1, 1–2, 2–3, and ≥ 3 cups/d; 1 cup = 8 fluid ounces = 237 g(Reference Gebhardt and Thomas21)), generating eight coffee-drinking categories, with non-drinkers serving as the reference group. Sensitivity analyses were conducted using dose cut-points based on weighted median values.
Stratified analyses were performed to assess potential effect modification by sex, age (≤ 40, 40–59, ≥ 60 years), BMI categories (normal weight/underweight, overweight, obesity), smoking status (current v. never/former), alcohol drinking (yes v. no) and recreational activities (none, moderate-only, vigorous). Interaction terms were included to test for statistical significance of effect modification. To evaluate effect modification, we calculated adjusted predicted prevalence of MetS for each combination of coffee consumption pattern and stratification variable (BMI or age category) using marginal standardisation.
Six sensitivity analyses were conducted to assess robustness. First, all primary analyses were repeated in a restricted subsample with available two-day dietary recall data (as described above). Second, analyses were additionally adjusted for the intake of other caffeinated beverages (including tea, soft drinks, energy drinks and other caffeinated beverages). Third, analyses were restricted to caffeinated coffee consumers by excluding participants who reported any decaffeinated coffee consumption. Fourth, we excluded participants with extreme coffee consumption (> 95th percentile). Fifth, we applied multiple imputation by chained equations for covariates with > 5 % missing data, generating 10 imputed datasets with results pooled using Rubin’s rules. Sixth, in a subsample with available sleep data (2005–2018 cycles), we additionally adjusted for sleep duration and sleep disorder status.
All statistical analyses were conducted using R version 4.2.3 (R Foundation for Statistical Computing, Vienna, Austria). The complex survey design of NHANES was accounted for by incorporating sampling weights, strata and primary sampling units using the survey package. All statistical tests were two-sided, with statistical significance defined as P < 0·05.
Results
Identification of coffee consumption timing patterns
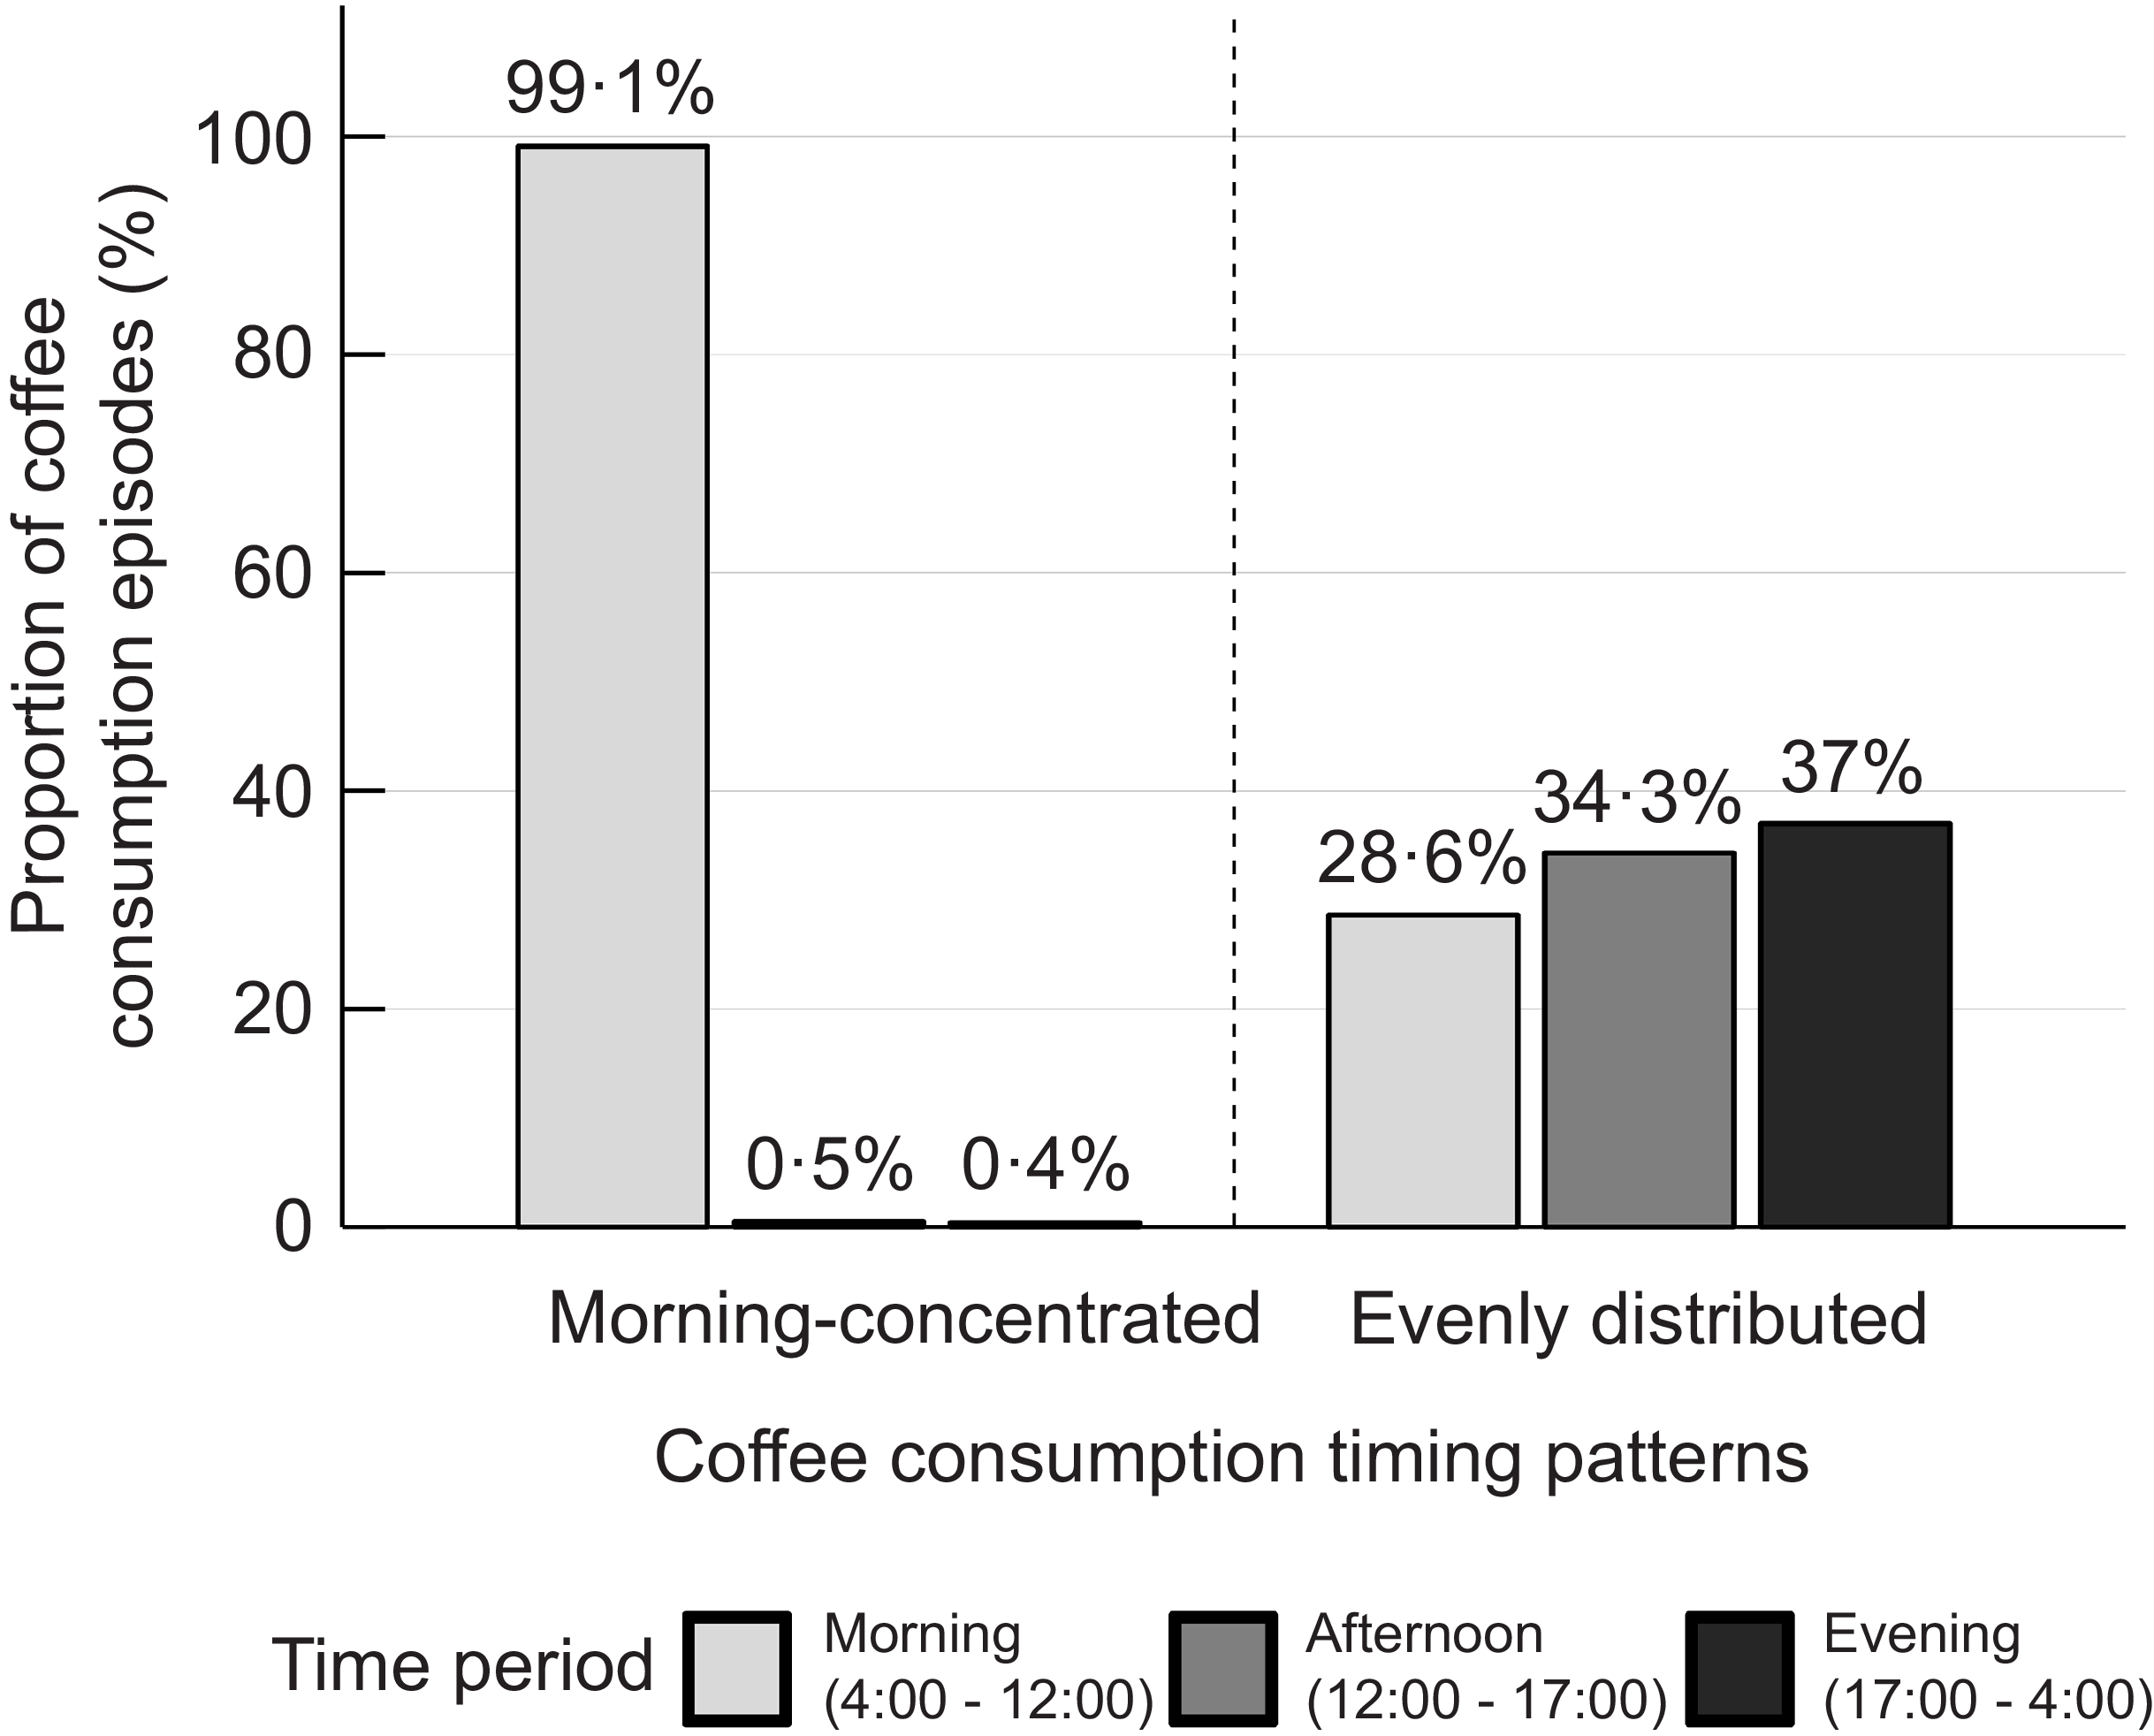
K-means clustering analysis revealed two distinct consumption timing patterns (Figure 2). The majority of coffee consumers (n 4320) exhibited a morning-concentrated pattern, characterised by highly concentrated intake during morning hours (99·1 % of daily consumption), with minimal afternoon (0·5 %) and evening (0·4 %) consumption. The remaining consumers (n 1326) demonstrated an evenly distributed pattern, with more balanced consumption across morning (28·6 %), afternoon (34·3 %) and evening (37·0 %) periods.
Coffee consumption timing patterns identified through cluster analysis among coffee drinkers. Bars represent the proportion (%) of coffee consumption episodes during morning (04.00–12.00, light grey bars), afternoon (12.00–17.00, medium grey bars) and evening (17.00–04.00, dark grey bars) for two distinct patterns. The dashed vertical line separates the two consumption patterns. K-means clustering (k = 2, nstart = 25) was performed on standardised time-of-day consumption proportions.

Baseline characteristics
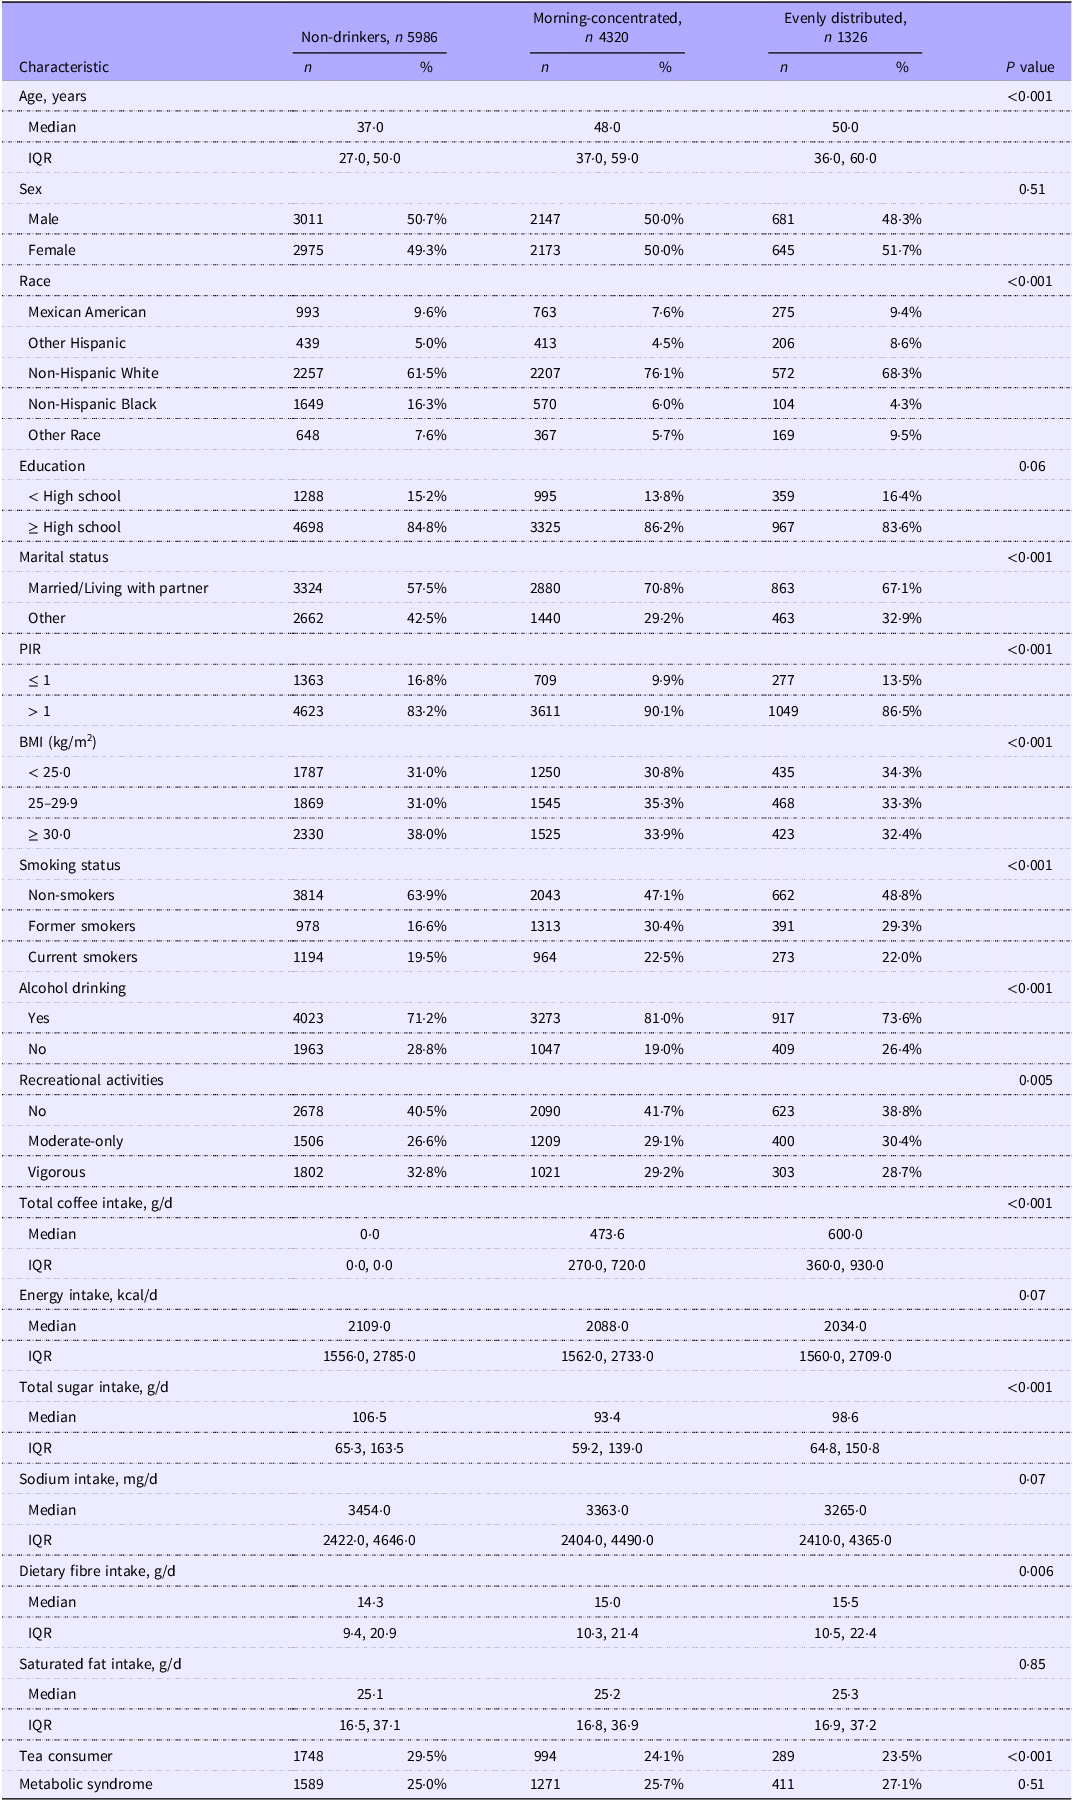
The baseline characteristics of participants stratified by coffee consumption timing patterns are presented in Table 1. The study population comprised 50·1 % males and 49·9 % females, with a weighted median age of 43 years. The weighted prevalence of MetS was 25·5 % in the overall sample. Compared with non-drinkers, both morning-concentrated and evenly distributed drinkers were significantly older (P < 0·001). Coffee drinkers were more likely to be non-Hispanic White, married or living with a partner and had higher family income levels compared with non-drinkers (all P < 0·001). With respect to lifestyle behaviours, coffee drinkers had a higher prevalence of former and current smoking and alcohol drinking, but a lower prevalence of obesity and tea consumption compared with non-drinkers (all P < 0·001). Among coffee drinkers, those with the morning-concentrated pattern had lower total coffee consumption and total sugar intake than those with the evenly distributed pattern. Additional baseline characteristics are detailed in Table 1. Baseline characteristics across nine subgroups defined jointly by both coffee consumption timing and daily intake amount are presented in online Supplementary Material 1, Table S1.
Baseline characteristics of study participants according to coffee consumption timing patterns

Table 1. Long description
The table presents baseline characteristics of participants stratified by coffee consumption timing patterns. It includes data for non-drinkers, morning-concentrated drinkers, and evenly distributed drinkers. The table has 25 rows and 7 columns. Column headers are Characteristic, Non-drinkers, Morning-concentrated, Evenly distributed, and P value. Row labels include Age, Sex, Race, Education, Marital status, PIR, BMI, Smoking status, Alcohol drinking, Recreational activities, Total coffee intake, Energy intake, Total sugar intake, Sodium intake, Dietary fibre intake, Saturated fat intake, Tea consumer, and Metabolic syndrome. Each row provides specific data points for each category. Notable trends include differences in age, race, education, marital status, PIR, BMI, smoking status, alcohol drinking, recreational activities, total coffee intake, energy intake, total sugar intake, sodium intake, dietary fibre intake, saturated fat intake, tea consumption, and metabolic syndrome among the different groups.
IQR, interquartile range; PIR, poverty income ratio. Continuous variables are presented as weighted median and weighted interquartile range; categorical variables are presented as unweighted count and weighted percentage. All estimates account for complex survey design and sampling weights.
Association between coffee consumption timing patterns and metabolic syndrome
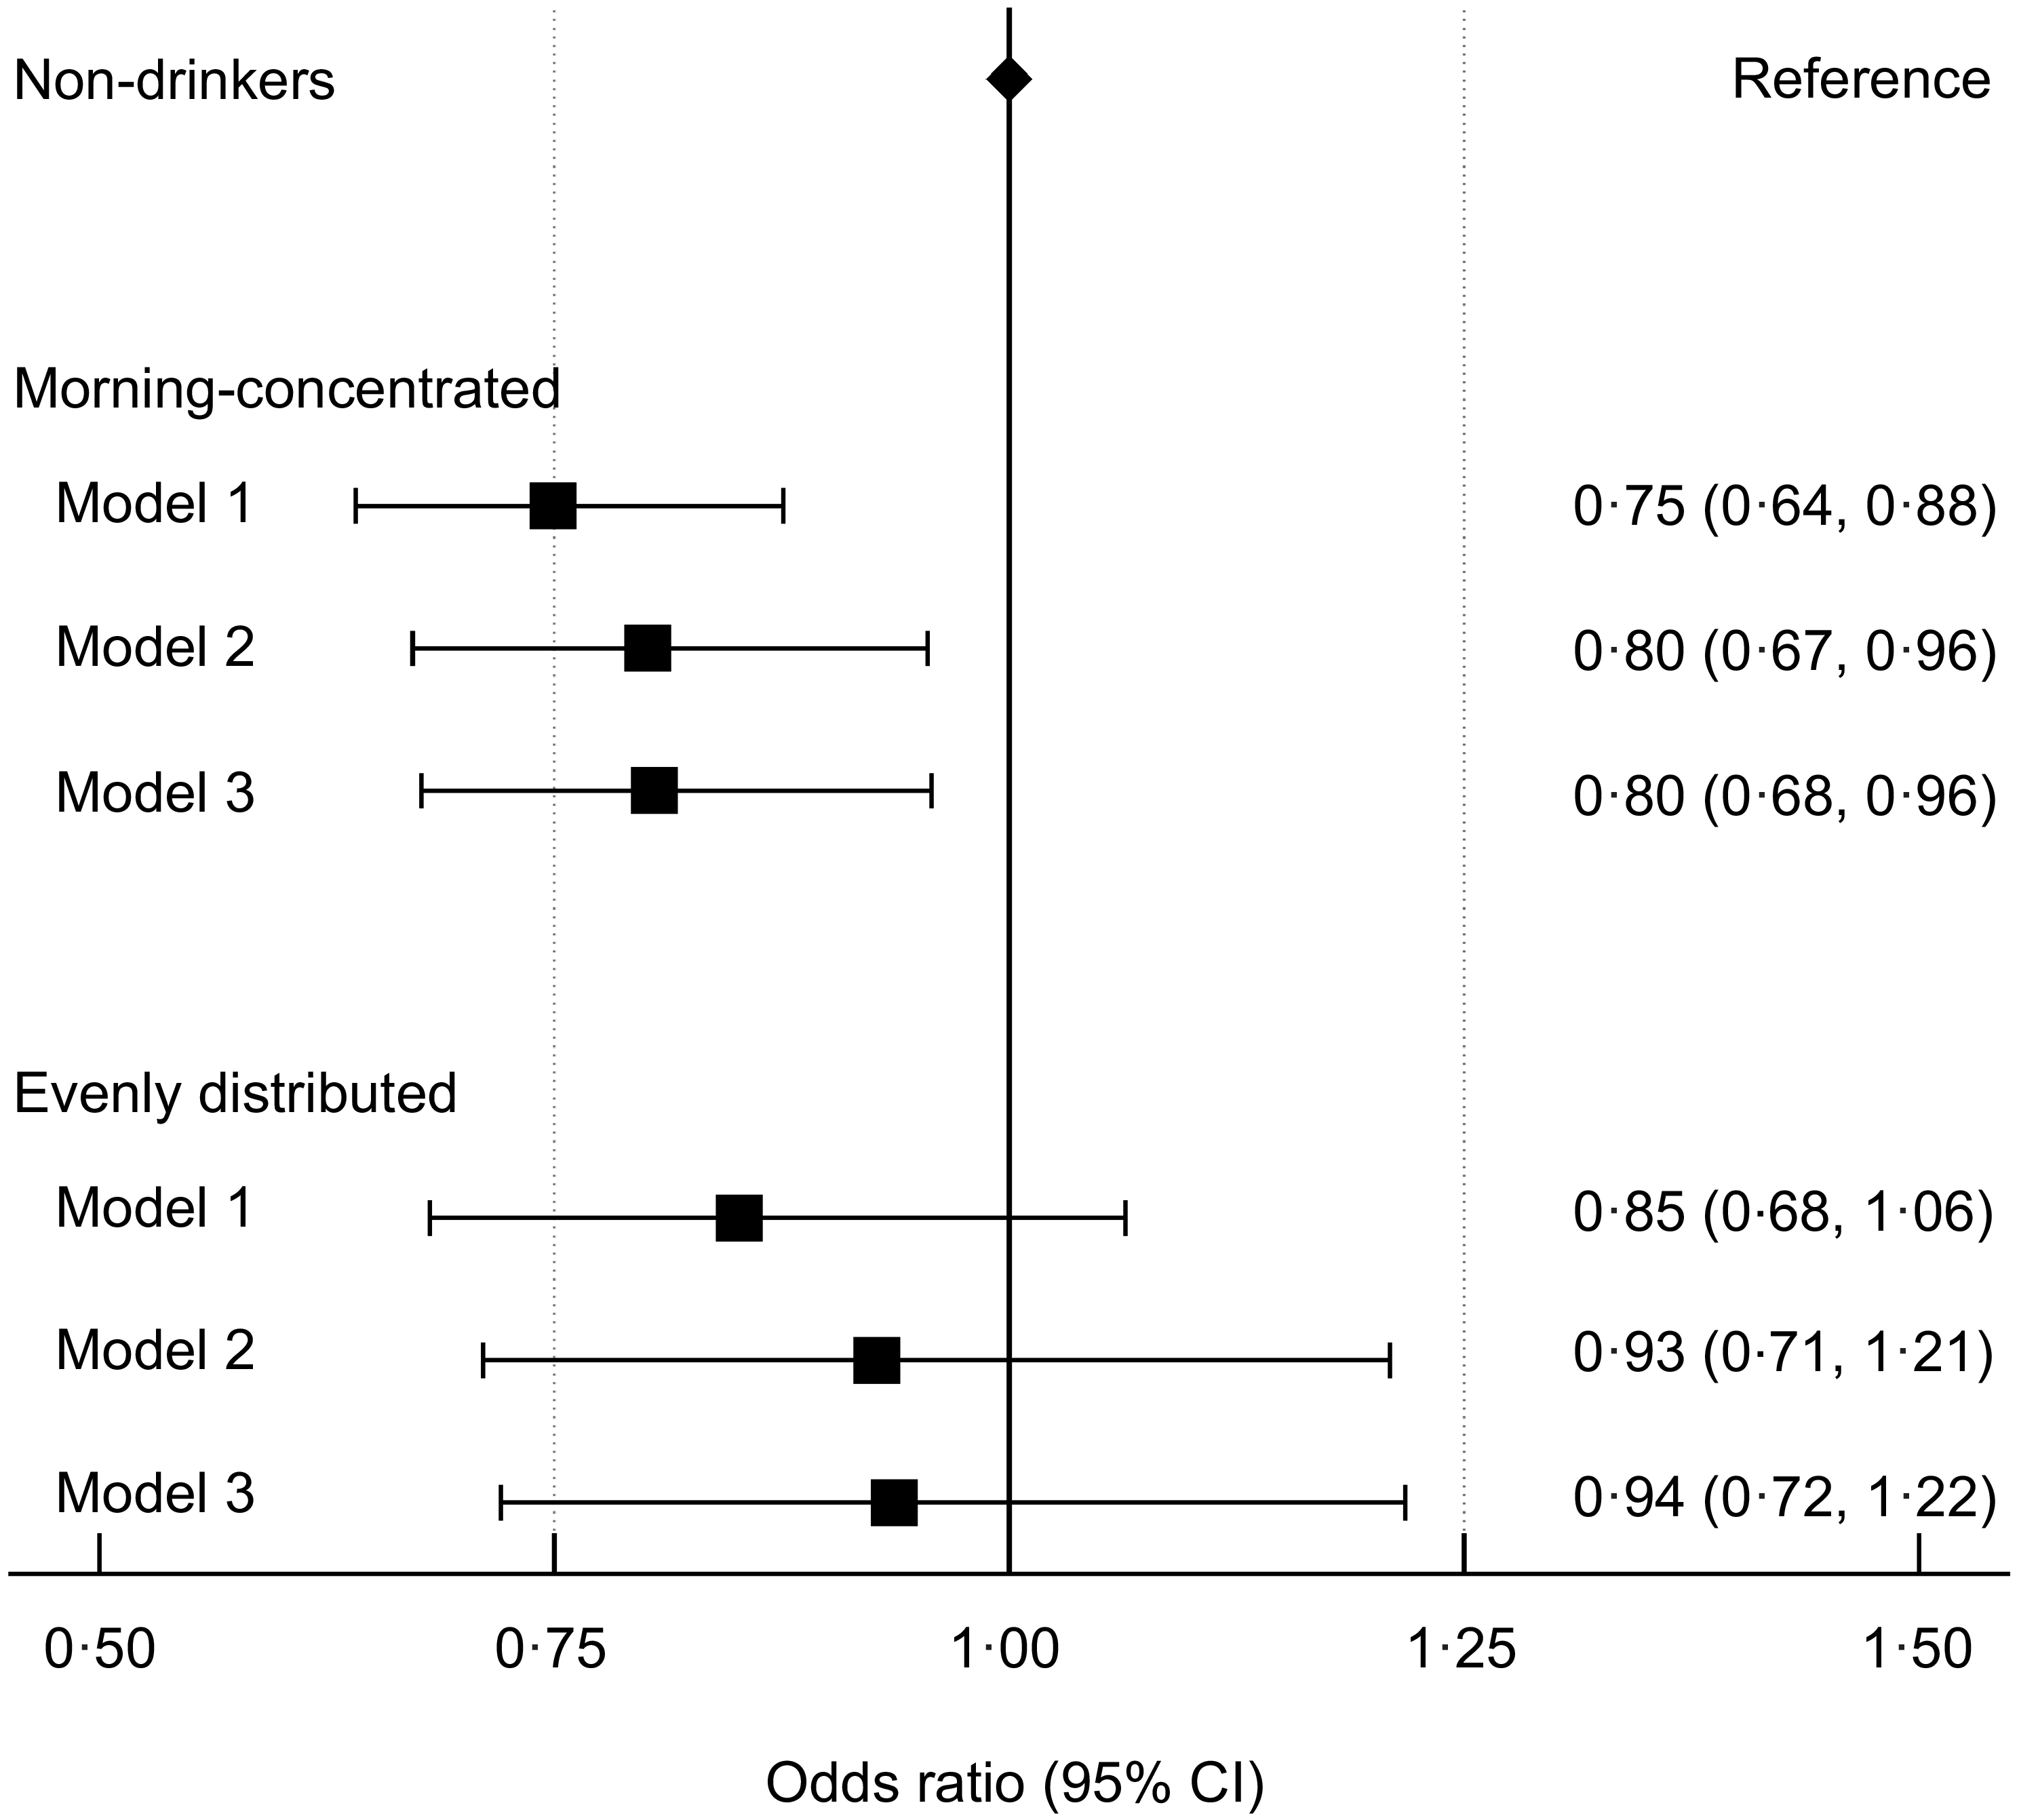
Figure 3 presents the associations between coffee consumption timing patterns and MetS prevalence across three progressively adjusted models. For the morning-concentrated pattern, an inverse association with MetS prevalence was observed across all models. In Model 1, this pattern was significantly associated with lower MetS prevalence (OR: 0·75, 95 % CI: 0·64, 0·88). This association persisted after additional adjustment for total coffee intake in Model 2 (OR: 0·80, 95 % CI: 0·67, 0·96) and dietary factors in Model 3 (OR: 0·80, 95 % CI: 0·68, 0·96), although residual confounding from unmeasured behavioural factors cannot be excluded. In contrast, the evenly distributed pattern showed no statistically significant association with MetS prevalence in any of the three models.
Association between coffee consumption timing patterns and metabolic syndrome (MetS). Data are presented as OR and 95 % CI from survey-weighted logistic regression (n 11 632), represented by squares and horizontal lines, respectively. Non-drinkers served as the reference group (OR = 1·0). Model 1 was adjusted for age, sex, race/ethnicity, education level, marital status, poverty income ratio (PIR), smoking status, alcohol drinking, recreational activities and BMI. Model 2 was additionally adjusted for total coffee intake. Model 3 was further adjusted for total daily energy intake, total sugars, sodium, dietary fibre, SFA and tea consumer status.

Combined associations of coffee consumption timing patterns and intake amount with metabolic syndrome
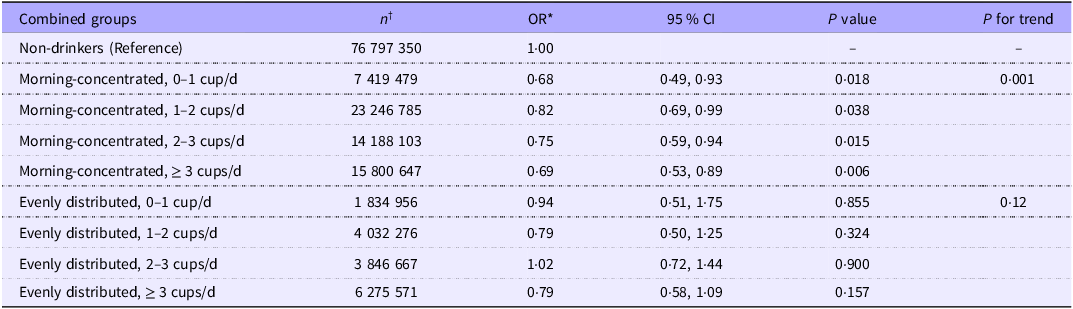
In the interaction analysis, no significant interaction was observed between coffee intake amount and timing pattern (P for interaction = 0·503). We further integrated coffee intake amount and timing pattern as a combined exposure variable (Table 2). Compared with non-drinkers, all morning-concentrated intake subgroups were associated with lower MetS prevalence (0–1 cup/d: OR: 0·68, 95 % CI: 0·49, 0·93; 1–2 cups/d: OR: 0·82, 95 % CI: 0·69, 0·99; 2–3 cups/d: OR: 0·75, 95 % CI: 0·59, 0·94; ≥ 3 cups/d: OR: 0·69, 95 % CI: 0·53, 0·89). Although the trend test was statistically significant (P for trend = 0·001), the OR did not show a clear monotonic pattern across intake levels. In contrast, the evenly distributed pattern showed no statistically significant associations with MetS prevalence at any intake level, and the trend test was not statistically significant (P for trend = 0·12). Sensitivity analyses using weighted median values as alternative cut-points supported the robustness of these findings (online Supplementary Material 1, Table S2).
Combined analysis of coffee consumption timing patterns and amount with metabolic syndrome

Table 2. Long description
The table presents a combined analysis of coffee consumption timing patterns and amounts with metabolic syndrome. It includes data for non-drinkers and various subgroups based on morning-concentrated and evenly distributed coffee intake. The table has 12 rows and 6 columns. Column headers are Combined groups, n†, OR*, 95% CI, P value, and P for trend. Row labels include Non-drinkers (Reference), Morning-concentrated with different cup amounts per day, and Evenly distributed with different cup amounts per day. Each row lists the number of participants (n†), odds ratio (OR*), 95% confidence interval (CI), P value, and P for trend. Morning-concentrated intake subgroups show lower metabolic syndrome prevalence compared to non-drinkers, with statistically significant P values for trend. Evenly distributed intake shows no significant associations with metabolic syndrome prevalence.
PIR, poverty income ratio *All models were adjusted for age, sex, race/ethnicity, education level, marital status, PIR, smoking status, alcohol drinking, recreational activities, BMI, total coffee intake, total daily energy intake, total sugars, sodium, dietary fibre, SFA and tea consumer status. † n represents weighted sample size.
Stratified analysis
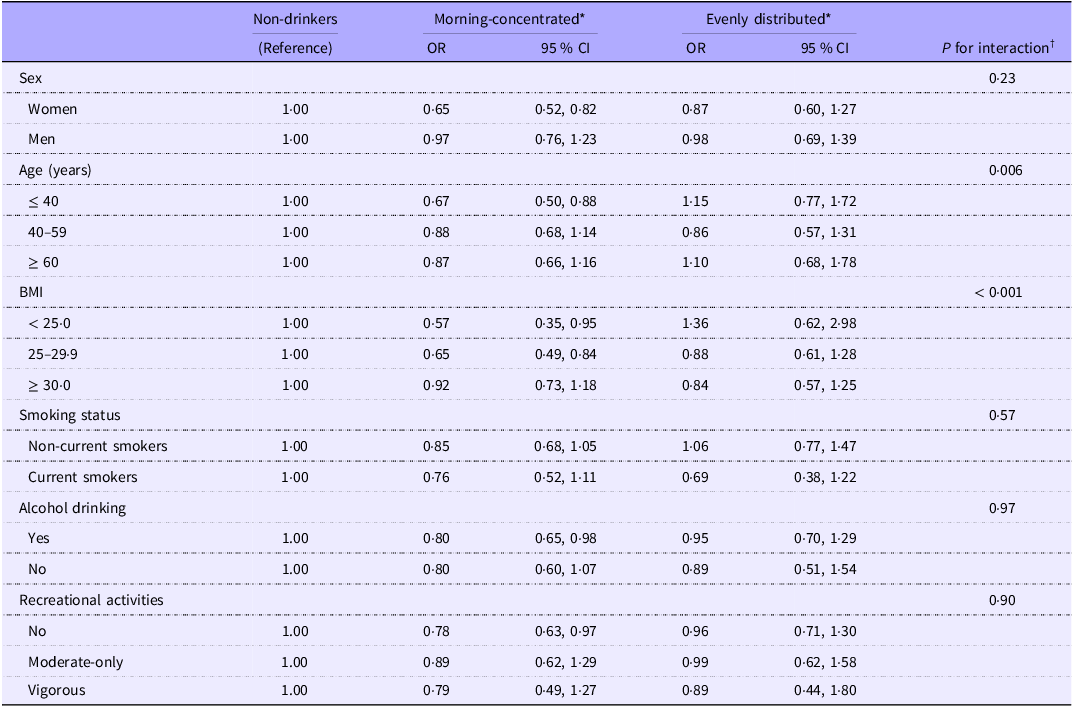
Table 3 presents the results of interaction tests and stratified analyses. Interaction tests revealed significant interactions between coffee consumption timing patterns and age (P = 0·006) and BMI categories (P < 0·001). In stratified analyses, the morning-concentrated pattern was significantly associated with lower MetS prevalence among participants aged ≤ 40 years (OR: 0·67, 95 % CI: 0·50, 0·88), but not in older age groups. By BMI categories, significant associations were observed in individuals with normal weight/underweight (OR: 0·57, 95 % CI: 0·35, 0·95) and individuals with overweight (OR: 0·65, 95 % CI: 0·49, 0·84), but not in individuals with obesity. The evenly distributed pattern showed no significant associations with MetS prevalence in any subgroup.
Stratified analyses of the association between coffee consumption timing patterns and metabolic syndrome

Table 3. Long description
The table presents stratified analyses of the association between coffee consumption timing patterns and metabolic syndrome. It includes data for non-drinkers, morning-concentrated, and evenly distributed patterns across various subgroups. The table has 13 rows and 8 columns. Column headers are Non-drinkers, Morning-concentrated OR, Morning-concentrated 95 percent CI, Evenly distributed OR, Evenly distributed 95 percent CI, and P for interaction. Row labels include Sex, Age, BMI, Smoking status, Alcohol drinking, and Recreational activities. Each row provides odds ratios and confidence intervals for the different patterns. Notable trends include significant interactions between coffee consumption timing patterns and age, and BMI categories.
PIR, poverty income ratio *All models were adjusted for age, sex, race/ethnicity, education level, PIR, marital status, smoking status, alcohol drinking, recreational activities, BMI, total coffee intake, total daily energy intake, total sugars, sodium, dietary fibre, SFA and tea consumer status (except when the variable itself was used as the stratification variable). † P for interaction calculated using Wald test from survey-weighted logistic regression models.
Sensitivity analysis
Six sensitivity analyses supported the robustness of our findings (online Supplementary Material 1, Table S3). The morning-concentrated pattern consistently showed a significant inverse association with MetS across all six scenarios, including restriction to participants with complete two-day dietary recall data, additional adjustment for intake of other caffeinated beverages, restriction to caffeinated coffee consumers, exclusion of participants with coffee intake above the 95th percentile, multiple imputation for missing covariates and additional adjustment for sleep duration and sleep disorder status. The evenly distributed pattern showed a significant association only in the multiple imputation analysis (OR: 0·81, 95 % CI: 0·66, 0·99).
Discussion
This cross-sectional study identified a novel association between coffee consumption timing patterns and MetS prevalence in a nationally representative USA adult population. Among 11 632 study participants, cluster analysis identified two distinct temporal consumption patterns among coffee drinkers: the majority exhibited a morning-concentrated pattern, while the remainder demonstrated an evenly distributed pattern. After adjusting for potential confounders, the morning-concentrated pattern was associated with lower MetS prevalence (OR: 0·80, 95 % CI: 0·68, 0·96), whereas the evenly distributed pattern showed no significant association compared with non-drinkers. These findings remained consistent when jointly considering consumption patterns and daily intake amounts. Notably, BMI and age were identified as significant effect modifiers of this association.
In contrast to previous studies that focused exclusively on total daily coffee consumption quantity, our findings demonstrate a novel temporal dimension in the coffee-MetS relationship. For instance, a cohort study showed lower MetS incidence among Taiwanese military personnel with greater daily coffee intake(Reference Tsai, Huang and Sui22). Similarly, NHANES 2003–2018 data revealed inverse associations between total coffee amount and MetS severity(Reference Zhao, Wang and Han23). However, conflicting findings have been reported regarding the associations between coffee consumption and MetS or its individual components(Reference Kim, Cho and Jacobs24–Reference Wong, Wong and Zhang26). Our study extends this traditional quantity-focused paradigm by suggesting that coffee consumption timing patterns may be associated with MetS, although the potential influence of unmeasured lifestyle factors cannot be excluded. Specifically, we found that the morning-concentrated pattern was associated with lower MetS prevalence compared with the evenly distributed pattern, even when total daily intake was comparable. These findings suggest that, beyond total intake, the timing of coffee consumption or related lifestyle patterns may be an overlooked dimension in coffee-MetS research. This notion is supported by emerging evidence suggesting that coffee-drinking timing is independently associated with all-cause and cardiovascular mortality in USA adults(Reference Wang, Ma and Sun19), further underscoring the importance of considering temporal patterns in dietary research.
Several mechanisms may explain these findings, although they should be interpreted cautiously because of the observational design. First, morning-concentrated coffee consumption may reflect more structured lifestyle behaviours, including regular breakfast intake, earlier sleep-wake timing and consistent daily routines, which are themselves associated with better metabolic health(Reference Odegaard, Jacobs and Steffen27,Reference Reutrakul, Hood and Crowley28) . Therefore, morning coffee timing may function as a behavioural marker rather than an independent causal factor, and future studies should incorporate measures of lifestyle regularity to disentangle these pathways. Second, bioactive compounds in coffee, such as chlorogenic acids and polyphenols, may influence glucose metabolism, oxidative stress and inflammation, potentially with timing-dependent effects(Reference Nguyen, Taine and Meng7,Reference Tajik, Tajik and Mack8,Reference Poggiogalle, Jamshed and Peterson29) . Third, coffee consumed later in the day may disrupt circadian rhythms and sleep, both of which are closely linked to metabolic regulation(Reference Burke, Markwald and McHill30–Reference Ruan, Yuan and Eltzschig33).
Our findings revealed significant effect modification by age and BMI in the relationship between the morning-concentrated pattern and MetS prevalence. The inverse association was most pronounced among individuals aged ≤ 40 years, individuals with normal weight/underweight and individuals with overweight, but attenuated in older adults and individuals with obesity. These findings suggest that the associations between coffee consumption timing and MetS may vary by age and BMI, and these heterogeneous patterns warrant further investigation in prospective studies. Similarly, Kim and Je demonstrated that obesity status modified the coffee-MetS association. In individuals without obesity, higher coffee intake showed a significant inverse linear association with MetS. However, in individuals with obesity, while moderate consumption reduced MetS odds, heavy consumption showed a non-significant positive association(Reference Kim and Je34). Despite evidence that coffee consumption can ameliorate obesity-related metabolic dysfunction through anti-inflammatory, hepatoprotective and insulin-sensitising mechanisms(Reference Yamauchi, Kobayashi and Matsuda35), the attenuated association in individuals with obesity in our study suggests that coffee consumption timing pattern may be associated with the magnitude of the observed associations, warranting further investigation in prospective studies. Consistent with our findings, previous studies have shown that the inverse association between coffee consumption and MetS was primarily significant in younger or middle-aged individuals(Reference Tsai, Huang and Sui22,Reference Corbi-Cobo-Losey, Martinez-Gonzalez and Gribble36) , with limited evidence from older adults or those with established obesity(Reference Wong, Burlutsky and Gopinath37). Differences from studies reporting stronger inverse associations in older adults may reflect variations in stratification methods, participant characteristics, outcomes and coffee exposure definitions(Reference Tuomilehto, Hu and Bidel38).
Our findings provide preliminary observational evidence that coffee consumption timing patterns may be associated with MetS prevalence, suggesting that temporal dimensions of dietary behaviour merit further investigation. The variation in associations across BMI and age categories further underscores the potential heterogeneity of these relationships, which should be explored in prospective or experimental studies before any dietary guidance can be considered.
Our study has several limitations. First, as a cross-sectional study, our design limits the ability to establish causal relationships regarding how coffee consumption timing patterns affect MetS risk. Reverse causation is also plausible, as individuals with metabolic conditions may modify their coffee consumption timing or beverage choices in response to their health status. Second, data on coffee consumption timing patterns were based on self-report, which may introduce recall bias. Although sensitivity analyses incorporating both recall days yielded consistent results, reliance on a single 24-hour recall in the primary analysis may not fully capture habitual coffee timing patterns and may introduce random misclassification. In addition, excluding participants with inconsistent timing classifications between recall days in the sensitivity analysis may have introduced selection bias and may limit generalisability to individuals with stable coffee-drinking routines. Third, although we adjusted for multiple covariates and conducted sensitivity analyses with further adjustment for additional potential confounders, residual confounding remains possible. In particular, morning-concentrated coffee consumption may partly reflect broader lifestyle regularity, including breakfast habits, work schedules, chronotype, medication use and other health-related behaviours. Fourth, the primary exposure definition included both caffeinated and decaffeinated coffee and did not distinguish caffeine derived from coffee from that obtained through other dietary sources, which may introduce heterogeneity and residual confounding into the exposure construct. Sensitivity analyses restricting the exposure to caffeinated coffee consumers only, and additionally adjusting for non-coffee caffeine intake, both yielded consistent results, suggesting that the findings are unlikely to be substantially driven by decaffeinated coffee or confounded by caffeine from other dietary sources. Finally, the specific characteristics of our study population may limit the extent to which our findings can be generalised to other populations. Therefore, prospective and experimental studies are warranted to confirm these associations.
Our study has several strengths. First, we used a large-scale, multistage dataset, which not only provided sufficient statistical power to detect subtle associations but also enabled comprehensive subgroup analyses. Second, we adopted standardised and homogeneous protocols for laboratory tests and anthropometric data collection, ensuring high quality and reliability of the data. Third, sensitivity analyses using multiple analytical methods enhanced the reliability and consistency of our findings. Finally, detailed information about coffee consumption timing is a unique strength of this study, enabling us to investigate temporal patterns that have received less attention in previous studies.
Conclusions
Our study suggests that coffee consumption timing patterns may be associated with MetS prevalence. Specifically, a morning-concentrated pattern was associated with lower MetS prevalence compared with non-drinkers, independent of total intake. Future prospective or experimental studies are needed to confirm these associations and clarify potential mechanisms, including heterogeneity by BMI and age.
Supplementary material
For supplementary material/s referred to in this article, please visit https://doi.org/10.1017/S0007114526107971
Acknowledgements
The authors acknowledge the NCHS for providing access to the NHANES database. We thank all NHANES participants and staff for their contributions. The interpretation of these data is the sole responsibility of the authors.
This research received no external funding.
M. S.: Conceptualisation-Equal, Formal analysis-Lead, Methodology-Equal, Validation-Equal, Writing – original draft-Lead, Writing – review & editing-Equal; C. W.: Methodology-Equal, Validation-Equal, Writing – review & editing-Equal; L. T.: Conceptualisation-Equal, Supervision-Equal, Validation-Equal, Writing – review & editing-Equal; S. Z.: Conceptualisation-Equal, Supervision-Equal, Validation-Equal, Writing – review & editing-Equal. All authors read and approved the final manuscript.
The authors have no conflicts of interest to declare.
The dataset supporting the conclusions of this article is available in the National Health and Nutrition Examination Survey repository, https://www.cdc.gov/nchs/nhanes/.