Resolve is one of the most central concepts in the study of international politics, used to explain why actors win on the battlefield and prevail at the bargaining table (Jervis Reference Jervis1976; Schelling Reference Schelling1960; Sechser and Fuhrmann Reference Sechser and Fuhrmann2017). It is also not directly observable. Indeed, it is precisely because it is unobservable that it is presumed to have such important effects (Kertzer Reference Kertzer2016). Yet, exactly how this process occurs is far from obvious. Intergroup conflicts are characterized by a rich and complex information environment in which observers can turn to a nearly infinite number of indicators to draw inferences about which actors are more likely to stand firm than others. Assessing resolve in world politics is therefore fundamentally an ‘ill-structured problem’: the challenge is not one of connecting the dots, but of too many dots to connect (Levy Reference Levy1994). Given the large number of varied and countervailing indicators, which ones do observers rely on when assessing resolve?
International Relations (IR) scholars have struggled with this question, and there is still no agreement on what ‘military capabilities, interests at stake, and past and current actions’ lead actors to infer resolve in a given situation (Huth Reference Huth1999, 30). And despite a plethora of research in the two decades since that statement was made, we are still no closer to a definitive answer. Political scientists have produced a number of theoretical frameworks to understand inferences about resolve, ranging from the role of past actions (Jervis, Lebow and Stein Reference Jervis, Lebow and Stein1985; Mercer Reference Mercer1996; Schelling Reference Schelling1960; Schelling Reference Schelling1966; Weisiger and Yarhi-Milo Reference Weisiger and Yarhi-Milo2015), to costly signaling (Fearon Reference Fearon1997; Fuhrmann and Sechser Reference Fuhrmann and Sechser2014; Morrow Reference Morrow1994), to current capabilities and stakes (Press Reference Press2005), to an ever-growing list of leader attributes (Bak and Palmer Reference Bak and Palmer2010; Gelpi and Grieco Reference Gelpi and Grieco2001; Horowitz and Stam Reference Horowitz and Stam2012).Footnote 1 Yet, in providing evidence, we typically focus on testing theories in isolation from one another, precluding the development of an overarching conceptual framework to help us understand how these myriad factors work in concert, or to provide compelling justification why, from an information-processing perspective, we should expect certain cues to outweigh others.
In this article, we seek to contribute to this discussion, both conceptually and methodologically. Fundamentally, the question ‘which cues do observers use to assess resolve?’ is a question about information processing masquerading as a question about IR theory. We therefore draw on a burgeoning body of research in psychology to reconstruct these IR debates and provide an integrative framework that unites these typically disconnected theories, enabling us to view them as sets of heuristics observers can turn to in the face of a computationally intractable information environment. We classify these heuristics into two broad ‘families’ of indicators – behaviors and characteristics – that individuals may use to assess the likelihood that other actors will back down or stand firm. Methodologically, we test our theoretical framework using a conjoint experimental design ideally suited to answering this question, letting us capture the information-rich nature of international crisis-bargaining environments in a manner that would not be feasible with case studies, large-N analyses or even traditional survey experiments. By freeing us from the constraints of focusing on only a small number of treatments and side-stepping the endogeneity and collinearity concerns that threaten our ability to draw causal inferences using observational data, conjoint experiments allow us to adjudicate between the plethora of competing theoretical frameworks on resolve and credibility that have germinated over the past two decades, testing the observable implications from theoretical frameworks that are rarely investigated together.
Deploying our framework in a conjoint experiment embedded in a survey of 2,000 American adults, our results suggest that individuals are intuitive deterrence theorists: ordinary citizens seem to carry a ‘folk’ version of deterrence theory around in their heads, relying heavily on capabilities, interests, past actions and costly signals like military mobilization when assessing the resolve of others (Kertzer and McGraw Reference Kertzer and McGraw2012; Rathbun Reference Rathbun2009). For both behaviors and characteristics, our results also challenge the conventional wisdom in IR: in contrast to the significant body of theory on the ‘democratic advantage’ in disputes, our participants see democracies as less likely to stand firm than autocracies, and contradicting recent critiques of reputation in IR, our participants update their assessment of resolve based on past actions. As a robustness check, we also benchmark some of these findings for both behavior and characteristics using conceptual replications on an unusually elite sample of foreign decision makers from the Israeli Knesset, where we find effects of identical direction and strikingly similar magnitude as with the American mass public: our elite decision makers see democracies as less likely to stand firm compared to their autocratic counterparts, and the two groups interpret costly signals in similar ways. Our findings thus have implications for IR theory, public opinion about foreign affairs and the study of decision making more generally.
Heuristics, Cognition and Rationality
Whereas other scholarship has focused on the origins of resolve, and why some actors display more of it than others (Kertzer Reference Kertzer2016), our interest here is how observers assess it at a distance. This question is theoretically interesting because assessing resolve is a computationally intractable, ill-defined decision problem, characterized by irreducible uncertainty (Brutger and Kertzer Reference Brutger and Kertzer2018; Edelstein Reference Edelstein2002; Levy Reference Levy1994; Voss and Post Reference Voss and Post1988). There are a nearly infinite number of indicators that observers could use to assess whether another actor is likely to stand firm or back down in a crisis, many of which often point in different directions. In other words, assessing resolve represents exactly the kind of task for which we might expect observers to rely on heuristics: ‘fast and frugal’ decision rules that encourage quick and accurate decision making by focusing on relevant information and setting aside everything else (Gigerenzer and Gaissmaier Reference Gigerenzer and Gaissmaier2011, 454–5).Footnote 2
Thanks to the pioneering work of Gerd Gigerenzer, Leda Cosmides, John Tooby and others, the study of heuristics in psychology has undergone a paradigm shift in the past several decades. Because heuristics were introduced to IR scholars by the ‘heuristics and biases’ literature (Tversky and Kahneman Reference Tversky and Kahneman1974), many political scientists understand heuristics as deviations from rationality, a kind of bias or simple-minded cognitive shortcut less likely to manifest itself in high-stakes situations (Press Reference Press2005, 6). Current thinking on heuristics across psychology and related fields has begun to challenge both of these assumptions. Whereas political scientists tend to understand rational behavior as a matter of logical coherence (Lake and Powell Reference Lake and Powell1999, 7), psychologists increasingly understand it as a matter of ecological correspondence: not whether actors adhere to the axioms of logic and probability, but whether they behave in ways suited to achieving their objectives in a given environment (Gigerenzer Reference Gigerenzer2008, 3). One of the counterintuitive findings from the past few decades of cognitive research has been that for many of the problems we care about, ‘quick and dirty heuristics’ often outperform their more computationally intensive counterparts (Cosmides and Tooby Reference Cosmides and Tooby1994). This new take on heuristics challenges strongly held assumptions in both rationalist and psychological approaches to IR. It is not that we turn to heuristics because we are ‘cognitive misers’ unable to live up to the lofty optimizing standards of rational ideals, but that since many of the problems we face are either computationally intractable or ill defined, no optimal solutions exist (Gigerenzer and Gaissmaier Reference Gigerenzer and Gaissmaier2011). Homo economicus would have never made it out of the Serengeti.
Although social scientists accustomed to thinking of rational choice as a normative ideal were originally skeptical that heuristics would be widely used in high-stakes situations or by experts with higher-level cognitive capacities (Riker Reference Riker1995), we now know that this happens across situations, domains and levels of expertise: doctors use heuristics when making diagnoses where lives are at stake (Green and Mehr Reference Green and Mehr1997), judges use heuristics when making bail and sentencing decisions (Rachlinski Reference Rachlinski2000), and investors use heuristics when making financial decisions (Gigerenzer Reference Gigerenzer2008, 22). In political science, Sheffer et al. (Reference Sheffer2018) find that elite politicians display the same heuristic tendencies as ordinary citizens in the classic ‘Asian Disease’ experiment from the behavioral decision-making literature. The claim that heuristics bear no impact on the high-stakes world of international affairs may be an article of faith in some quarters, but remains unsupported by evidence.
This discussion thus has the potential to speak to a crucial puzzle in IR. As Yarhi-Milo notes, information about resolve ‘is often complex, ambiguous, and subject to manipulation and deception… cognitive limitations in processing innumerable stimuli, coupled with the need to distinguish usefully and correctly between credible signals and meaningless noise, require the use of some inference strategies or shortcuts’ (2014, 16). The question, then, is what inference strategies or shortcuts do observers actually use to assess resolve? Here, we argue that we do not need to generate ideas from scratch; we can rely on extant theories in IR – such as costly signaling and reputation – as a guide.
What Indicators do Observers Use to Assess Resolve?
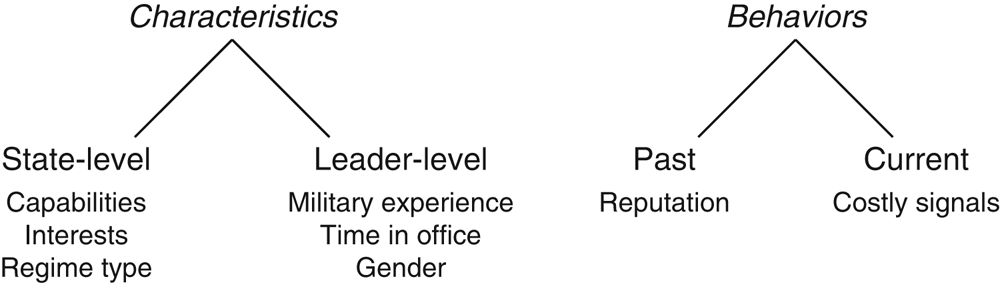
We compiled our list of indicators directly from the literature to which we seek to contribute: scholarly work on reputation and resolve. Though we often think of these as theories of international politics, they also contain explicit or implicit hypotheses about the types of cues observers should rely on when predicting whether an actor will stand firm or back down. In order to weave insights together from this diverse array of research, in the discussion below we subsume existing debates about resolve in IR into two broad classes of explanations, each containing two sub-classes of explanations that advance distinct hypotheses. The first class of explanations emphasizes the characteristics of the actor in question, at either the state level (capabilities, interests, regime type) or leader level (military experience, time in office, gender). The second emphasizes behavioral indicators, either in the past (reputation) or the present (signaling).
Characteristics
State-level characteristics
Observers can calibrate their assessments of an actor’s resolve with reference to characteristics at two different levels of analysis. State-level variables may include a state’s level of capabilities, the nature of its interests (generally or in a particular crisis) and its regime type, each of which may impact perceptions of the state’s resolve. For example, a state with greater capabilities may be perceived as more resolute since it is likely to face lower costs for holding firm compared to a weaker state. Capabilities are often modeled as a source of resolve in game theoretic approaches (Morrow Reference Morrow1989), and size and strength play important roles in assessments of formidability in evolutionary models (Holbrook and Fessler Reference Holbrook and Fessler2013). Similarly, a state with high stakes in a situation will likely be perceived as more resolute, such that actors with high levels of interest in the dispute will be more willing to bear the costs they face (Arreguín-Toft Reference Arreguín-Toft2001).
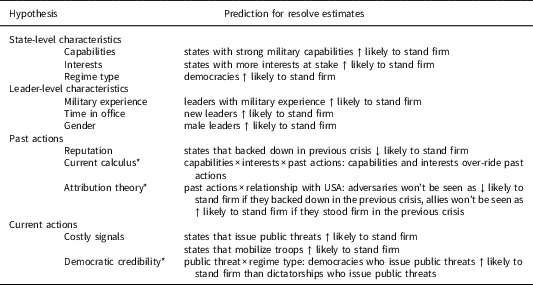
Moreover, as the literature on the democratic advantage suggests, democracies tend to outperform autocracies in crises for a variety of reasons, including their ability to be more strategic about the conflicts they enter and to display greater initiative on the battlefield (Reiter and Stam Reference Reiter and Stam2002), as well as their advantage at creating audience costs (Fearon Reference Fearon1994), which we discuss in greater detail below. Based on these various characteristics – capabilities, interests and regime type – we generate the first three hypotheses in Table 1.
Hypotheses

* Denotes an interactive hypothesis predicting the diagnostic weight of one indicator depends on the weight of others; all other hypotheses focus solely on the average effect of a single indicator.
Leader-level characteristics
A growing body of literature has claimed that particular attributes of leaders affect their inclination to stand firm or back down in a crisis, and by implication, others’ assessments of their level of resolve. Along those lines, Horowitz and Stam (Reference Horowitz and Stam2012) find that leaders with prior military service, but not combat experience, are significantly more likely to initiate militarized disputes and wars than those without military experience. Gelpi and Grieco (Reference Gelpi and Grieco2001) find that because democracies have a high rate of leadership turnover, democratic leaders have less time in office, and thus less experience compared to their authoritarian counterparts. As a consequence, democracies are more likely to be challenged than autocracies in international crises, since their inexperienced leaders are perceived to be more likely to make concessions. Looking at the effect of leadership turnover on resolve, Wolford (Reference Wolford2007) theorizes that observers’ incentives to probe the resolve of new leaders leads the latter to stand firm and develop a reputation for resolve in their early years in office. Building on this, Renshon, Dafoe and Huth (Reference Renshon, Dafoe and Huth2018) find that the importance of leader-level characteristics – for inferences about resolve – itself varies according to the amount of influence leaders are perceived to have in a given situation.
Examining the impact of gender on conflict initiation, McIntyre et al. (Reference McIntyre2007) show that men are more likely to engage in aggressive action than women, and are also more likely to lose their fights, suggesting a relationship between testosterone levels and aggression. In addition to biological differences, social expectations may also suggest to observers that female leaders will be less resolute than male leaders in crisis situations (Caprioli and Boyer Reference Caprioli and Boyer2001). Yet none of these findings is ironclad: biological differences may push in the opposite direction in some cases (such as older female leaders with comparable testosterone levels to males, McDermott et al. (Reference McDermott2007)), and selection effects might result in only extremely tough females coming to power (Anzia and Berry Reference Anzia and Berry2011). The insights and findings reported above can help us generate three hypotheses about particular ways in which leaders’ attributes and experience could affect observers’ assessments of resolve, summarized in the second panel of Table 1.
Behavioral Indicators
Past actions
Behavioral indicators of resolve refer to actions that actors carry out in order to communicate their intentions to stand firm. A well-established literature on reputation in international politics holds that one of the most common ways actors calculate the credibility of current commitments is by looking at past actions (Copeland Reference Copeland1997). American presidents and political scientists have long assumed that reputation matters in international politics. For much of the Cold War, scholars emphasized the importance of a state’s reputation for resolve as means of deterring future conflicts. The United States’ reputation was seen as one of its most valuable possessions: President Truman justified intervention in Korea on the grounds that a failure to respond ‘would be an open invitation to new acts of aggression elsewhere’, while Thomas Schelling asserted that the loss of 30,000 men in the resulting inconclusive war was ‘undoubtedly worth it’, because doing so saved face for the United States and thus positively influenced Soviet expectations of American behavior in future crises (Schelling Reference Schelling1966, 124–5). Most recently, Weisiger and Yarhi-Milo (Reference Weisiger and Yarhi-Milo2015) have found that states that backed down in the past were more likely to be challenged in subsequent militarized disputes. They report that inferences drawn from past actions hold for both democracies and non-democracies and are not reset after leadership turnovers.
In contrast to those who believe that reputation matters in international crises, a number of scholars have called into question the effectiveness of past actions in affecting assessments of resolve (Clare and Danilovic Reference Clare and Danilovic2012; Hopf Reference Hopf1994; Huth and Russett Reference Huth and Russett1984; Mercer Reference Mercer1996; Press Reference Press2005). Jervis (Reference Jervis1982), for example, notes that reputational logics lead to a paradox: if actors care about maintaining their reputation for resolve, why should observers assume that an actor who backed down in the past is more likely to back down in the present crisis, rather than more likely to stand firm out of a desire to rebuild their reputation? Others offer critiques that implicate interactions between past actions and other types of indicators. Press (Reference Press2005), for example, offers a ‘Current Calculus’ hypothesis in which current capabilities and interests override the effects of past behavior. Unlike the capabilities and interests hypotheses, the implication here is an interaction effect, in which capabilities and interests not only matter in their own right, but also change how much diagnostic weight is placed on past actions. Mercer (Reference Mercer1996) offers an equally pessimistic view about reputation, but for different reasons, turning to attribution theory – itself a set of theories about how people process information – to argue that assessments of resolve are affected by the relationship between the observer and the state in question, that is, whether they are allies or adversaries. Mercer contends that only undesirable behavior by another country – such as when allies back down or adversaries stand firm – elicits dispositional attributions, such that only undesirable behavior can be used to predict future behavior. All three of these hypotheses about past actions are summarized in Table 1.
Current actions
The second set of behavioral indicators concerns an actor’s current actions, that is, the signaling behavior of leaders during a crisis. The writings of Schelling (Reference Schelling1960), Jervis (Reference Jervis1970), Fearon (Reference Fearon1997) and others on crisis bargaining feature one common theme: by engaging in particular costly gestures or actions that raise the risks of escalation, leaders can effectively manipulate others’ assessments of their resolve. Put differently, because resolve is private information and leaders have incentives to pretend to be resolved even when they are not, they need to take actions that would be costly enough to separate them from those unresolved types. Two types of costly signals have received much attention in the literature: sinking costs and tying hands.Footnote 3
The first type of costly signal of resolve – ‘sinking costs’ – refers to actions, such as mobilizing troops, which are financially or militarily costly ex ante.Footnote 4 These are actions that are costly to undertake in the near term but do not impact the payoffs associated with future courses of action. The second type of costly signal refers to actions that tie the hands of leaders by creating costs that leaders will suffer ex post if they do not follow through on their commitment. Following Fearon (Reference Fearon1994), a large literature on audience costs has suggested that democratic states are more credibly able to issue threats than non-democratic ones, because of the presence of a domestic audience that will punish leaders when they back down on threats. If this argument is true, we would expect the effect of public threats on assessments of resolve to vary with regime type: democracies that issue public threats would be perceived as more resolved than their non-democratic counterparts. However, a vibrant strain of recent work in IR has argued that the ‘democratic–autocratic’ distinction is either misleading or overstated. Weeks (Reference Weeks2008), for example, shows that there is significant variation within autocratic states; some types can credibly generate audience costs at rates similar to their democratic counterparts. Relatedly, Downes and Sechser (Reference Downes and Sechser2012) show that the purported ‘democratic advantage’ is – if it exists at all – far smaller than previously believed. Both of these current actions hypotheses are depicted at the bottom of Table 1.
Research Design
The advantage of the conceptual framework outlined in Figure 1 is twofold. First, it illustrates the extent to which different quadrants of the IR literature have pointed to very different indicators that can be used to infer resolve, each of which offers an observable implication that can be subjected to empirical testing. Secondly, it offers a loose conceptual ordering to suggest how these different sets of factors are related to one another.
What indicators do we use to assess resolve?

Testing this many competing theories against one another, however, poses a number of methodological challenges. Although many of these theories make causal claims, clean counterfactuals are often hard to come by, and many of our factors of interest are endogenous (are current behavior and past actions ever independent of one another?) or collinear (is regime type ever randomly distributed?), which threatens our ability to draw causal inferences using observational data. In this context, experimental methods can offer important advantages, leveraging random assignment to eliminate confounding variables and explanations. For reasons of statistical power, however, experiments in IR have traditionally focused on manipulating only a small handful of factors at a time, and prior experimental work on credibility and reputation has been no exception (Tingley and Walter Reference Tingley and Walter2011; Tomz Reference Tomz2007). This approach has allowed us to uncover the likely influences on assessments about resolve in isolation, but does not let us address the question we are interested in here: when presented with a plethora of potential indicators of an actor’s resolve, which ones do observers latch on to, and which ones do they generally set aside?
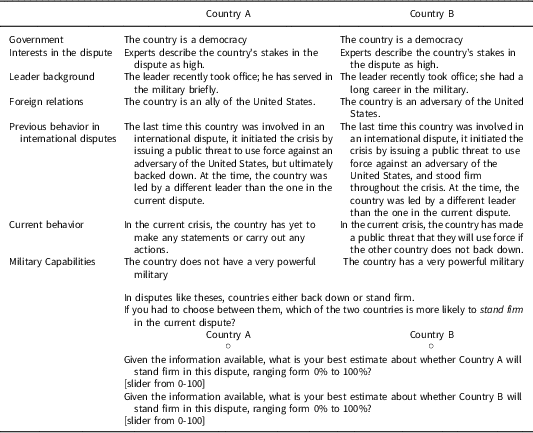
To address this issue, we use a conjoint experimental design, which is ideally suited to addressing the question we are interested in (Hainmueller, Hopkins and Yamamoto Reference Hainmueller, Hopkins and Yamamoto2014). In our conjoint experiment, subjects are shown randomly generated profiles for two countries, A and B, and told that these two countries are engaged in a foreign policy dispute. Subjects are then asked to indicate which country they think is more likely to stand firm. We then repeat the exercise seven more times, each involving a dispute between a different pair of randomly generated country profiles. All of the treatments are straightforward, and the levels of the categories were chosen either because they presented obvious and limited options (for example, democracy/dictatorship/mixed regime), because the literature suggested certain categories (Horowitz and Stam Reference Horowitz and Stam2012, for example, varying levels of military experience) or simply to highlight certain contrasts (such as low/high stakes) in order to identify a potential effect, should it exist. These (really, all) design choices have consequence for interpretation: for example, we identify an ‘effect of stakes’ that is quite large, but must balance that with the fact that this manipulation was particularly stark (it is possible that alternative wordings might identify effects that are smaller in magnitude).
One of the most significant advantages of conjoint designs is a significant gain in statistical power. Such designs allow us to simultaneously manipulate the litany of factors discussed above, about which IR scholars have offered a variety of – often contradictory – theoretical expectations. Conjoint designs free us from the power constraints that limit traditional factorial experiments by making a small number of assumptions, all of which are either guaranteed by the design itself or verifiable empirically, allowing us to pool observations across choice tasks, despite the fact that there are many more possible country profiles than are ever observed in the study. In Appendix 1, we conduct a detailed sensitivity analysis to validate these assumptions and demonstrate the robustness of our results. For example, we find no evidence that respondents behave differently over time as they become familiar with the study (that is, ‘demand effects’). An additional advantage is that paired conjoint designs similar to the one utilized here seem to perform remarkably well in reproducing behavioral data obtained in actual voting and choice contexts (Hainmueller, Hangartner and Yamamoto Reference Hainmueller, Hangartner and Yamamoto2015). The end result of conjoint experiments is the ability to estimate the effect of each treatment – in this setup, referred to as the average marginal component effect (AMCE) – with a relatively small number of subjects (N=2,000). The AMCE represents the average difference in the probability of being seen as more likely to stand firm when comparing two different attribute levels – for example, a democracy versus a dictatorship – where the average is taken over all possible combinations of other country attributes.
Sample
The study described below was fielded on 2,009 American adults recruited via Amazon Mechanical Turk (MTurk) in January 2015, a widely used resource in experimental social science; we elaborate on our use of the sample in detail in Appendix 4.Footnote 5 In this sense, our main experimental results speak to how members of the mass public assess resolve, a decision we make for three reasons. First, what the public thinks has significant ramifications for theories of IR: the empirical record shows that American leaders carefully monitor public opinion in making decisions about the use of force, intervention, retrenchment, nuclear deployment and so on. From tempering President Eisenhower’s approach to the Taiwan Crisis of 1958, to compelling President McKinley’s involvement in the Spanish–American War, to reversing President Clinton’s Somalia intervention in 1993 (Foyle Reference Foyle1999, 201–29), public opinion frequently shapes American foreign policy during crises. Whether the channel of influence is direct (such as when leaders pay attention to the polls, as in Tomz, Weeks and Yarhi-Milo Reference Tomz, Weeks and Yarhi-Milo2017) or indirect (such as through congressional pushback, as in Gelpi and Grieco Reference Gelpi and Grieco2015), there is much to be learned from an investigation of the manner in which ordinary citizens evaluate and draw inferences about resolve in international affairs (Kertzer Reference Kertzer2016, 50–1).
Secondly, the phenomenon we explore here is bigger than just IR: evolutionary theorists argue that selection pressures have hard-wired humans and other animals with cognitive and behavioral mechanisms to enable us to quickly and accurately draw inferences about others’ resolve, or what anthropologists and evolutionary biologists call ‘resource-holding potential’ or ‘formidability’ (Maynard Smith Reference Maynard Smith1974; Parker Reference Parker1974; Sell, Tooby and Cosmides Reference Sell, Tooby and Cosmides2009; for an application of this coalitional psychology to IR, see Lopez, McDermott and Petersen Reference Lopez, McDermott and Petersen2011). The question of how we employ these adaptive mechanisms and weight multiple factors into a single summary representation to assess formidability is thus far from a question that solely applies to high-ranking intelligence officers, as seen by the range of studies that have tested this question in a wide range of animals, including five-year old children, for example (Pietraszewski and Shaw Reference Pietraszewski and Shaw2015). Given that we know how toads, speckled wood butterflies, red deer and African elephants assess resolve (Clutton-Brock and Albon Reference Clutton-Brock and Albon1979; Davies Reference Davies1978; Ganswindt et al. Reference Ganswindt2005), it seems germane for us to ask the same question about ordinary humans.
The last point is methodological in nature. One of the reasons for the persistent disagreements in debates about assessments of resolve is that scholars confront a cornucopia of competing theories, but relatively little data to help us adjudicate between them. Although many of these theories make causal claims, clean counterfactuals are often hard to come by, and many of our factors of interest are endogenous or collinear. In this context, experimental methods can offer important advantages in isolating and manipulating causal features of interest. Importantly, though, if we want to harness the advantages of experimental methods, we must – even if we are eventually concerned with the inferences of leaders – by necessity begin with studies on ordinary citizens. Moving on to elite samples makes sense only after replications and extensions have increased our confidence in a given research program and narrowed down the plausible candidates for experimentation to a feasible number of factors for study in the extremely small samples that characterize elite experimentation. Below we do just that – benchmark our US mass public results with those from foreign elite decision makers – and find striking similarities between the two samples that both reassure us about our findings, and raise interesting theoretical questions.
Experimental Design
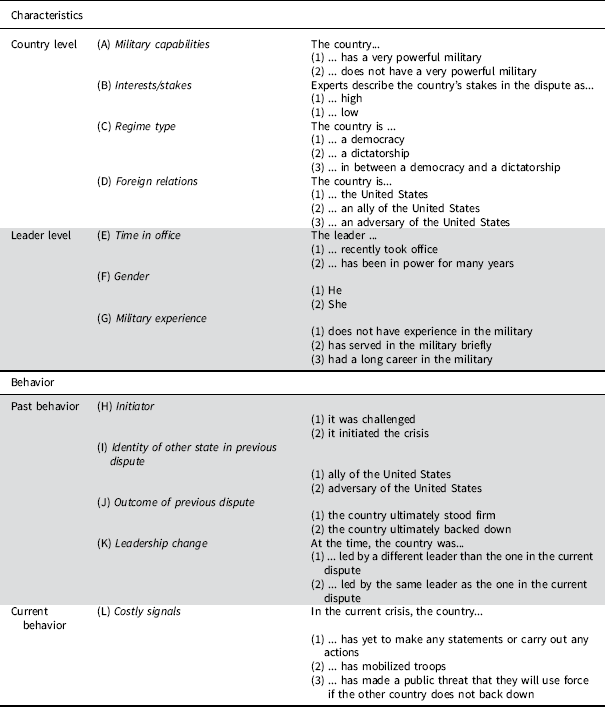
After the consent process, subjects saw an introductory screen that told participants they would be presented with information about a series of foreign policy disputes over contested territories; in each case, they would be shown information about a pair of countries involved in a dispute, and asked to make predictions about what they think would occur.Footnote 6 Subjects were then presented with the first scenario, which randomly generated attributes for each of the countries in the dispute, and asked participants to indicate which country they saw as being more likely to stand firm. The full list of treatments is presented in Table 2, grouped into the two main categories, attributes and behavior. Within those categories, groups (such as ‘country-level’ and ‘leader-level’ attributes) are separated by double horizontal lines. Every treatment was randomized independently subject to two constraints. The first constraint was simply that some groups of treatments (those displayed in gray), while still randomized independently, were displayed together. This was done in order to avoid inadvertently highlighting some of the more subtle treatments and to preserve the naturalistic display of information in full, readable sentences (Huff and Kertzer Reference Huff and Kertzer2018). The second constraint was that if the country was assigned to be the United States, it was always described as being a democracy with a powerful military, and if one country was the United States, the other country in the scenario was constrained so that it could not also be the United States. A sample scenario is depicted in Table 3.
Conjoint study treatments

Note: treatment categories are denoted by letters (A–L), while gray blocks denote clusters of treatments that are displayed together in order to remain understandable. All other items are displayed in a random order. Though displayed together, all treatments in gray clusters are manipulated independently save for the constraints imposed on randomization if the country is designated as being the United States (described in detail in the main text).
Sample conjoint choice

Participants were then presented with seven additional randomly generated conflict scenarios, such that each respondent performed the task eight times in total.Footnote 7 Either before or after the main study, participants answered a series of demographic questions, including gender, age, education, party ID, ideology, and interest in politics and international affairs.Footnote 8
Two points are worth stressing here. First, our dependent variable is an assessment of resolve rather than ‘credibility’, a narrower concept that refers only to scenarios in which explicit threats or promises are made. In our research design, we look at whether democracies are able to threaten more credibly, but we also examine the broader question of whether democracies are seen as more resolved in general. Secondly, our list of treatments (Table 2), large as it may be at fifteen factors with twenty-seven levels (equivalent to a 2×3×2×2×3×3×2×2×2×2×3 factorial design, with a total of 10,368 cells), is obviously not exhaustive. There are myriad additional state- and leader-level characteristics and behaviors that might be studied in future work; our goal here is to focus on fifteen of the main factors the IR literature has pointed to when exploring questions of assessments of resolve, and pit them against one another in a manner that would be difficult with either traditional factorial experiments or observational data.Footnote 9
Results and Discussion
For purposes of simplicity, in the discussions below we focus only on those crises in which participants were either allies or adversaries of the United States, but not the United States itself. Two rationales drive this decision. Methodologically, estimating the resolve of our direct opponents triggers motivated biases that we are able to sidestep by focusing on observers. Substantively, the results shown here represent foreign policy disputes in which respondents are third-party observers rather than affiliated with the actors, reflecting an important class of crises – including the Suez Crisis, the Iran–Iraq War, recurring Indo-Pakistani and Arab–Israeli crises – in which Americans were onlookers rather than immediate participants. The quantities of interest are calculated from 8,090 choice tasks made by 1,995 participants between 16,180 country profiles.
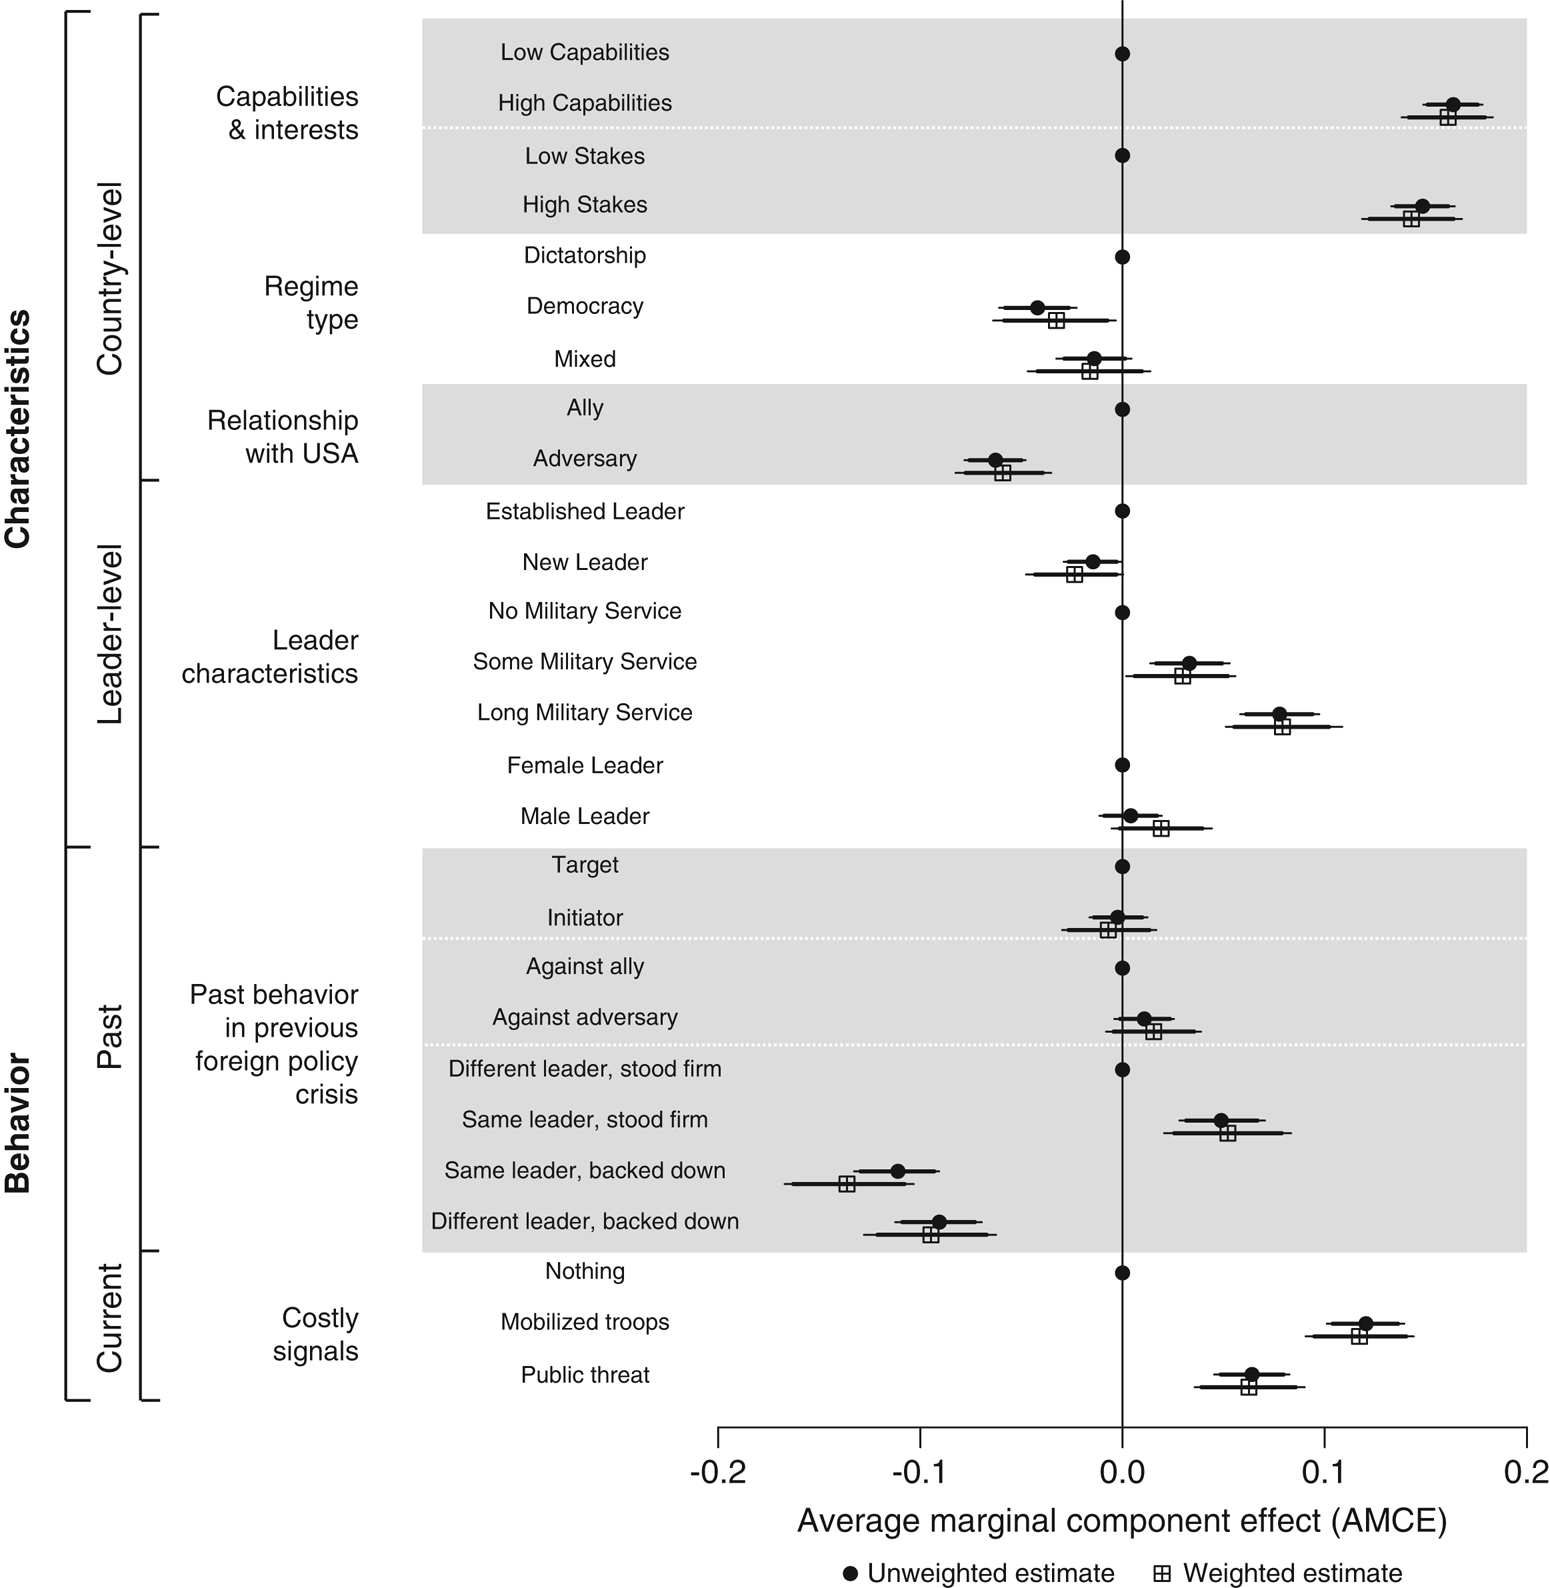
We begin our analysis by estimating the AMCEs, presented with 95 per cent clustered bootstrapped confidence intervals in Figure 2. Unweighted estimates are presented with filled circles, and weighted estimates with open squares, although in all cases the estimates are nearly identical, so to streamline the discussion below, we discuss the unweighted estimates in the main text. In both cases, these estimates tell us the percentage change in the perceived likelihood that an actor with a particular attribute will be seen as being more likely to stand firm in a foreign policy dispute. Since, with the exception of the past behavior treatments (described in greater detail below), these quantities are calculated by averaging all of the other factor-level combinations, these quantities can be interpreted as conceptually similar to the main effects from a factorial experiment. As is generally the case with conjoint experiments, our interest here is less in rejecting null hypotheses of no effect, and more in comparing the relative magnitude of AMCEs: of the factors cited most frequently in the IR literature, which ones do observers weigh most heavily when assessing resolve, and which ones do they largely ignore?
Predicting perceptions of resolve Note: the figure depicts Average Marginal Component Effects (AMCEs) with 95% clustered bootstrapped confidence intervals. All estimates should be interpreted relative to the baseline category, indicated by the point without horizontal bars at x=0. Thus, for example, states with high capabilities are perceived as 16% more likely to stand firm than states with low capabilities.

Capabilities and Interests
We begin by looking at the effect of state-level characteristics on perceptions of resolve, starting with the results for the capabilities and interests at stake, shown at the top of Figure 2. Recall that we define interests in this context as representing where an issue falls in a state’s list of priorities: how much they care about an issue and how much effort/expense they are willing to expend in order to get their way. Consistent with Press’s (Reference Press2005) Current Calculus hypothesis – which we examine in greater detail below – we see that observers indeed place great weight on an actor’s military capabilities and level of interests at stake in the dispute. States with powerful militaries are perceived as 16.4 per cent more likely to stand firm than those with less powerful militaries, while states with high stakes in the dispute are seen as 14.8 per cent more likely to stand firm than states with low stakes.
The substantively large effects of these two characteristics is of interest not just because of their prominence in IR theories, but also because evolutionary theorists argue that selection pressures have hard-wired humans and other animals with cognitive and behavioral mechanisms geared towards assessing the strength and interests of others (Maynard Smith Reference Maynard Smith1974; Parker Reference Parker1974). Although we present these cues directly for participants rather than having them assess capabilities and interests themselves, it is theoretically sensible that they would rely heavily on these indicators when assessing resolve.
Regime Type
Turning to the effects of varying a state’s regime type, the results show that, in contrast to theories of democratic superiority in crisis bargaining, respondents saw democratic states as 4.2 per cent less likely to stand firm than dictatorships; states with mixed regime types in between democracies and dictatorships were seen as 1.4 per cent less likely to stand firm than dictatorships, but the difference between the two is not statistically significant. These findings are of interest given debates in IR theory between ‘democratic triumphalists’ and ‘defeatists’ (Desch Reference Desch2008), the former touting the superiority of democracies both in terms of their likelihood of winning the wars they fight (Lake Reference Lake1992) and how they choose which wars to get into (Reiter and Stam Reference Reiter and Stam2002), and the latter emphasizing how the mercurial and idealistic public threatens the viability of democratic foreign policy (Kennan Reference Kennan1951). In his model of the informational effects of democratic institutions in crisis bargaining, Schultz (Reference Schultz1999) finds that foreign rivals should be more likely to back down when facing democracies in a dispute, due to the belief that democratic institutions and a free press should make democracies less likely to bluff. Our results here do not support that view, and are consistent instead with the apprehension voiced by Kennan (Reference Kennan1951). At least as far as members of the US public are concerned, democratic states are seen as slightly less likely to stand firm than non-democratic ones.
Leader Characteristics
In general, the results above showed substantively strong effects for country-level characteristics on assessments of resolve. In contrast, leader characteristics offer mixed results. Previous work had suggested that that new leaders have a greater incentive to stand firm and develop a reputation for resolve in their early years in office. Our results show why this is the case: we find that new leaders are perceived as slightly (1.5 per cent) less likely to stand firm compared to those who have been in power for many years. Its relatively weak substantive effect, however, suggests that experience plays less of a role in assessing resolve than the other attributes discussed above. The effects of gender are similarly weak: participants are no more likely to attribute resolve to male leaders than female ones. The null results of gender are noteworthy given gendered conceptions of leadership qualities in military contexts, and could be due to perceived selection effects, in which female politicians who secure powerful positions are seen as no different than their male counterparts.Footnote 10
The one leader-level characteristic that participants do use as a heuristic to predict resolve is military experience: countries governed by leaders with extensive military experience are seen as 7.8 per cent more resolved than those with no military experience; even leaders with only brief military service get a 3.3 per cent boost in perceived resolve. These results are thus consistent with work by Horowitz and Stam (Reference Horowitz and Stam2012) showing the distinctive foreign policy behavior of leaders with military experience, although unlike in their work, we do not differentiate based on combat experience. In general, though, the situational features of the crisis – the balance of capabilities and interests – contribute more to perceptions of resolve than the characteristics of the leaders themselves. Regardless of the extent to which leaders matter in international politics, it is noteworthy that in our study, ordinary citizens tend to ascribe a greater role to broader structural factors than the leader characteristics we manipulate here.
Past Behavior
Past behavior represents a theoretically important set of attributes. Our experiment manipulated the country’s previous behavior in a foreign policy dispute in four ways: (1) whether it initiated the crisis or was the target, (2) whether the opponent the country faced in its previous crisis was an ally or adversary of the United States, (3) whether the leader of the country at the time of the dispute is the same leader as the one in the current crisis, and (4) whether in the previous crisis the country ultimately stood firm or backed down.
In Appendix 1.3 we interact all four of these past behavior variables with one another, but for ease of interpretation in Figure 2 we reduce the number of quantities of interest and only interact the previous outcome and leader identity treatments, while presenting the average effects of the target/initiator and against ally/against adversary treatments. While neither of the latter significantly affects perceptions of resolve, we see theoretically important effects for the former.
First, states that backed down in their previous dispute are seen as significantly less resolved in the current crisis, offering evidence that participants indeed draw reputational inferences from past behavior. If the leader in charge was the same as in the current crisis, backing down corresponds with an 11.1 per cent decrease in the perceived likelihood of standing firm, while a different leader backing down causes a 9.1 per cent decrease in the perceived likelihood of standing firm. Thus, although it appears that backing down in past disputes is more informative under the same leader than a different one, the differences between the two effects are not statistically significant. In contrast, when the country stood firm in the previous dispute under the same leader, it is perceived as being 4.9 per cent more likely to stand firm than when the country stood firm in the previous dispute under a different leader. Thus we find evidence of leader-specific reputations for standing firm, but not for backing down. These results are sensible – consistent with an analogical reasoning model of reputational inference in which observers draw stronger inferences from past behavior the more the previous context resembles the current one (Shannon and Dennis Reference Shannon and Dennis2007) – but not trivial.Footnote 11 Jervis (Reference Jervis1982, 12–13), for example, notes a reputation paradox in which states that have backed down in the past may be more likely to stand firm in the future precisely to avoid incurring reputation costs, which raises the prospect that observers will expect states ‘to follow retreats with displays of firmness’, a pattern we do not see here.
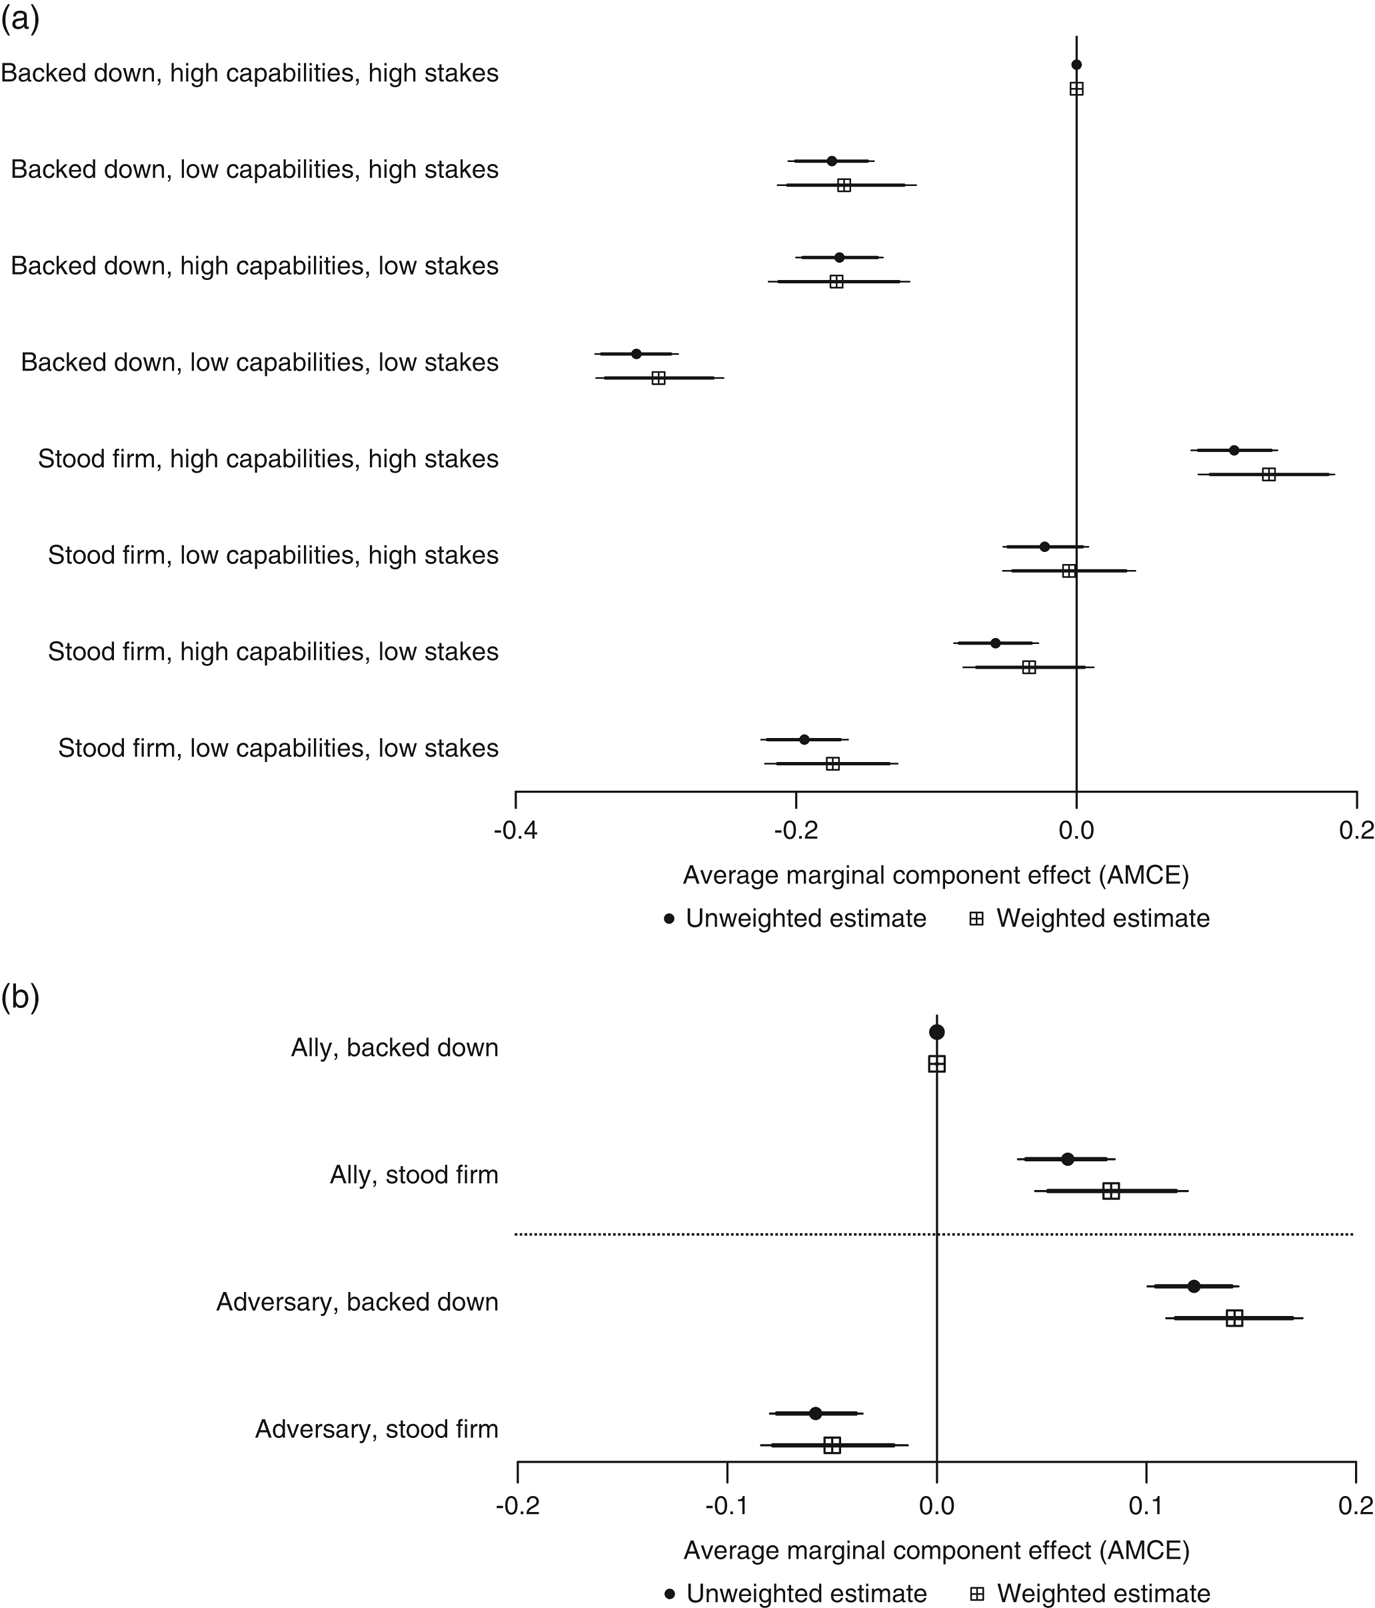
The results also challenge the Current Calculus hypothesis, which we operationalize by interacting a state’s capabilities, interests and outcome of the previous conflict. Although observers indeed look towards capabilities and interests in calculating capability, past behavior still matters, and observers do draw inferences from previous actions. As the quantities in Figure 3a illustrate, for every combination of capabilities and interests, participants see standing firm in the past as significantly boosting the likelihood of standing firm in the present, and the informative value of past behavior does not vary across different levels of current capabilities and interests.Footnote 12
Testing theories of reputation Note: the figures depict AMCEs with 95 per cent clustered bootstrapped confidence intervals. The results in Panel A offer limited support for the Current Calculus hypothesis: actors do draw inferences about resolve based on whether an actor stood firm or backed down in the past, but its effects can be overcome. For instance, if an actor backed down in the past dispute but its capabilities and stakes are both high, observers will still perceive it as being significantly more resolved than an actor that stood firm in the past dispute and has high capabilities but low stakes. The results in Panel B fail to offer support for the attribution theory hypothesis: allies who stand firm indeed gain reputations for resolve, while adversaries who back down gain reputations for irresolution.

Finally, Figure 3b tests the Attribution Theory hypothesis, which holds that observers are more likely to make situational attributions for desirable actions, and dispositional ones for undesirable ones, thereby implying that adversaries will be unable to lose their reputation for resolve by backing down, while allies will be unable to gain a reputation for resolve by standing firm. We operationalize this hypothesis by interacting the outcome of the previous crisis with whether the country was an ally or adversary of the United States.
As the figure illustrates, we fail to find evidence in favor of the Attribution Theory hypothesis: allies who stood firm in the past indeed gain a reputation for resolve and are seen as more likely to stand firm in the current crisis, while adversaries who backed down in the past indeed gain a reputation for irresoluteness and are seen as less likely to stand firm in the current crisis. In supplementary analyses, we operationalize the concept of ‘desirability’ further by interacting the ally/adversary and past outcome treatments with the identity of the other state in the previous dispute, letting us explicitly test whether adversaries who back down against allies in the past develop different reputations for resolve than adversaries who backed down against other adversaries, and so on. The results hold, indicating that the effects of standing firm or backing down in the past are not moderated by the relationship of the previous opponent in the dispute to the United States.
Current Behavior
We next turn to the effect of current behavior on perceptions of resolve. Consistent with the literature on the informative value of public threats – which tie leaders’ hands if they do not follow through (Fearon Reference Fearon1997) – we see that countries that make public threats are perceived as 6.4 per cent more likely to stand firm. Interestingly, though, participants see sunk costs in terms of troop mobilizations to be a more credible signal: states that mobilize troops are seen as 12 per cent more likely to stand firm. Thus we find that while talk might be cheap, it is not free: our participants see it as significantly less costly than other signals a leader can send.Footnote 13
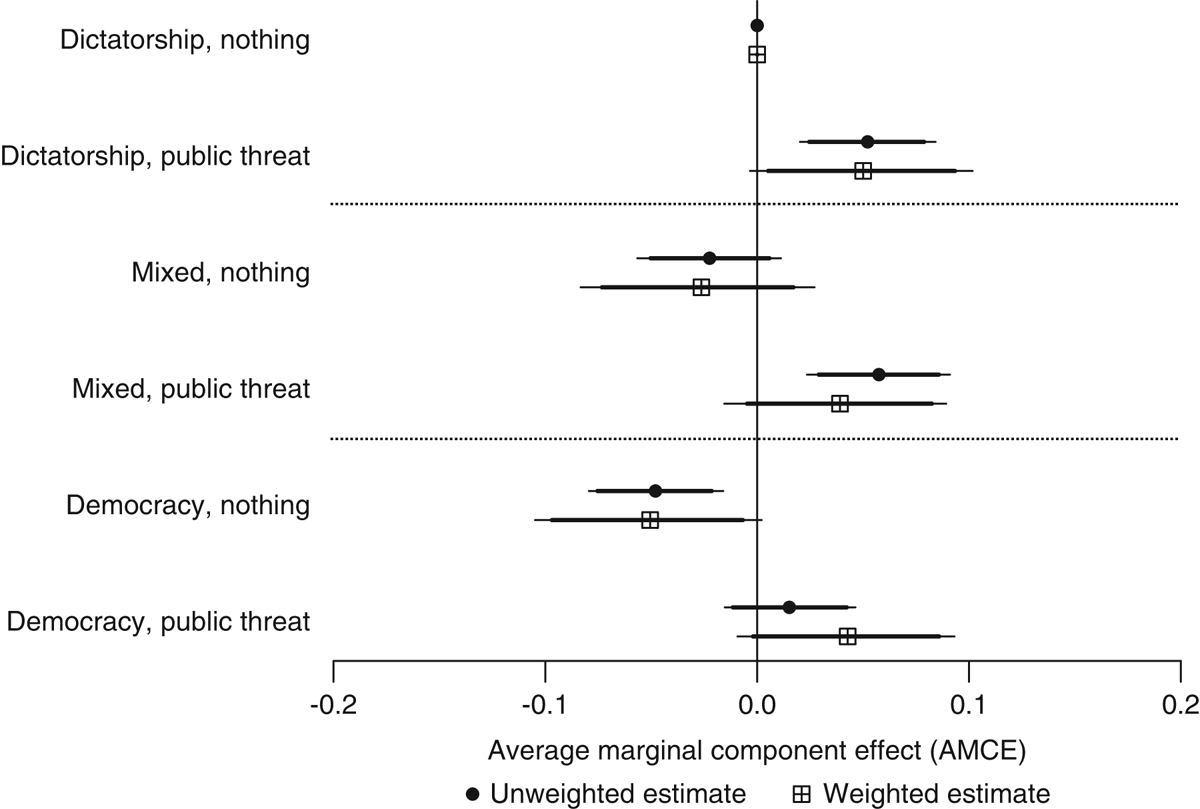
Finally, Figure 4 tests the Democratic Credibility hypothesis, which holds that democracies – compared to their non-democratic counterparts – are better able to harness the signaling advantages of domestic audience costs and issue more credible threats. We operationalize the hypothesis by dropping observations in which countries mobilize troops – leaving only those where countries either did nothing or issued a threat – and interact the country’s regime type with whether it issued a public threat.
Testing democratic credibility theory Note: the figure depicts AMCEs with 95 per cent clustered bootstrapped confidence intervals. The results fail to offer support for the Democratic Credibility hypothesis: although public threats increase the perceived resolve of both democracies and dictatorships relative to when actors do not issue threats, democracies do not get a bigger credibility boost from public threats than dictatorships do.

The results show that regimes of all types are able to credibly threaten. Importantly, though, democracies do not appear to display any unique advantages in this regard: democracies that issue threats are not seen as any more likely to stand firm than dictatorships that issue threats. Nor is the effect of a public threat greater for democracies than for dictatorships. Our results are thus consistent with Weeks (Reference Weeks2008), who argues that autocracies are also able to create audience costs, and Downes and Sechser (Reference Downes and Sechser2012), who find that the democratic advantage in crisis bargaining is overstated.
In sum, then, although the experiment manipulated a large number of countervailing factors, our participants assessed resolve in clear and consistent ways. Although the treatment contrasts were deliberately high – the regime type treatment, for example, compares democracies with dictatorships, and the alliance treatment compares allies with adversaries – the stark nature of the treatments cannot account for the results we observe: while all of our contrasts were designed to mirror significant real-world differences, some of them mattered a great deal while others did not. Moreover, differences between our subjects did not translate into differential responses to our treatments. In Appendix 1.4, we show that there is a conspicuous absence of heterogeneous treatment effects: all types of respondents – more and less educated, hawks and doves, etc. – used the same heuristics to infer resolve. Moreover, we tested for and found scant evidence of higher-order interactions (Appendix 1.4.2); that is, the effect of any given variable did not depend on the particular combination of other variables seen in a given choice task.
Interestingly, the four largest effect ranges in our analysis – capabilities, interests, past actions (particularly under the same leader) and costly signals – come from both the characteristic and behavioral cluster of indicators, suggesting that observers do not selectively attend to static over fluid indicators, or vice versa. More important, though, is that the four indicators observers saw as the most informative when assessing resolve are precisely the ones that deterrence scholars have traditionally highlighted (for example, Huth and Russett Reference Huth and Russett1984; Schelling Reference Schelling1960). Since we can safely presume our participants are not trained IR scholars, this raises interesting questions about why exactly ordinary American adults carry around intuitive versions of deterrence theory in their heads – a point we return to below. Before we do, however, it is worth exploring whether elite decision makers assess resolve in similar ways.
Generalizing to Leaders
While much is made of the question of ‘external validity’, and in particular the samples used in experimental IR, it is important neither to overstate the problem nor to oversell the solution. There are serious trade-offs associated with elite experiments: given sample size limitations, elite studies will never be as complex, comprehensive or subtle as their counterparts. However, in this case, there are two critical benefits to a study of resolve among elites: it both accomplishes an important methodological goal by conceptually replicating the results from our conjoint experiment on the US mass public, and extends the results to a population that is often (though not always) the focus of our IR theories. Another feature of conceptual replications such as the one described below is that they have a great upside to the extent that they are able to confirm the existence of causal relationships even when there is a ‘radical transformation’ of procedures, measurement and experimental designs (Hendrick Reference Hendrick1990).
To that end, we describe here the results of a second set of experiments (Regime Type and Costly Signals) conducted by the authors on an unusually elite sample of eighty-nine current and former members of the Israeli Knesset.Footnote 14 These leaders are among the more ‘elite’ subjects studied experimentally in IR, ranking all the way up to prime minister, with two-thirds of the sample having served on the Foreign Affairs and Defense Committee. While our conjoint experiment examined numerous factors, here we focus on two in particular (another way in which these studies differ from a ‘direct’ or ‘literal’ replication): one from our characteristics (regime type) and the other from our behavior (costly signals) categories. These were the only characteristics manipulated in the elite experiments and were chosen (from among the significant results in our conjoint experiment) due to their prominence in the literature.
In the Regime Type experiment, subjects read about a situation in which two countries were involved in a public dispute over a contested territory. Country B was described as a dictatorship, while Country A was described as either a democracy or a dictatorship, controlling for many of the same factors manipulated in the conjoint experiment in the United States.Footnote 15 We then asked, ‘Given the information available, what is your best estimate about whether Country A will stand firm in this dispute, ranging from 0 per cent to 100 per cent?’ In this way, it was strikingly similar in its basic setup to the conjoint experiment: respondents were asked to play the part of observers to some conflict between two countries, given information about those two countries and then asked to estimate which would stand firm in the interstate dispute.
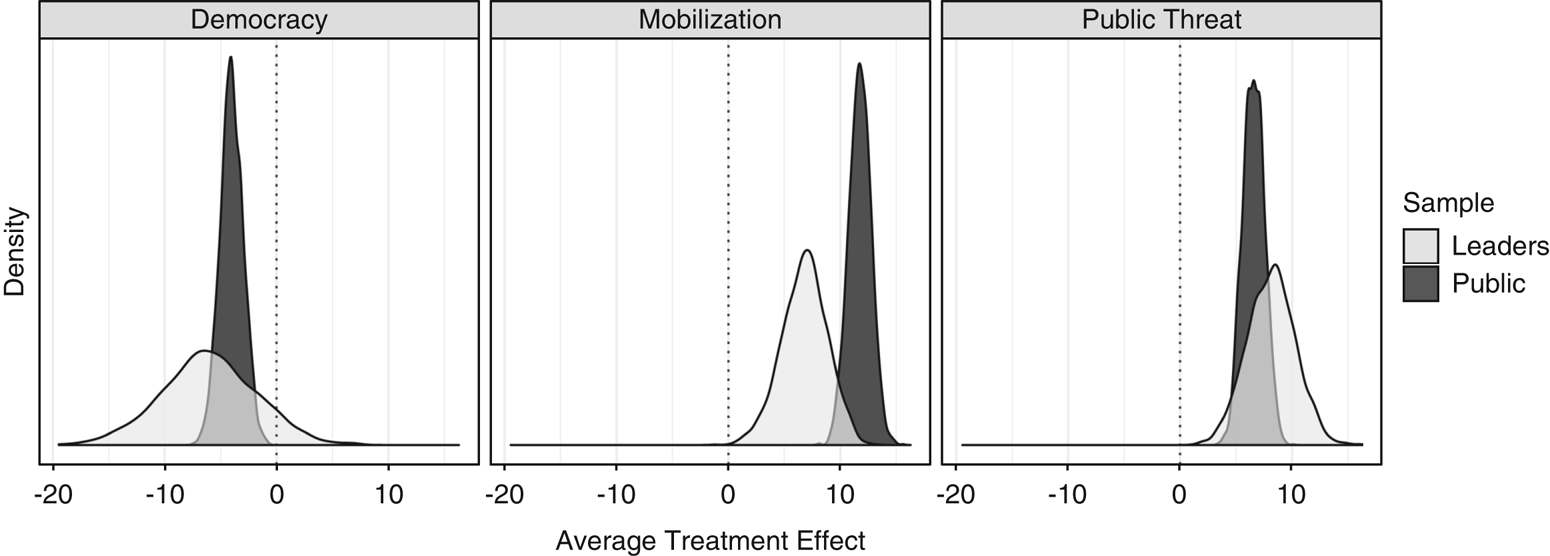
In our conjoint experiment on the US public, our respondents saw democratic states as 4 per cent less likely to stand firm than dictatorships. In the experiment conducted on Israeli Knesset members, as the bootstrapped distributions in the left-hand panel of Figure 5 shows, we obtained nearly identical results, with the elite sample perceiving democracies to be around 6 per cent less likely to stand firm than dictatorships.
Comparing our US mass public results with those from foreign decision makers Note: the figure compares the bootstrapped average treatment effects for three factors from the conjoint experiment, in dark grey (calculated using B=2,500 clustered bootstraps), with the bootstrapped average treatment effects for the same three factors in a pair of survey experiments fielded on an elite sample of members of the Israeli Knesset, in light grey (calculated using B=2,500 bootstraps). We find strikingly similar findings across the studies; mobilization is the only factor for which the effect estimates significantly differ. Although the elite distributions are fatter as a result of the much smaller sample size, supplementary analysis in Appendix 5 shows that when we downsample the public results to render the sample sizes more comparable between the two studies, the shape of the pairs of distributions becomes much more similar.

In the Costly Signals experiment, those same Knesset leaders were presented with a vignette that described a dispute between Israel and another country and asked to estimate the odds that the other country would stand firm in the dispute. After that outcome question, which functioned as each subject’s baseline estimate of resolve, all subjects then read a further text describing another version of the scenario in which the other country either made a public threat or mobilized their military. The study thus combined both within- and between-subject designs. The former comes from each subject being in both a control (baseline) and treatment condition, while the latter comes from randomly assigning subjects to either the mobilization (sinking costs) or public threat (tying hands) condition following the baseline scenario.
In our conjoint experiment on the US public, we found that countries that make public threats are perceived as around 6.5 per cent more likely to stand firm, while troop mobilizations (sunk costs) increase estimates of resolve by around 12 per cent. As the middle and right-hand panel of Figure 5 show, in our Knesset Costly Signals experiment, we once again found convergent results. Elite decision makers saw public threats as 8.1 per cent more credible than the baseline estimates of resolve, while troop mobilization increased those estimates by 6.8 per cent; of all three treatments in common between the three experiments, troop mobilization is the only one with an effect estimate that significantly differs between the US mass public sample and the Israeli elite sample, although the difference is one of magnitude rather than sign. Across both experiments, then, we find evidence that public threats and sinking costs serve important and useful functions in effectively signaling resolve to an audience of leaders and publics alike. This is not to claim that elites and masses are interchangeable, but merely to note that when we compare our experimental findings across the two samples, they are more similar than different. Like other recent elite experimental work (Hafner-Burton et al. Reference Hafner-Burton2014; Renshon Reference Renshon2015; Sheffer et al. Reference Sheffer2018), then, our results caution against a reflexive ‘elite exceptionalism’ (Kertzer Reference Kertzer2016, 160–2), in which elites and masses are assumed ex ante to employ fundamentally different cognitive architectures.
Conclusion
Much of the literature on reputation and resolve has been dominated by the question of which indicators we use to assess resolve, and whether some indicators are more salient than others. Given a strategic environment in which many indicators are available simultaneously and often lead to contradictory conclusions, observers confront difficult decisions about which indicators to focus on and which to ignore. Indeed, the myriad theories of resolve extant in IR – reputation, sinking costs, etc. – can be recast as explicit or implicit suggestions as to which cues actors rely on when forming judgements about resolve.
Conceptually, extant studies on resolve inferences cluster around two families of indicators or heuristics: behavioral indicators of resolve (in particular, the past and current crisis behavior of states) and several state-level (capabilities, interests, alliances and regime type) and leader-specific (leaders’ experience, time in office and gender) characteristics. Using a conjoint experimental design we tested the relative importance of particular behavior- and characteristic-based indicators in shaping observers’ inferences about the resolve of adversaries and allies, and in so doing, evaluated the observable implications from a wide range of theoretical frameworks across the discipline. Conjoint designs such as ours are critical here, since they allow us to sidestep many typical concerns associated with survey experiments, namely that respondents simply respond to whatever information is given to them. In our study, because so many factors were manipulated, and because our interest is in relative effects, we bypass that concern entirely. Thus our findings are less likely to merely be an artifact of our experimental design: some factors emerged as important while respondents ignored others altogether, and these patterns corroborated some widely held theories in IR, while casting doubt on others.
Our analysis allows us to distill several lessons, the first of which is that members of the American public – despite lacking specialized training, expertise or knowledge – are ‘intuitive deterrence theorists’. One striking pattern in our results was the importance of capabilities, stakes, mobilization and past actions, the four variables with the largest substantive effects: a state with high stakes in a crisis was seen as 15 per cent more likely to stand firm than one with a lower level of interest. Notably, these four factors are also the core ingredients of rational deterrence theory. Ordinary citizens, without ever having read Brodie (Reference Brodie1959) or Snyder (Reference Snyder1961), seem to intuitively carry a ‘folk’ version of deterrence theory around in their heads (Rathbun Reference Rathbun2009; Kertzer and McGraw Reference Kertzer and McGraw2012).Footnote 16 Determining why people think like deterrence theorists – whether because of socialization, or because assessing resolve resembles a basic adaptive problem in human evolution, for example – is obviously beyond the scope of this study, but two patterns are striking. First, in Appendix 1.4.1–1.4.2, we show that there is a conspicuous absence of heterogeneity in the experimental results: all types of respondents – more and less educated, hawks and doves, etc. – seem to rely on the same cues to the same extent; there is a similarly conspicuous absence of interactions between treatments, such that people seem to anchor on the same cues regardless of the particular combinations displayed. As Appendix 1 shows, there are also no signs of demand effects, in that participants’ responses are stable over time. Secondly, in Appendix 1.5, we examine changes in response times between disjunctive and conjunctive treatment assignments to demonstrate the extent to which the cues that display the largest treatment effects also seem to simplify participants’ decision process. Together, these patterns suggest the existence of a relatively ubiquitous mental model, regardless of its origin.Footnote 17
A second lesson concerns one of IR’s most important state-level attributes, regime type. Contrary to theories of democratic triumphalism, observers tend to view democracies as less resolved than dictatorships, rather than the other way around. This was the case in our mass sample of the US public as well as in our novel sample of Israeli leaders. And while first-generation work on audience costs suggested that democracies would have a distinct advantage in this method of signaling, we do not find any evidence in support of this notion. While countries are able to use public threats to increase estimates of their likelihood of standing firm – and costlier actions such as mobilizing troops are correspondingly more effective – our results favor Weeks’ (Reference Weeks2008) claim that democracies and autocracies do not differ in their ability to generate audience costs.
A third lesson concerns the critical importance of past actions. In line with the ‘confident theoretical beliefs’ of many IR scholars (Dafoe, Renshon and Huth Reference Dafoe, Renshon and Huth2014, 384) and contrary to the ‘reputation paradox’, we find strong evidence that past actions affect current estimates of resolve: they speak about as loudly as present actions. And, in keeping with other work on this topic, we find additional evidence that reputations do not attach only to the state; in fact, past actions undertaken with the same leader are more informative of current resolve than past actions taken prior to a leadership turnover (Renshon, Dafoe and Huth Reference Renshon, Dafoe and Huth2018). By leveraging our conjoint experimental design, we were also able to shed light on more complex, multi-dimensional theories of resolve and reputation. For example, we found evidence inconsistent with Press’ (Reference Press2005) Current Calculus theory of resolve: observers look to interests and capabilities as heuristics in assessing resolve, but past behavior matters as well.
While our elite experimental evidence lacked the multidimensional richness provided by the conjoint design – though they control for many of the same factors that the conjoint experiment manipulates – the results they uncover are strikingly similar not just in direction, but also in magnitude. These results cannot speak to the question of intuitive deterrence theory or the relative importance of different types of cues, but the congruence reported in the results serves as a useful corrective against the automatic assumption that leaders rely on a profoundly different cognitive architecture than ordinary citizens – a claim that merits empirical testing, rather than uncritical acceptance.
As in any experiment, some of the results we see here are likely shaped by the current international political climate: participants’ democratic defeatism, for example, reflects an era in which authoritarian states are increasingly flexing their muscles on the world stage. Yet it is similarly difficult to disentangle IR scholars’ enchantment with democratic triumphalism throughout the 1990s from the buoyant ‘end of history’ in which they were writing. In this sense, we might expect that the weight observers place on some of the factors we explore here is likely to shift over time. Future work should also explore how they shift across space. Carrying out similar analyses in other countries – at both the mass public and elite levels – is thus particularly valuable. The fact that we detect democratic defeatism among both American and Israeli respondents, begs the question of whether citizens of less democratic countries see matters similarly.
Finally, experimental designs such as this one can be particularly useful in formalizing, isolating and testing multi-dimensional theories in IR, without the concerns about endogeneity, collinearity and aggregation that IR scholars must wrestle with when they use observational data (Tomz and Weeks Reference Tomz and Weeks2013). We drew from a varied and rich literature in reputations, credibility and resolve in IR to construct our conceptual framework and employed a conjoint design in what is the most comprehensive study of these variables to date. However, it would be a shame were the feedback loop to end here. Future work might also build on our study by altering the context in other ways, such as exogenous shifts in the balance of power (corresponding to the notion of commitment problems), or manipulating other individual-level attributes of the actors involved. Another useful direction for future research on this topic – in addition to conceptual replications and extensions of this experiment – would be for the results to feed back into future case studies on assessing resolve in IR. In that way, our theories of resolve will accumulate the advantages of each particular method and data source while minimizing the harms of each method’s weaknesses.
Supplementary material
Data replication sets are available in Harvard Dataverse at: https://doi.org/10.7910/DVN/VSVMY7 and online appendices at: https://doi.org/10.1017/S0007123418000595
Acknowledgements
We gratefully acknowledge the support of the Weatherhead Center for International Affairs at Harvard University, audiences at ISA and APSA 2015, Columbia University, Georgetown University, the University of Chicago, the University of Virginia, Yale University, and Brian Blankenship, Bear Braumoeller, Allison Carnegie, Austin Carson, Dale Copeland, Alex Downes, David Edelstein, Andrea Everett, Page Fortna, Connor Huff, Robert Jervis, Egor Lazarev, Jack Levy, Anthony Lopez, John Mearsheimer, Dan Nexon, John Owen, Bob Pape, Paul Poast, Aaron Rapport, Todd Sechser, Jack Snyder, and Laila Wahedi for helpful comments, Taj Moore for research assistance, and especially Anton Strezhnev for his superb assistance. Replication data can be found at https://doi.org/10.7910/DVN/VSVMY7.