1. INTRODUCTION
Information entropy models of design processes are generally based either on formal models of designing or on a simulation of a design activity (El-Haik & Yang, Reference El-Haik and Yang1999; Summers & Shah, Reference Summers and Shah2003; Khan & Angeles, Reference Khan and Angeles2011; Krus, Reference Krus, Chakrabati and Prakash2013). They describe the stages, information, or complexity of a design process or of designed artifacts. For example, by considering the design process as a process of decreasing uncertainties of the designed artifact or increasing the information of the design artifact, Krus (Reference Krus, Chakrabati and Prakash2013) used design entropy to quantitatively describe the design process.
This paper reports on a study characterizing design processes in two design spaces through measuring the entropy of empirical data derived from protocol studies. We consider the design space as a changing space of potentialities that a designer creates as she progresses along with what design variables to consider. Some of these variables are semantically associated. We conjecture that the number of variables and pattern of associations affect the potentiality, hence the innovativeness of a design process.
Protocol analysis transforms verbal utterances and gestures captured during designing into a sequential string of symbols from a limited alphabet of symbols called codes. The sequential segments can be related to each other by examining their semantic content in a process called linkography, producing a design session's linkograph; a linkograph is claimed to be able to capture the design process (Goldschmidt, Reference Goldschmidt2014). Shannon's entropy (Shannon, Reference Shannon1948) is a measure of information based on the probability of occurrences of events. From a linkograph, it is possible to compute the probabilities of the connectivity of each segment for its forelinks and its backlinks, together with the probabilities of distance among links. We conjecture that a linkograph's entropy, a measure of the information of this probability of connection, will be able to characterize a design session quantitatively. Entropy has been used to as a way to characterize design fixation (Gero, Reference Gero2011), because entropy drops indicate a decrease in potential in the design space. In this paper we examine entropy's connection to characterizing innovative processes in design space.
In the classic paradigm of viewing designing as problem solving (Simon Reference Simon1969), the notion of design problem space is defined by states, operators that move the design from one state to another and evaluation functions that assess the design solution state. In Schön's (Reference Schön1983) reflection-in-action paradigm, designers under a situation name and frame those factors/issues, and make moves to provide a solution, and then evaluate the moves. Dorst (Reference Dorst2015) suggested framing is the key to design abduction and reframing is the key to achieving innovative solutions. In this paper we consider innovative processes and creative activities as synonyms. We use the reflection-in-action paradigm and consider the actions of naming, framing, moving, and evaluating define the design space by introducing variables. The design space cannot be predicted and is situational; however, post facto measurement can be carried out on extant designs. We conjuncture that the vocabularies in a design protocol contain information on the naming and framing of their design space, and the linkographs of the protocol comprise the characteristics of the design space shaped by moves and evaluations.
The paper is structured as follows. A brief introduction to entropy is provided along with an example of its use in text analysis. This is followed by an outline of the two design sessions that form the basis of the case study. A qualitative analysis of the two design sessions is presented. Linkographs and linkograph entropy are described. The linkograph entropy and text entropy of each of the two design sessions is calculated and compared and conclusions drawn.
2. INFORMATION AND ENTROPY
Claude Shannon, the developer of information theory, suggested a measure of information associated with a communication source called entropy (Shannon, Reference Shannon1948). He suggested that the amount of information carried by a message is based on the probability of its occurrence. If there is only one possible outcome, then there is no need to communicate additional information because the outcome is known. To illustrate this with a simple example, consider transmitting a piece of information consisting of 10 ON|OFF signals and 1 of them is OFF but the others are ON. The probability of an OFF symbol, p(OFF), is 0.1, and the probability of an ON symbol, p(ON), is 0.9. Consider the following two cases:
-
1. If the first signal the receiver gets is an OFF symbol (p = 0.1), then no further transmission is required as the following signals carry no additional information. This, a stochastic process, assumes that the receiver knows the total number of signals (10), the probabilities of the symbols (ON/OFF), and that the total probability equals 1 (p(ON) + p(OFF) = 1).
-
2. If the first signal being transmitted is an ON symbol (p = 0.9), then the receiver is uncertain of the value of the next signal. Transmission is still required to complete the information.
Shannon derived the entropy H, the average information per symbol in a set of symbols with a priori probabilities, as
 $$H = - \sum\limits_{i = 1}^n {\,p_i \log (\,p_i )\quad{\rm with}\quad H =} \sum\limits_{i = 1}^n {\,p_i = 1}\comma $$
where p i are the probabilities of occurrence of each symbol.
2.1. Entropy of protocol strings: Vocabulary richness in framing the design space
In the study of language, text entropy had been seen as a measure of vocabulary richness (Dale et al., Reference Dale, Moisl and Somers2000). Torres (Reference Torres2002), using Eq. (1), defined the entropy of a text T with λ words composed from n different words by
 $$H_{\rm T} (\,f{_1\comma \,} \ldots\comma \; f_n ) = \displaystyle{1 \over {\rm \lambda}} \sum\limits_{i = 1}^n {\,f_i [{\rm log}_{10} ({\rm \lambda} ) - {\rm log}_{10} (\,f_i )]}\comma \, $$
where f i i = 1, … , n, is the frequency of each i-word in the text T.
In this equation, with the same number of words in a text, a higher variety of words will yield a higher text entropy. To compare texts with different numbers of words λ, a kind of “relative entropy” H rel is introduced. It is defined as the quotient between the entropy H T of the text and the maximum entropy H max , multiplied by 100 to turn it into a percentage:
 $$H_{{\rm rel}} = \displaystyle{{H_{\rm T}} \over {H_{\max}}} \times 100.$$
The maximum entropy H max occurs when the text has all different words, that is, the entropy of a text with the same number λ of words in which each word occurs only once (i.e., n = λ, f i = 1). With Eq. (1) it becomes
 $$H_{\max} = \displaystyle{1 \over {\rm \lambda}} \sum\limits_{i = 1}^n {1[{\rm log}_{10} ({\rm \lambda} ) - {\rm log}_{10} (1)] = {\rm log}_{10} ({\rm \lambda} )}.$$
Text entropy has been used to examine vocabulary richness of poetic text (Popescu et al., Reference Popescu, Lupea, Tatar and Altmann2015).
Popescu et al. (Reference Popescu, Lupea, Tatar and Altmann2015) calculated the text entropy of 146 of Eminescu, the Romanian poet's, poems (https://ro.wikisource.org/wiki/Autor:Mihai_Eminescu). “Entropy is maximal if all entities have the same frequency of occurrence. But in that case of vocabulary richness of the texts is also maximal” (p. 147). They suggested that entropy “can textologically be interpreted as measures of vocabulary richness” (p. 148).
3. TWO DESIGN SESSIONS
In this study, data were obtained from a CRC for Construction Innovation project (http://www.construction-innovation.info/). In that project, in vitro studies were conducted with five pairs of architect designers, and each pair was given three design tasks (of the same level of complexity and abstraction), one each in three different collaboration settings: face-to-face, Internet shared drawingboard, and three-dimensional (3-D) virtual world (15 sessions in total). One objective of the original study was to investigate the impact of virtual environments on design behavior (Maher et al., Reference Maher, Bilda, Gül and Gero2006). They found that the designers switched between problem and solution spaces more frequently in the face-to-face settings. The same designers focused more on object synthesis and visually analyzing the representation in the 3-D virtual world. In this paper two face-to-face sessions, with different characteristics, were used. In both sessions, the designers were asked to design a contemporary art gallery. They were given 30 min to generate a conceptual design. Judging by the design outcomes, a creative and productive session (Session A) was selected together with a less productive and pragmatic session (Session B) for this exploration.
3.1. Qualitative analysis of the two sessions
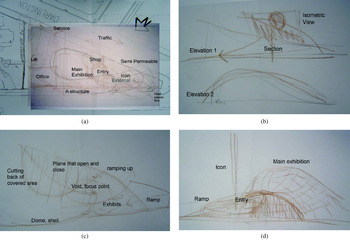
The more productive design session, Session A, can be divided into four stages or episodes, based on the design activities recorded in it. In the first episode, the two designers dealt with the requirements and site (about 3.5 min); in the second episode, they analyzed, planned, and developed concepts in the plan, Figure 1a (total time about 9 min); in the third episode, they developed the 3-D form in elevation, Figure 1b–d (about 9 min); and in the fourth and final episode, they worked on the layout in the plan until the end (the remaining 8.5 min), but they did not finish it within the 30 min allocated for the session. They produced six sheets of drawings, which was the highest number of sheets in terms of design output of all design sessions. This session has been qualitatively assessed as a creative session with an innovative solution by the panel of researchers that contained architectural educators and design researchers.
Drawings and sketches from design Session A. (a) The first two sheets of drawing. (b) Section, elevation, and three-dimensional view of the proposed gallery. (c) The plan of an organic shaped building. (d) Elevation of the gallery.

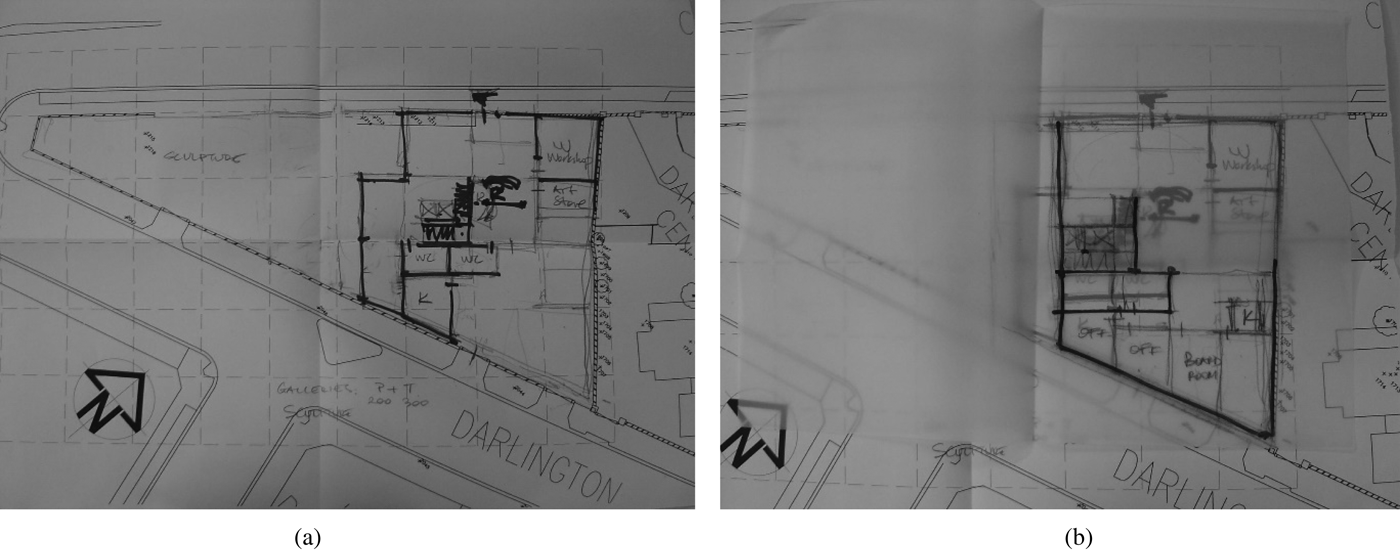
In Session B, the designers only worked on the plan. They spent about 4 min studying the brief without verbalizing, and then used another 5 min understanding the required areas in relation to the site coverage; in particular, the location of the external exhibition. At about 10.5 min they discussed the location of the cafe and kitchen. At around 14 min into the session, one designer found that the cafe was not in the requirements. The locations of service dock, entrance, workshop, and store were discussed; Figure 2a. At around 17 min, the location of the entrance along with its glazing was proposed. After that they worked out the location of stairs, toilets, and offices together with its size in the second level; Figure 2b. They did not finish the design in the time allocated. This session was qualitatively assessed, by the same panel used to assess the results of Session A, as a pragmatic session. We conjecture that the text entropy of the more creative and productive session's protocol will be higher than that of the pragmatic session.
(a) Ground-floor plan and (b) second-floor plan of Session B.

3.2. Text entropy of the two sessions
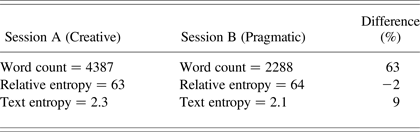
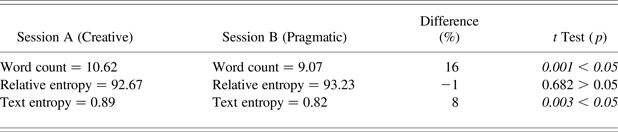
Table 1 shows the results of the relative text entropy and the text entropy from measuring the transcripts of the design protocol of the two sessions. Comments by transcriber such as “Inaudible” were removed, as were utterances by the experimenter. The main directly observable difference between the two design sessions' transcriptions is the word count. Both sessions have very similar (2% difference) relative entropies, and the creative session has a slightly higher text entropy (9% difference).
The word count, relative entropy, and text entropy of the two sessions

These results suggest that text entropy and relative text entropy of the design protocol might not be able to be used to characterize differences between the two qualitatively different design sessions.
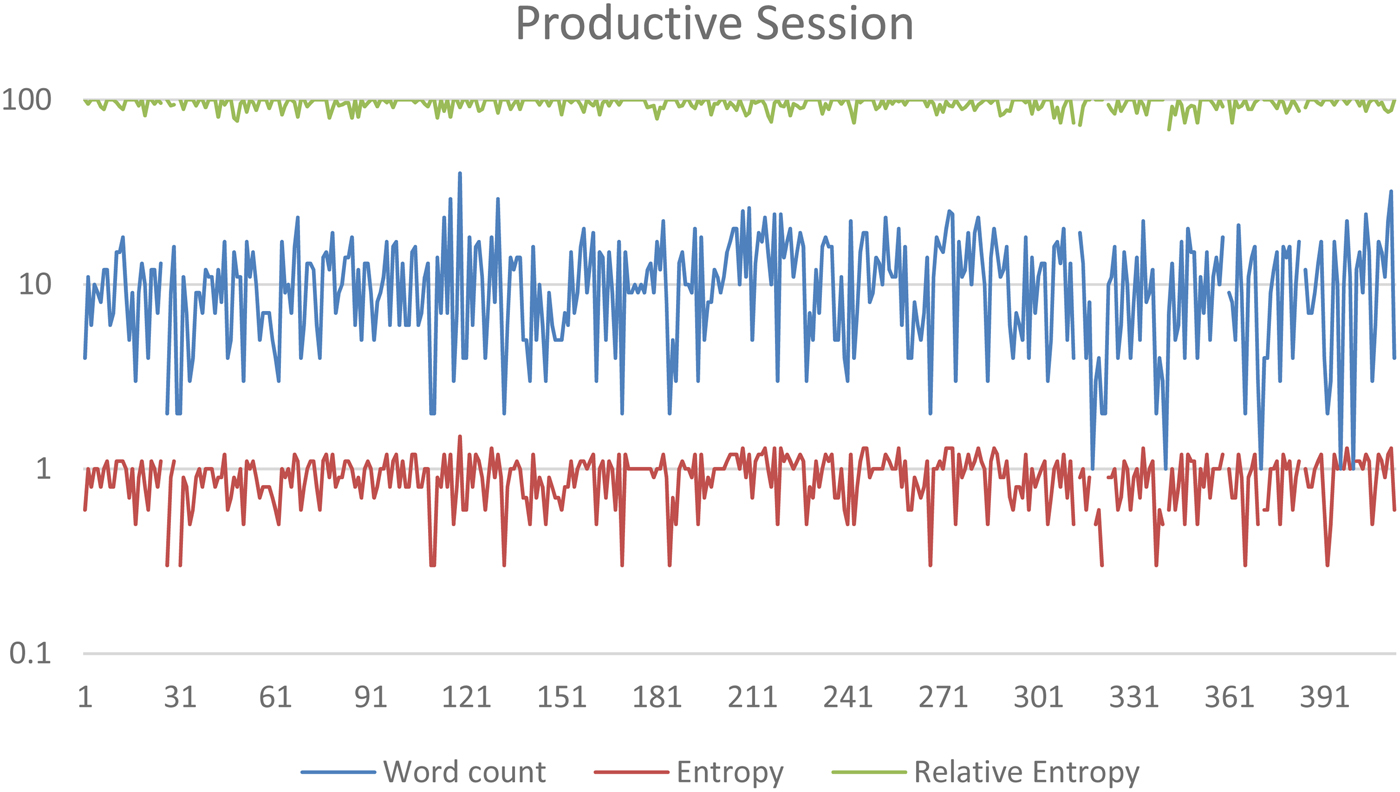
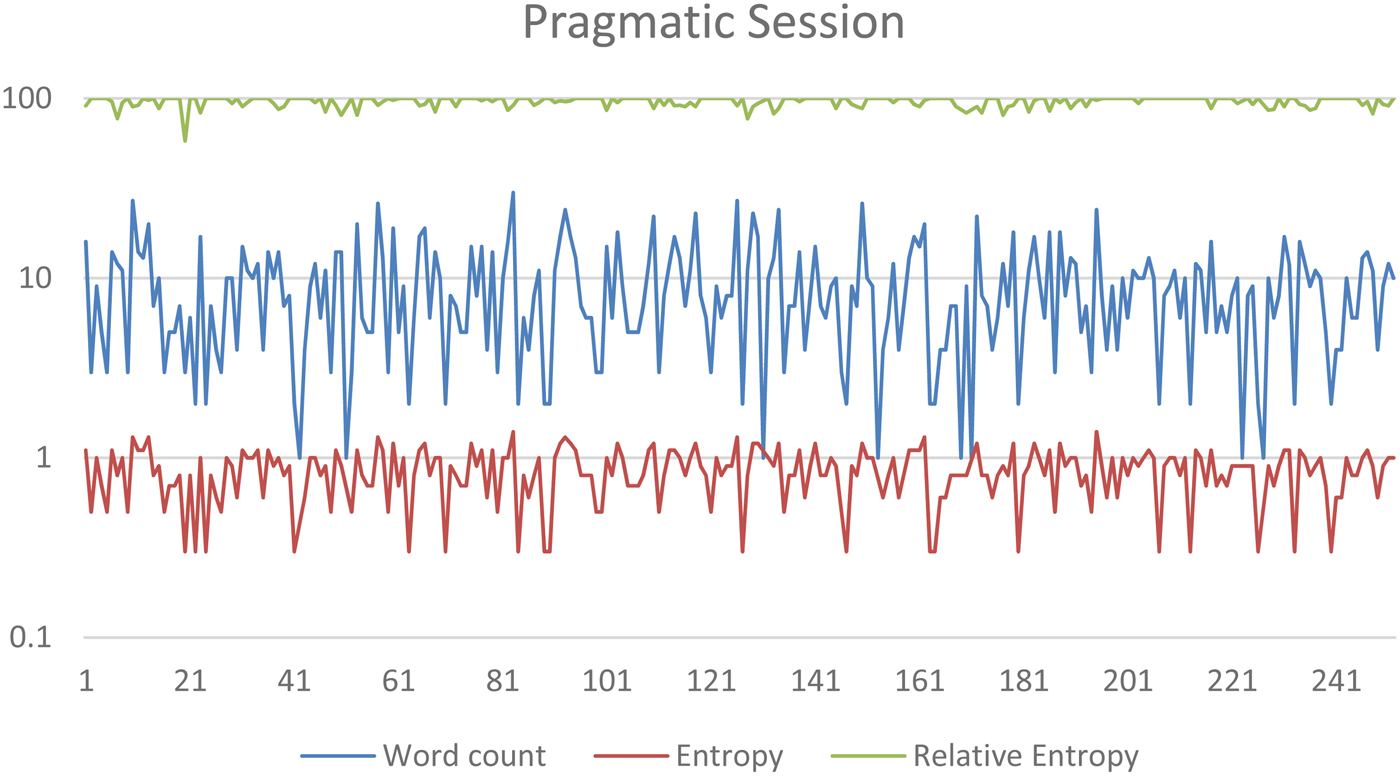
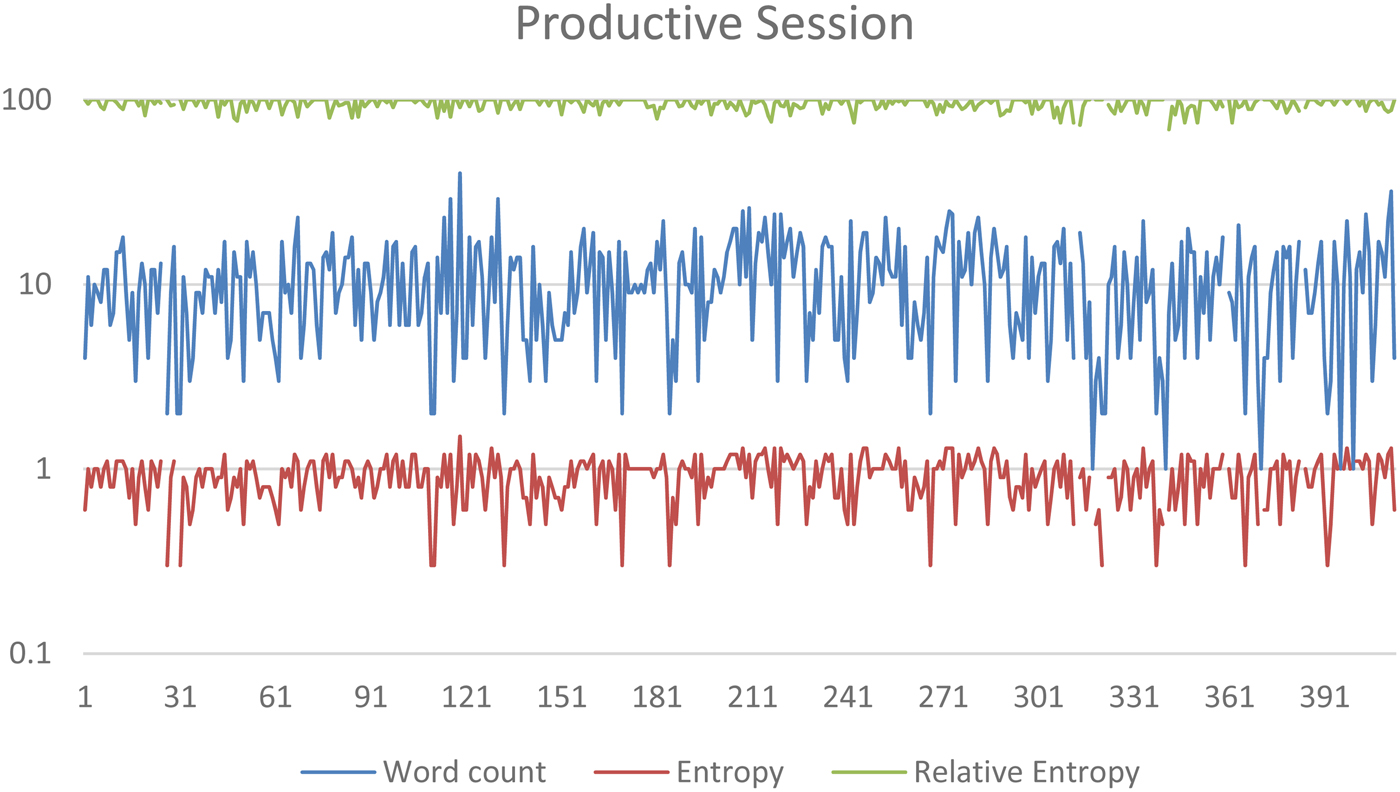
We then use turn taking and pauses to segment the design protocol. We counted the words in a segment and calculated the entropy and relative entropy of each segment of the two sessions. The variations of the relative text entropy, entropy, and the word count are shown in Figures 3 and 4. The log10 scale is used in the vertical axis. In the creative session, there were 11 segments that had zero entropy because they either had one word like “maximum” or numbers like “1400” or repeated words like “no, no”; there were 8 such incidences in the pragmatic session. These “zero” value data point were not displayed in the logarithmic scale. Apart from the density of the data points (the creative session has more segments), no differences in patterns were observed. Table 2 summarizes the average word count, relative text entropy, and text entropy of the two sessions together with the percentage differences and the two-tailed t test probabilities. The significant differences are the word count per segment (16%) and the text entropy (8%). However, the relative text entropy does not differentiate the two sessions.
Relative text entropy, entropy, and the word count of the creative session.
Relative text entropy, entropy, and the word count of the pragmatic session.

The per-segment average word count, relative entropy, and text entropy of the two sessions

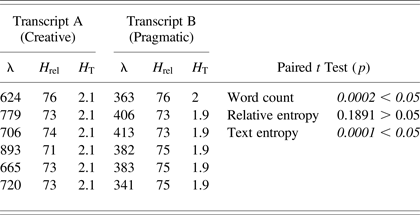
To further investigate, we divided the design protocol into six equal portions. This divides Session A into six 69-segment sextiles and Session B into six 42-segment sextiles. This is approximately 5 min per sextile. The intention is to examine if there are any regularities within a session and compare the two sessions through this lens. The word counts, entropy values, and the paired t test results are tabulated in Table 3. Again, there are significant differences in the word counts and text entropy but not in relative entropy. The conjecture of using vocabulary richness as a measure of the naming and framing variables for innovative processes in a design space is not supported by the evidence from this case study.
The word count, text entropy, and relative entropy of the two sessions subdivided into six sextiles

4. ENTROPY OF LINKOGRAPHS
4.1. Linkography: Sematic connections shaping the design space
Linkography, which is a technique used in analyzing design protocols, has been reported to reveal the quality of a design process (Goldschmidt, Reference Goldschmidt and Kaley1992, Reference Goldschmidt1995) and the creativity of the ideas (van der Lugt, Reference van der Lugt2003; Goldschmidt & Tatsa, Reference Goldschmidt and Tatsa2005). A linkograph is constructed by breaking design protocols into smaller units called a “move” or “segment” (we will refer to them as moves) and then connecting them by a coder using domain knowledge and commonsense. Sequential “moves” are placed along the horizontal axis. When two “moves” are related, they are joined by a “link.” The second column of Table 4 shows some examples of linkographs. The design process can then be examined in terms of the patterns of move associations. Goldschmidt (Reference Goldschmidt and Kaley1992) identified two types of links: backlinks and forelinks. Backlinks are links of moves that connect to previous moves. Forelinks are links of moves that connect to subsequent moves. Conceptually, forelinks and backlinks are very different. “Backlinks record the path that led to a move's generation, while forelinks bear evidence to its contribution to the production of further moves” (Goldschmidt, Reference Goldschmidt1995, p. 196). Link index and critical moves are measures devised as indicators of design productivity. A link index is the ratio between the number of links and the number of moves. Critical moves are design moves that are rich in links (Goldschmidt, Reference Goldschmidt and Kaley1992, Reference Goldschmidt1995). Design productivity is positively related to the link index and critical moves; higher values of link index and critical moves indicate a more productive design process. Later, Goldschmidt and Tatsa (Reference Goldschmidt and Tatsa2005) provided empirical evidence that quality outcomes, creativity, hinge on good ideas or what she called critical moves. Der Lugt (Reference van der Lugt2003) used the same method, with some extensions to trace the design idea generation process and empirically verified the correlation between creative qualities of ideas and the good integratedness of those ideas.
The symbols used to represent a four segment linkograph

4.2. Linkograph entropy
Kan and Gero (Reference Kan, Gero and Bhatt2005) proposed an approach, based on Shannon's information theory, to measure the information in linkographs. They suggested that a rich idea generation process is one where the structure of ideas is well integrated and articulated, and there are a variety of moves/segments connections. They argued that an empty linked linkograph can be considered as a nonconverging process with no coherent ideas, and a fully linked linkograph represents a fully integrated process with no diversification. For an n-segmented linkograph there will be n symbols, {ϕ, S 2–S 1, S 3–S 1, … , S n –S 1}; Table 4 shows the symbols used to represent a four-segment linkograph.
Later Kan and Gero (Reference Kan and Gero2008) suggested another method to measure entropies based on the conceptual difference between forelink and backlink. They calculated the entropy of each segment in rows, within the rectangles of Figure 5a and b, according to “linked” or “unlinked.” Horizonlink, in Figure 5c, carries the notion of distance/time between the linked moves.
Abstracted linkograph for entropy measurement, back dots denote “linked” between moves and gray dots denote “unlinked.” (a) Measuring entropy of forelinks of each row, (b) measuring entropy of backlinks of each row, and (c) measuring entropy of horizonlinks (Kan & Gero, Reference Kan and Gero2008).

Using “linked” and “unlinked” as the symbols, the probability of “linked,” p(linked), will be the frequency (or number) of “linked” nodes divided by the total number of nodes in that row. Similarly, the probability of “unlinked,” p(unlinked), will be the number of “unlinked” nodes over the total number of nodes in that row.
There are only two symbols, putting their probabilities in Eq. (1), the entropy of each row becomes
 $$\eqalign{& - p(linked)\hbox{Log}\lpar {\,p(linked)} \rpar {\rm} - p\lpar {unlinked} \rpar \hbox{Log}\lpar {\,p(unlinked)} \rpar \comma \cr & \quad\quad\quad\quad\quad\quad\quad\quad\quad\quad\ \hbox{where}\,p(linked) + p(unlinked) = {\rm} 1.} $$
Kan and Gero (Reference Kan and Gero2008) suggest that “forelink entropy measures the idea generation opportunities in terms of new creations or initiations. Backlink entropy measures the opportunities according to enhancements or responses. Horizonlink entropy measures the opportunities relating to cohesiveness and incubation.”
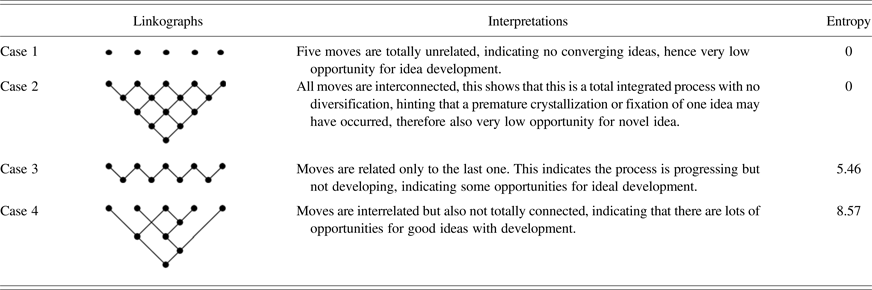
Table 5 shows four hypothetical cases with five design moves together with their cumulative entropies. The cumulative entropies are the summation of forelink, backlink, and horizonlink entropies of all rows.
Hypothetical linkographs, their interpretations, and their entropies (Kan & Gero, Reference Kan and Gero2008)

5. CONSTRUCTING LINKOGRAPHS WITH WORDNET
Linkography has been criticized for its lack of objectivity in the construction of links, which is primarily based on the discernment and interpretation of the coders. The process of constructing a linkograph is very time-consuming and cognitively demanding (Kan, Reference Kan2008), making it difficult and impractical to construct very large data sets to study and compare. Some coders utilize a search function to help finding “moves” with similar semantic contents (Bilda, Reference Bilda2006). We propose an automated method for the construction of linkographs by connecting “moves” using the English lexical database WordNet (Fellbaum, Reference Fellbaum1998). WordNet uses the concept of cognitive synonym (synset) to group words into sets. Words within a synset are connected by meaning. Synsets are also interlinked by means of conceptual–semantic and lexical relations. Synset IDs are assigned to every word. That is, words in the same synset share the same synset ID. As a word can have more than one meaning, it can belong to more than one synset and hence several synset IDs. For example, the word “surface” contains 10 synset IDs and 6 of them belong to the noun group.
A program was written to consult WordNet 3.0 to find the synset IDs of all the nouns of each segment. Only nouns were used in this study because adverbs and adjectives may produce undesirable links. For example, not only would all the segments that contain the adverb “on” be linked but also they would be linked to those with the adverb “along.” Another program was written to connect the segments.
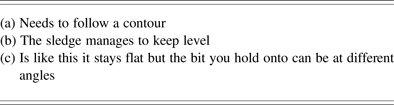
To illustrate the algorithm, we use three segments (Table 6) from the protocol of the DTRS 7 engineering session (McDonnell & Lloyd, Reference McDonnell and Lloyd2009; Kan et al., Reference Kan, Gero, Tang and Gero2010). It concerned creating a new thermal printing pen; the context of these three segments was to draw analogies from other sources that generate ideas for keeping the print head in contact with the media with an optimum angle despite users' wobbly arm moment. Segment (a) is 11 segments distant from Segment (b), and Segment (b) is 18 segments distant from Segment (c).
Three selected protocol segments from the engineering session of DTRS 7

In WordNet a synset ID is assigned to every word, and words in the same synset share the same synset ID. As a word can have more than one meaning, it can belong to more than one synset and hence several synset IDs. In the database, each word has an entry by the six-place predicate:
 $$\eqalign{& {\rm s(synset\_ID}\comma \, {\rm w\_num}\comma \, \hbox{`}\hbox{word}\hbox{'}\comma \, \cr & \quad {\rm ss\_type}\comma \, {\rm sense\_number}\comma \, {\rm tag\_count}).} $$
The synset ID encodes information about the syntactic category of the synset. The synset ID starting with 1 contains only nouns, 2 stores the verbs, 3 denotes the adjectives, and 4 denotes the adverbs. The meaning and usage of the other predicates will not be discussed here as they are not used in this work.
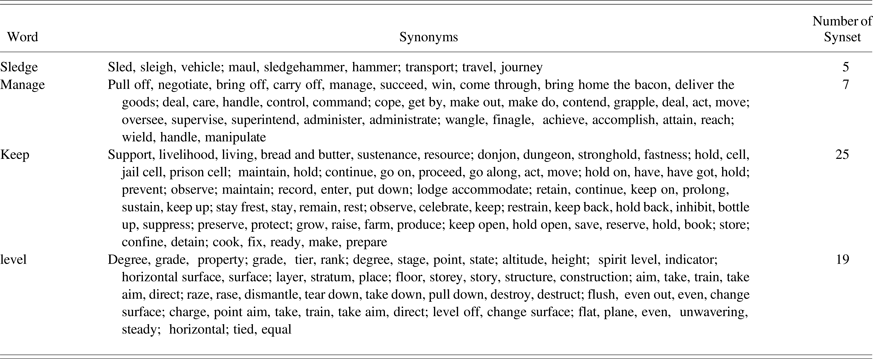
Table 7 shows protocol segment (b) with all its synonyms and number of synset sets the words belong to, in this example we use noun, verb, and adjective but without adverb. We can observe that the list of synset IDs is shorter than the list of synonyms.
The synonyms and synset ID of Segment (b)

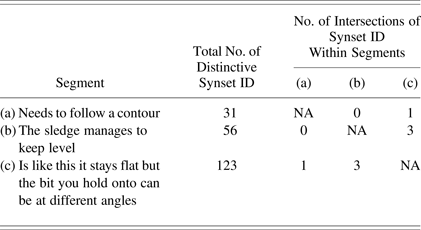
Our algorithm contains two main parts. The first part uses a loop querying WordNet database to get a list of synset ID for each word in a segment and then unites those lists; this list contains nonrepetitive distinct sysnset ID. A second loop is used to get the union list of synset ID for each segment; column two of Table 8 shows the total number of synset IDs of their corresponding segment.
The Synset ID list of the three segments

The second part of the algorithm loops through all the segments to find intersecting elements (same synset ID). In this example, Segments (a) and (c) have the one intersecting synset ID with the set of words [follow, be]. Segments (b) and (c) have three intersecting synset IDs, which are the words: [hold, keep], [keep, maintain hold], and [flat, level, plane].
In this three-segment example, there are seven different linkographs possibilities. A human coder might produce (a)–(b) and (b)–(c) links but the WordNet synonym sets produce (a)–(c) and (b)–(c) links; however, they will produce the same entropy.
The above example connects “nouns,” “verbs,” and “adjectives”; however, in this study we explore connecting only the nouns as this produces a uniform bias across all results, which allows them to be directly compared. In addition, a condition was added to only connect segments with four or more common synset IDs. This was to account for unwanted associations. For example, although WordNet ignores pronouns, “I” in WordNet has the noun meaning of iodine, one, single, and unity. We do not want to link segments with only the connection to “I.” Similarly, we do not want to link the segments with the words “here,” “there,” “why,” and so on.
6. LINKOGRAPH ENTROPY OF THE TWO SESSIONS
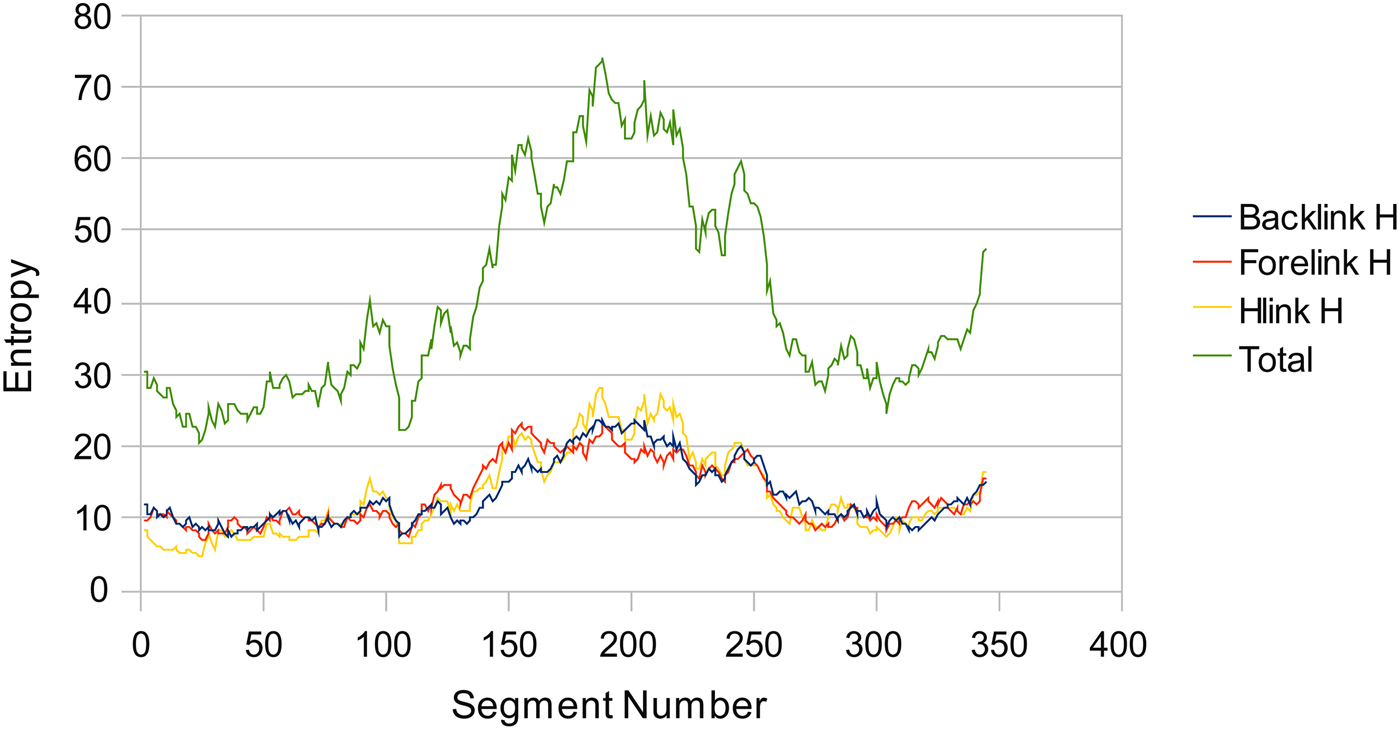
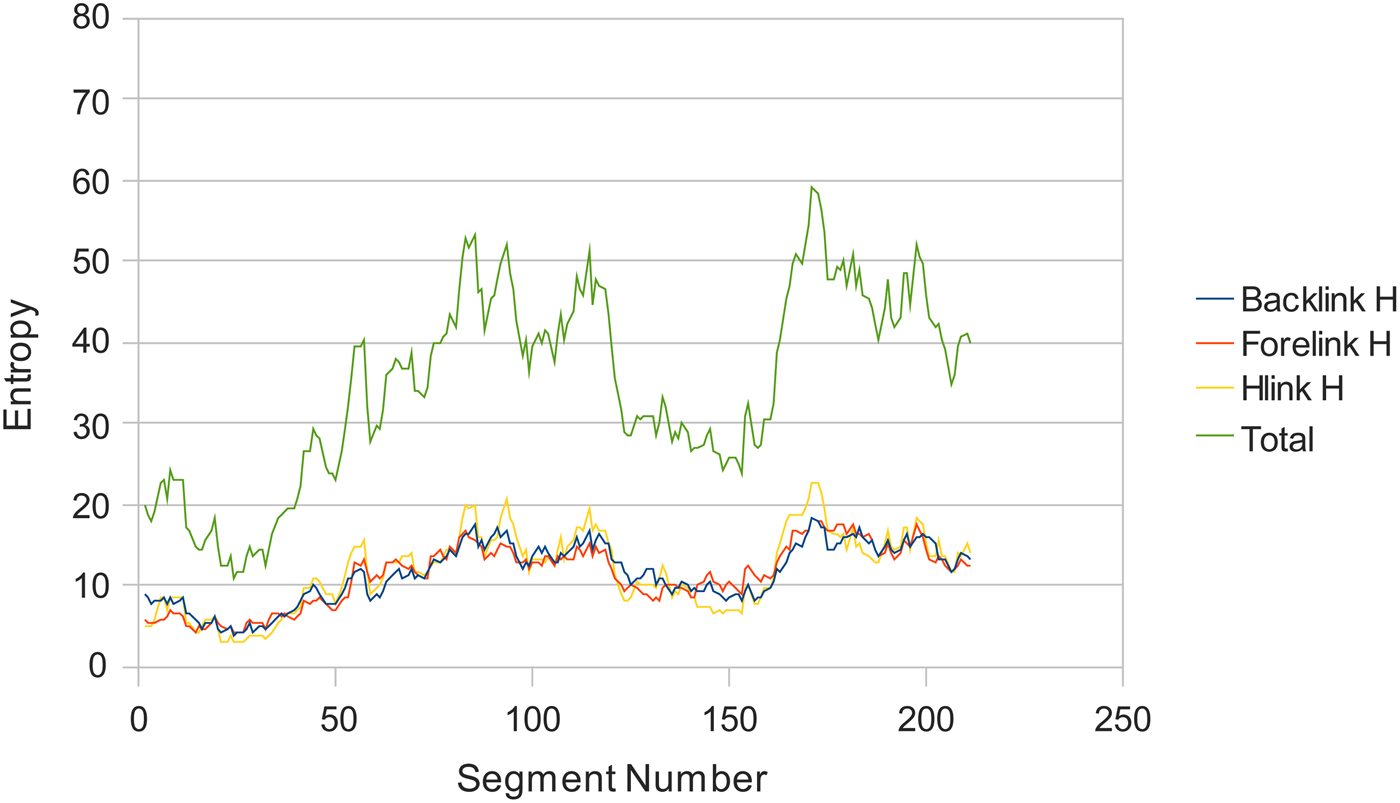
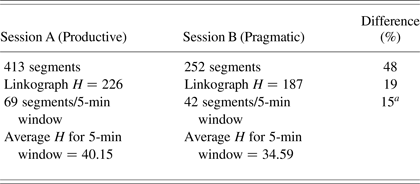
The entropies of the linkographs, produced by using Eq. (6), of the productive session and the pragmatic session are 226 and 187, respectively. The productive session has much higher entropy than the pragmatic session (about 19%). We further examine the dynamic variation of entropy during the session. Figures 6 and 7 show the variation of entropy with segment numbers of the two sessions. We normalized the results using the 69- and 42-segment window as the division to measure the text entropy. Assuming the segments were equally distributed, this results in a 5-min window. The average entropies of this 5-min window of the creative and pragmatic sessions are 40.15 and 34.59, respectively. Table 9 summarizes the results of the entropic measurements.
Variation of entropy of the creative session normalized using a 5-min, 69-segment window.

Variation of entropy of the pragmatic session normalized using a 5-min 42-segment window.

Linkograph entropy of sessions

a With t test, p = 0.0000 < 0.001.
7. RESULTS
According to our hypothesis, a higher entropy indicates more creativity. In the productive/creative session, Session A, the entropy peaks at segment 189 (entropy = 73.84). The entropy stays above 60 from segment 178 to 222. Segment 178 was the time that the designers started to draw Figure 1b. The entropy measured at segment 222, with a 69-segment window, covered segments until segment 291. This period, 114 segments, resembles the third episode when they drew Figure 1b–1d. In this period, they discussed new ideas and proposed shapes such as the idea of a ribbon, a triangular prism with a hole in the middle, a focus to grab attention, ramps to go to the roof, rediscussed inside–outside relationship, and the details of the plan and the section of the proposed building. In this episode, they produced three sheets of drawing out of a total of six here.
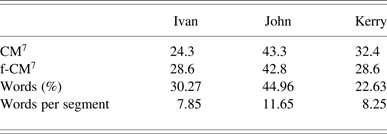
Despite the large difference in word counts between the two sessions (4,387 vs. 2,288), the text entropies are very close. Table 10 shows a word count study of the team protocol data from the 1994 Delft Protocols Workshop (Cross et al., Reference Cross, Christiaans and Dorst1996) that was used to compare with a previous study (Goldschmidt, Reference Goldschmidt1995) that indicates creativity. It summarizes the percentage of three product design engineers' (Ivan, John, and Kerry) critical moves with seven links (CM7) and forward link critical moves with seven or more links (f-CM7); f-CM7 was believed to indicate creativity (Goldschmidt, Reference Goldschmidt1995).
Comparing critical moves and word counts of three individuals from study described in Goldschmidt (Reference Goldschmidt1995)

With these word count studies, one is tempted to conjecture that there is a relationship between the numbers of words in the utterances and the number of design ideas. However, if a designer repeatedly verbalizes the same idea over and over, it will not contribute to the productivity and creativity. Therefore, word counts of design protocol alone might not be a reliable measure of productivity and creativity.
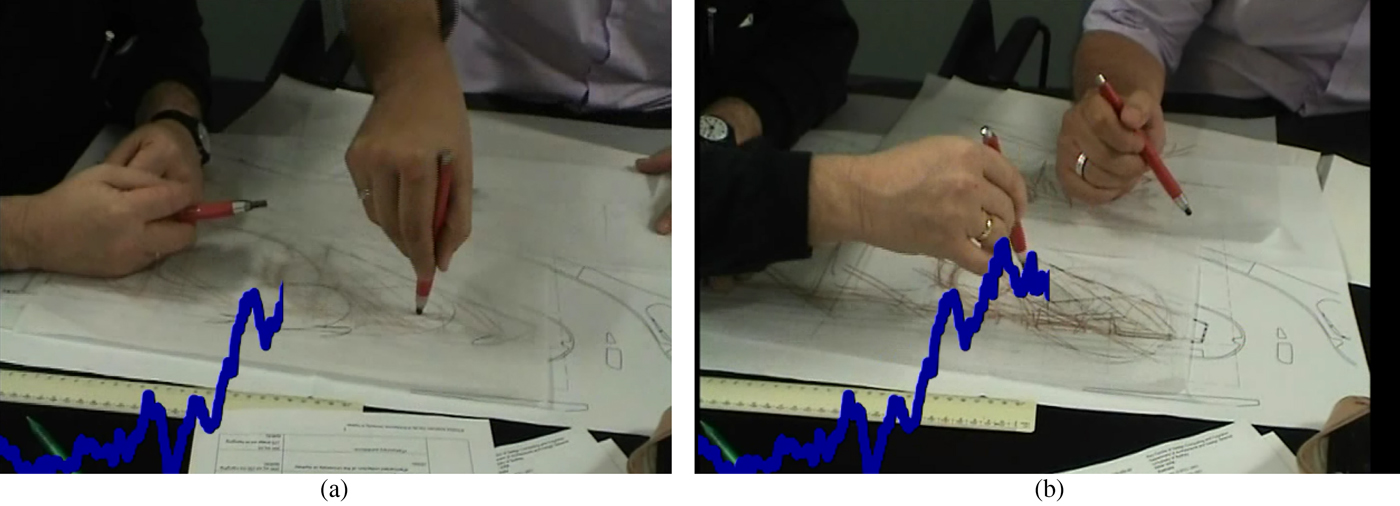
The productive, creative, session not only has a higher word count but also has a higher linkograph entropy than the pragmatic session, 226 against 187. The difference is about 19%. We also measured the entropy with a window of 5 min; the creative session has 345 windows and the pragmatic session has 211 windows. The average entropies of this 5-min window of the creative session and the pragmatic sessions are 40.15 and 34.59, respectively. The difference is about 15% (with very high confidence of the difference), which is less than the differences in the word count. However, if we look in more detail into the creative session, the period of the highest entropy (segment 178 to 291) was the most productive episode. They produced three sheets of drawings (out of six) within this period (about 8 to 9 min), and as a consequence of these drawings the session was identified as the most creative session. This measurement matches well with the qualitative analysis. When we compare this productive period with the word count, Figure 3 and Table 3, the word count of this period falls into the third and fourth row of Table 3. Although the words per segment in this period (114 segments) is 12.9, which is higher than the average, the variations of word counts and text entropy in Figure 3 do not reflect these differences. However, the entropy variation correctly identified the productive/creative period. Figure 8 shows the entropy variation graph overlapped with the video; Figure 8a and Figure 8b were captured around segment 178 and 222, respectively. In this case study the entropy of the linkograph of the creative session is higher than the pragmatic session; the entropy variation graphs help to identify the creative/productive period of a session that characterizes design processes.
Entropy variation graph overlaid on the video: (a) frame-grabbed around segment 178, and (b) frame-grabbed around segment 222.

8. CONCLUSIONS
The research reported in this paper focuses on measuring design information in a specific way. Information measured here is abstracted from the network of connected thoughts of the designers. We are not measuring the exchange of information required by different parties of a design team to complete their tasks (Tribelsky & Sacks, Reference Tribelsky and Sacks2010).
The exploration of design information and cognitive processes started in the 1960s. Eastman (Reference Eastman1968) used protocol analysis to investigate the processing of information in design. He suggested that “the structure of information used in design” were highly interdependent with the memory retrieval techniques for searching information. He also conjectured that “retrieval techniques for human memories” “may turn out to be one of the most significant variables influencing creative design capabilities” (Eastman, Reference Eastman1968, p. 80).
Linkography is based on the concept of connectivity of protocol segments; Kan and Gero (Reference Kan, Gero, McDonnell and Lloyd2009) considered the connected links in a linkograph represent design processes such as formulations (naming and framing), synthesis (moving), reformulations (reframing), analysis (a kind of evaluation), and evaluations. We postulate that these design processes, derived from the linkograph, capture the vocabulary richness in the segments and define the design space.
Designing involves the designer deciding either explicitly or implicitly what variables to consider. In doing so, she creates a space of potentialities: the design space. If that space can be structured suitably, it becomes possible to measure that potential. By treating the linkograph obtained from empirical data from protocol analysis as a structured design space (a graph), it is possible to use information theory to calculate its entropy. This quantitative information allows for the characterization of the creative activity in a design session; activity that is usually distinguished only qualitatively. The linkograph entropy provides us another layer of information about empirical data that otherwise is not obvious. The results presented in this paper indicate the possibility of using an entropic measure to characterize creative/innovative processes during the design process within a design space.
With current voice recognition technology, it is becoming possible to directly transcribe a design protocol from real-time recording. This transcription can then be segmented based on activities (such as turn taking and pauses) and syntax connecting words (such as because or therefore). As the construction of linkograph and the calculation of entropy are all automated by using WordNet and programs, it may shortly be possible to produce a near real-time entropy graph. This graph can be used as a potential indicator of creative activity during the design process. Based on the results in this case, the notion of using a linkograph to characterize design spaces and the method of automating the process are worthy of further study.
ACKNOWLEDGMENTS
Case data was obtained from the CRC for Construction Innovation project Team Collaboration in High Bandwidth Virtual Environments (http://www.construction-innovation.info/). This research is supported in part by grants from the US National Science Foundation (CMMI-1161715 and EEC-1463873). Any opinions, findings, and conclusions or recommendations expressed in this material are those of the authors and do not necessarily reflect the views of the National Science Foundation.
Jeff Kan is an Independent Scholar. He previously taught architecture design studio and building information modeling at City University of Hong Kong and was the Deputy Dean of the School of Architecture, Building and Design, Taylor’s University, Malaysia. He completed his PhD in design computing and cognition at the University of Sydney. During his study, he was awarded an International Postgraduate Research Award by the Australian Department of Education to undertake his PhD. His study focused on developing and using quantitative methods to study the cognitive behavior of designers. In earlier times he taught design studio and computer-aided design at the Department of Architecture, Chinese University of Hong Kong. Dr. Kan has published papers on architectural visual information systems, online interactive teaching materials, architectural visual impact studies, protocol analysis of designers, and methods to study design activities.
John S. Gero is a Research Professor in computer science and architecture at the University of North Carolina, Charlotte, and a Research Professor at the Krasnow Institute for Advanced Study, George Mason University. Formerly he was Professor of design science and Co-Director of the Key Centre of Design Computing and Cognition at the University of Sydney. He is the author or editor of 52 books and over 650 papers and book chapters in the fields of design science, design computing, artificial intelligence, computer-aided design, and design cognition. He has been a Visiting Professor of architecture, civil engineering, cognitive science, computer science, design and computation, or mechanical engineering at MIT, University of California–Berkeley, University of California Los Angeles, Columbia University, and Carnegie Melon University in the United States; at Strathclyde and Loughborough in the United Kingdom; at INSA-Lyon and Provence in France; and at École polytechnique fédérale de Lausanne in Switzerland. Dr. Gero’s current and recent research funding has been from the National Science Foundation, Defense Advanced Research Projects Agency, and NASA. He is the Chair of the international conference series Design Computing and Cognition and the Co-Editor-in-Chief of the new international journal Design Science.