INTRODUCTION
Relative sea-level (RSL) changes in the Middle and Late Holocene had significant geological consequences in the northern Arabian/Persian Gulf (hereafter called “the Gulf”), including in Kuwait. Transgressive beach ridges, described by Reinink-Smith (Reference Reinink-Smith2015), formed along Kuwait Bay during a sea-level rise that culminated in the Middle–Late Holocene highstand. Regressive beach ridges, documented in this study, formed on Bubiyan (aka Boubyan) Island (Fig. 1) in the Late Holocene during RSL fall, which was concurrent with decelerating progradation of the Shatt Al-Arab delta. A tripartite formal subdivision of the Holocene into Early (11,700), Middle (8200), and Late (4200) cal yr BP is adopted here to be consistent with the formal subdivisions of the Holocene Series/Epoch proposed by Walker et al. (Reference Walker, Head, Lowe, Berkelhammer, Björck, Cheng and Cwynar2019).
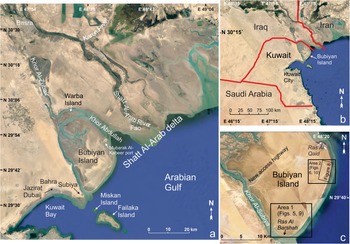
(a) Shatt Al-Arab delta, including Bubiyan Island, and the northern Gulf. (b) The Shatt Al-Arab delta is divided by the political borders of Kuwait, Iraq, and Iran. (c) Study Areas 1 and 2. The location of Figure 8 is shown in Area 2.

Beach ridges develop in various settings around the world, consequently a wide range of processes are responsible (Tamura, Reference Tamura2012). Although definitions, designations, and evolution of beach ridges are ambiguous (Otvos, Reference Otvos2012), relict spits, barrier islands, shoals, and cheniers in this study are termed “beach ridges” based on definitions by Vespremeanu-Stroe and Preoteasa (Reference Vespremeanu-Stroe and Preoteasa2015, p. 236) who pointed out that “abandoned spits and barriers are beach ridges, or beach-ridge plains” and by Tamura (Reference Tamura2012, p. 280), who stated that “coastal settings that form beach ridges include barrier islands, spits, and strand plains.” Moreover, Otvos (Reference Otvos2012, p. 47), specifically stated that “chenier ridges are genetically and morphologically identical to beach ridges.” Kelsey (Reference Kelsey, Shennan, Long and Horton2015, p. 76) described beach ridges as “shore-parallel ridges consisting of marine sediments accumulated by wave swash,”—a description that encompasses the above definitions.
Besides controlling beach-ridge formation in the northern Gulf, the Holocene rise and subsequent RSL fall also had archaeological consequences in the region. A rising sea level prior to the Holocene highstand terminated the occupation of Neolithic/Ubaid period sites (6500–3800 BC) on the shoreline of northern Kuwait (Carter et al., Reference Carter, Crawford, Mellalieu and Barrett1999) (Fig. 2a). A falling RSL in the Late Holocene stranded beach ridges several km inland, thereby isolating local people from resources of the sea and preventing access by would-be sea-faring visitors; this affected Sasanian (AD ca. 300–650) and early Islamic (AD ca. 650–800) activities (Fig. 2a) in the region, including on Bubiyan Island.
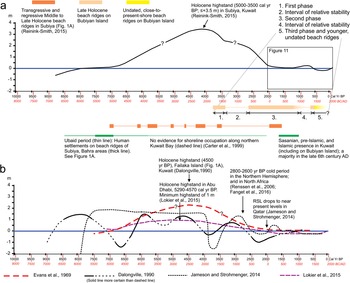
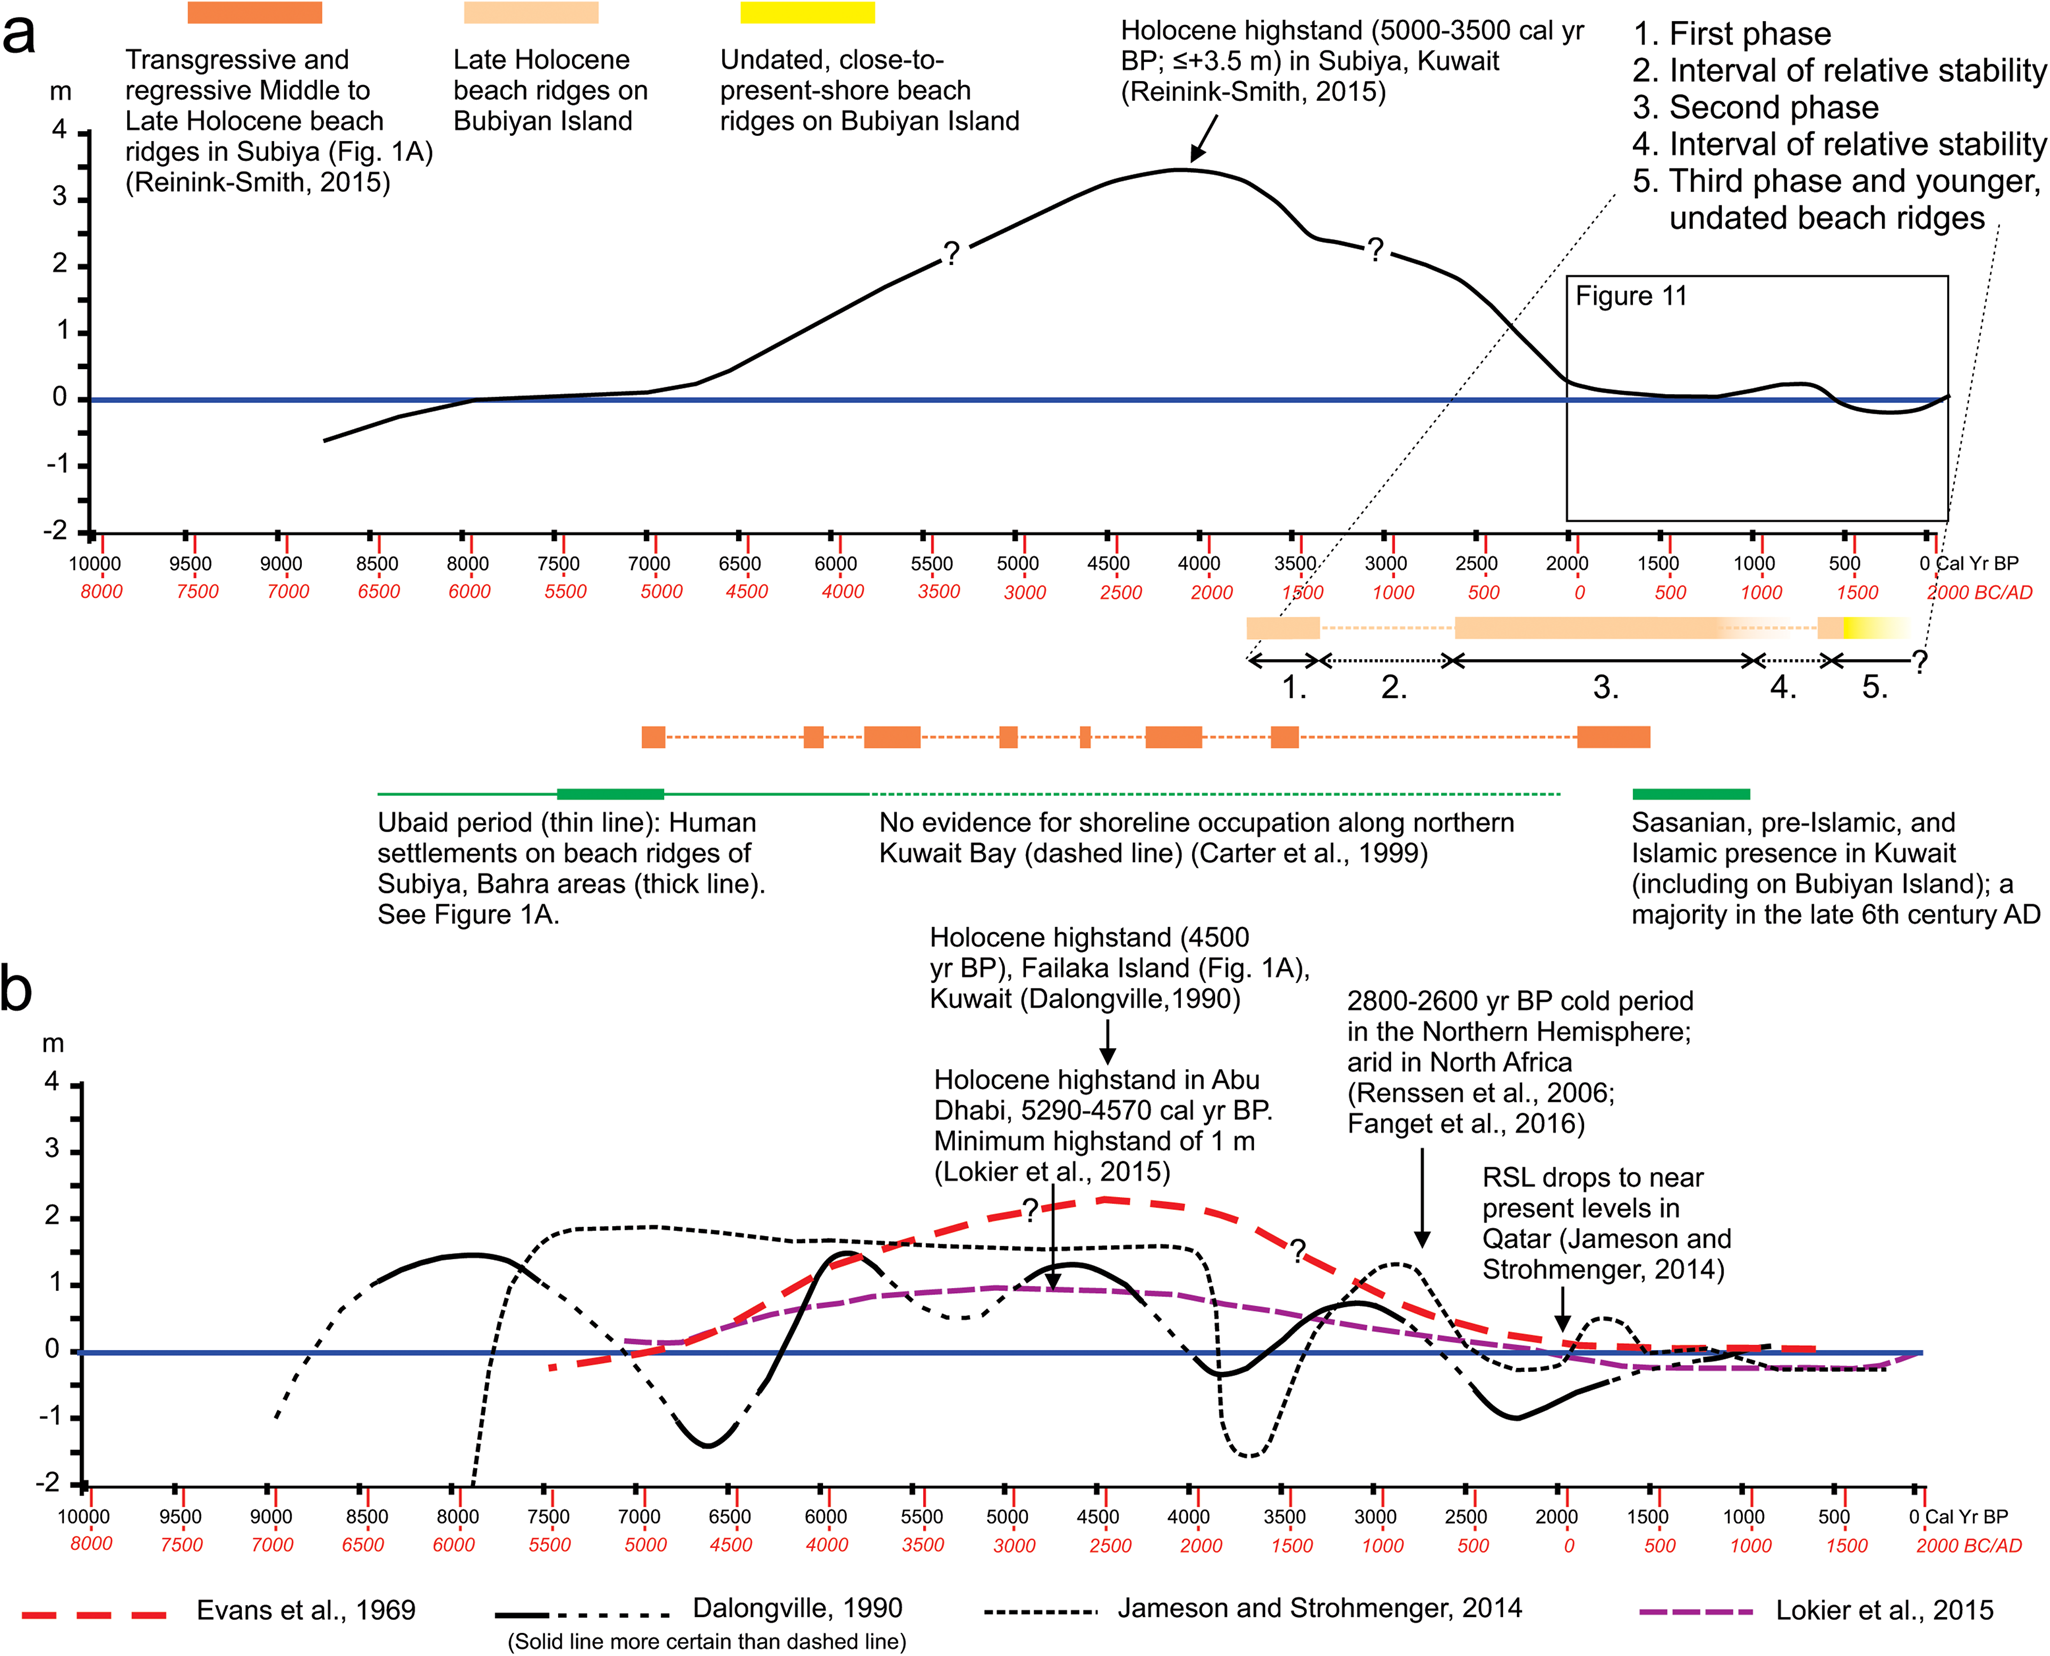
(a) Proposed sea-level curve for Kuwait Bay (Reinink-Smith, Reference Reinink-Smith2015) encompassing the past ca. 9000 yr, including the Late Holocene highstand ca. 5000–3500 cal yr BP for Subiya (Fig. 1a) and Bubiyan Island. Although, the highstand is depicted as a smooth curve, minor fluctuations may have occurred. The implied nearly horizontal curve ca. 3400–2500 cal yr BP is based on a relatively stable RSL, or a minor sea-level drop, during which time no beach ridges were stranded. Human occupation along the Kuwaiti coast during the Holocene RSL fluctuations includes Ubaid period, pre-Islamic, and early Islamic settlements in Kuwait. A string of small Sasanian and Islamic sites discovered on the Jazirat Dubaij promontory (Fig. 1a) in Subiya (Carter, Reference Carter, Carter and Crawford2010) are contemporaneous with the new finds in this study. At least three larger sites, mainly of the same age, are located along Kuwait Bay (Blair et al. Reference Blair, Kennet and al-Duwish2012), and on Miskan and Failaka islands (Fig. 1a) (Kennet, Reference Kennet2007, Reference Kennet2013; Kennet, personal communication, 2016). (b) Sea-level curves encompassing the past ca. 9000 yr for the Gulf, constructed for Failaka Island, Kuwait (Dalongeville, Reference Dalongeville, Calvet and Gachet1990), Qatar (Jameson and Strohmenger, Reference Jameson and Strohmenger2014), and Abu Dhabi (Evans et al., Reference Evans, Schmidt, Bush and Nelson1969; Lokier et al., Reference Lokier, Bateman, Larkin, Rye and Stewart2015). Only the curve of Dalongeville (Reference Dalongeville, Calvet and Gachet1990) displayed error bars of ages (not included here); the curves of Jameson and Strohmenger (Reference Jameson and Strohmenger2014) and Lokier et al. (Reference Lokier, Bateman, Larkin, Rye and Stewart2015) had no error bars. The curve by Evans et al. (Reference Evans, Schmidt, Bush and Nelson1969) was constructed by deciphering the text.
At 864 km2, Bubiyan Island, the largest island in Kuwait and the westernmost lobe of the Shatt Al-Arab delta, is an isolated, low-lying, mixed sabkha and salt flat (Fig. 1). The island is currently a military base with restricted access and is uninhabited. Plans for long-term development, however, are in effect (Gulf Consult, 2017), and a major port, Mubarak-Al-Kabeer, is being built on the northern shore of the island (Fig. 1a). A new, raised-access highway divides the island into northern and southern parts (Fig. 1c). An environmental preserve is planned for the northern part; most of the southern part (the focus of this study) is designated for residential areas and resorts.
The goal of this study is to document the Late Holocene shoreline deposits on southeastern Bubiyan Island while they still can be investigated prior to development. A sequence of Late Holocene beach ridges was mapped and studied in an attempt to establish how southeastern Bubiyan Island developed from the interplay of sediment input from the Shatt Al-Arab delta, minor sea-level fluctuations, climate variability, and minor local uplift. Accelerator Mass Spectrometry (AMS) dating of the beach ridges, and the archaeological finds in this study, help unravel the complex evolution of the western part of the Shatt Al-Arab delta and Late Holocene RSL changes in the northern Gulf.
SETTING AND CLIMATE: THE SHATT AL-ARAB DELTA AND BUBIYAN ISLAND
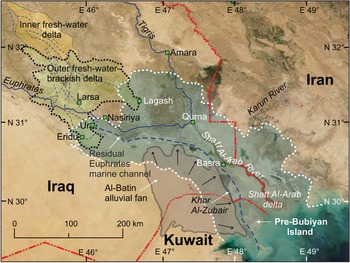
The Tigris-Euphrates delta system (precursor to the Shatt Al-Arab delta) (Fig. 3) was initiated concurrently with most present deltas in the world, during deceleration of global sea-level rise ca. 8500–6500 cal yr BP (Stanley and Warne, Reference Stanley and Warne1994; Trincardi et al., Reference Trincardi, Cattaneo and Correggiari2004; Engels and Roberts, Reference Engels and Roberts2005; Fanget et al., Reference Fanget, Bassetti, Fontanier, Tudryn and Berné2016). Evolution of these deltas was controlled by sea-level changes, climatic fluctuations, and differential sedimentation (Sanlaville, Reference Sanlaville1989, Reference Sanlaville and Clark2002; Baltzer and Purser, Reference Baltzer and Purser1990; Aqrawi, Reference Aqrawi1993, Reference Aqrawi2001; Sanlaville and Dalongeville, Reference Sanlaville and Dalongeville2005). The Shatt Al-Arab River formed ≤ 2000 yr BP (Al-Hamad et al., Reference Al-Hamad, Albadran and Pournelle2017; Al-Mosawi and Al-Manssory, Reference Al-Mosawi and Al-Manssory2019) when the Tigris and Euphrates rivers merged at Qurna (Fig. 3). A series of erosional, horizontal marine platforms had been cut into the pre-existing topography of the Gulf during the post-glacial rise of sea level (Kassler, Reference Kassler and Purser1973). For example, a 11,000–9000 yr BP submarine platform at −37 m to −29 m and a ≤ 7000 yr BP platform at −5 m extend from Kuwait to Abu Dhabi, suggesting that progradation of the Tigris-Euphrates deltaic sediments was across stable surfaces, although minor subsidence may also have occurred (Kassler, Reference Kassler and Purser1973).
Paleogeography during the Holocene sea-level highstand. A Mesopotamian fresh-/brackish-water delta (black dotted line) prograded into the extended Gulf (dotted white line) (modified from Pournelle, Reference Pournelle2003, Reference Pournelle and Crawford2012). Pre-Bubiyan Island formed as a prodelta lobe south of a residual marine channel of the Euphrates flowing within or parallel to the present Khor Al-Zubair channel (Plaziat and Younis, Reference Plaziat and Younis2005). The residual channel and other hypothetical waterways (dashed blue lines) are inferred from remnants of ancient levees and the sedimentary record (Pournelle, Reference Pournelle2003). The shape and location of the Al-Batin alluvial fan are modified from Sissakian et al. (Reference Sissakian, Shihab, Al-Ansari and Knutsson2014).

The Holocene sea-level history of the Gulf is considered to have been driven by eustatic sea-level changes and shoreline progradation, without major influence from tectonics, glacio-isostatic adjustments (GIA), or far-field effects of isostatic loading (Stevens et al., Reference Stevens, Jestico, Evans and Kirkham2014; Lokier et al., Reference Lokier, Bateman, Larkin, Rye and Stewart2015; Pourkerman et al., Reference Pourkerman, Marriner, Morhange, Djamali, Lahijani, Amjadi and Vacchi2021). According to Stevens et al. (Reference Stevens, Jestico, Evans and Kirkham2014), this conclusion requires no sweeping revision of the previously established sea-level history of the Gulf as described by Evans et al. (Reference Evans, Schmidt, Bush and Nelson1969), Patterson and Kinsman (Reference Patterson and Kinsman1977), Lambeck (Reference Lambeck1996), Williams and Walkden (Reference Williams and Walkden2002), and Evans (Reference Evans2011). Khanna et al. (Reference Khanna, Petrovic, Ramdani, Homewood, Mettraux and Vahrenkamp2021, p. 3) noted that “Stevens et al. (Reference Stevens, Jestico, Evans and Kirkham2014) and Lokier et al. (Reference Lokier, Bateman, Larkin, Rye and Stewart2015) presented compelling observations and arguments supporting a rather inactive tectonic setting along the western Gulf.” Even in Iran, on the northeastern coast of the Gulf, sea level is considered to have been controlled mainly by eustatic sea-level changes, despite some regional tectonic activity (Hosseinyar et al., Reference Hosseinyar, Behbahani, Moussavi-Harami, Lak and Kuijpers2021). Khanna et al. (Reference Khanna, Petrovic, Ramdani, Homewood, Mettraux and Vahrenkamp2021) argued that contradictions in more recent interpretations of Holocene sea-level history in the Gulf regarding the relative contribution of eustasy (Rohling et al., Reference Rohling, Grant, Bolshaw, Roberts, Siddall, Hemleben and Kucera2009), GIA (Lambeck et al., Reference Lambeck, Woodroffe, Antonioli, Anzidei, Gehrels, Laborel, Wright, Church, Woodworth, Aarup and Wilson2010, Reference Lambeck, Purcell, Flemming, Vita-Finzi, Alsharekh and Bailey2011), and tectonics (Wood et al., Reference Wood, Bailey, Hampton, Kraemer, Lu, Clark, James and Al Ramadan2012; Bosworth et al., Reference Bosworth, Montagna, Pons-Branchu, Rasul and Taviani2017) will only be resolved once a standardized database of sea-level change and a critical evaluation of the effects of local versus global sea-level drivers become available.
The Arabian Peninsula and southern Mesopotamia experienced humid conditions between 10,000–6000 cal yr BP, with a pluvial maximum at 9000–7000 cal yr BP (Kennett and Kennett, Reference Kennett, Kennett, Anderson, Maasch and Sandweiss2007). Thus, in the Middle Holocene, at ca. 8000 cal yr BP, the climate of Pre-Bubiyan Island was wet, as evinced by freshwater-marsh peat remains (Godwin et al., Reference Godwin, Surggate and Wills1958; Al-Zamel, Reference Al-Zamel1985; Aqrawi, Reference Aqrawi1993, Reference Aqrawi1997; Aqrawi et al., Reference Aqrawi, Domas, Jassim, Jassim and Goff2006; El-Nahas et al., Reference El-Nahas, Chitambira, White and Brew2014; Engel and Brückner, Reference Engel and Brückner2018). Peats 20–25 m below the present sabkha in the northern part of Bubiyan Island were dated at 8490 ± 100 14C yr BP to 7870 ± 90 14C yr BP (Al-Zamel, Reference Al-Zamel1985), and are here recalculated as 9699–9144 cal yr BP to 8992–8462 cal yr BP using OxCal 4.4 (Bronk Ramsey, Reference Bronk Ramsey2009) based on the IntCal20 atmospheric curve of Reimer et al. (Reference Reimer, Austin, Bard, Bayliss, Blackwell, Ramsey and Butzi2020). Similar peat layers were described from Iraq, at −14 m in Basra (Aqrawi Reference Aqrawi1993, Reference Aqrawi1997), and at −30 m in Fao (Godwin et al., Reference Godwin, Surggate and Wills1958) (Fig. 1a). Palynological evidence for a humid climate at this time has also been reported in Iran (Aqrawi et al., Reference Aqrawi, Domas, Jassim, Jassim and Goff2006).
After 6000–5000 cal yr BP, the climate became increasingly arid (Aqrawi, Reference Aqrawi2001; Milli and Forti, Reference Milli, Forti, Romano and D'Agostino2019), with a hyper-arid climate established by 3000 cal yr BP (Uchupi et al, Reference Uchupi, Swift and Ross1996), resulting in a reduced sediment load from the Euphrates-Tigris River systems (Uchupi et al., Reference Uchupi, Swift and Ross1999). Presently, the Shatt Al-Arab delta, which is transitioning into a tidal-dominated river estuary, has only two active distributaries. Much of the delta plain is inactive or abandoned, comprised of wide tidal and salt flats, large sabkhas, marshes, and islands (Larsen and Evans, Reference Larsen, Evans and Brice1978; Macfayden and Vita-Finzi, Reference Macfayden and Vita-Finzi1978; Aqrawi, Reference Aqrawi1993, Reference Aqrawi2001; Lambeck, Reference Lambeck1996; Sanlaville, Reference Sanlaville and Clark2002; Coleman and Huh, Reference Coleman and Huh2003; Pournelle, Reference Pournelle2003, Reference Pournelle and Crawford2012; Plaziat and Younis, Reference Plaziat and Younis2005; Sanlaville and Prieur, Reference Sanlaville, Prieur and Schwartz2005; Heyvaert and Baeteman, Reference Heyvaert and Baeteman2007; Isaev and Mikhailova, Reference Isaev and Mikhailova2009; Al-Mulla and Al-Ali, Reference Al-Mulla and Al-Ali2015; Sissakian et al., Reference Sissakian, Ahad, Al-Ansari and Knutsson2018; Al-Aesawi et al., Reference Al-Aesawi, Al-Nasrawi and Jones2020). One of these islands is Bubiyan Island, situated south of the mouth of the Khor Al-Zubair estuary (Fig. 1a).
The mud/silt that comprises Bubiyan Island is ~35 m thick and overlies gravel of the Pleistocene Dibdibba Formation (Khalaf and Al-Awadhi, Reference Khalaf and Al-Awadhi2012; Bao and Huang, Reference Bao and Huang2013). At the site of the Mubarak Al-Kabeer Seaport (Fig. 1a), El-Nahas et al. (Reference El-Nahas, Chitambira, White and Brew2014) attributed calcareous, locally organic-rich sand below −23 m CD to −42 m CD (Chart Datum = mean lower low water) to the Zahra Formation, which may have been deposited in marshes and shallow lakes at the margins of the alluvial flood plains that formed the Dibdibba gravel (Jassim and Al-Jiburi, Reference Jassim and Al-Jiburi2009).
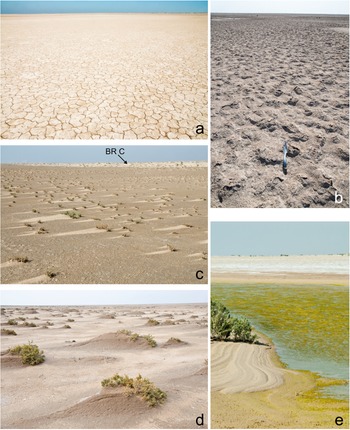
Sediment load from the Shatt Al-Arab delta, and possibly from the Pleistocene Wadi Batin alluvial fan (Sissakian et al., Reference Sissakian, Shihab, Al-Ansari and Knutsson2014) (Fig. 3), has resulted in local subsidence of the northwestern part of Bubiyan Island and slight uplift (1–2 m) of the southern part (Lees and Falcon, Reference Lees and Falcon1952; Kassler, Reference Kassler and Purser1973; Al-Asfour, Reference Al-Asfour1982). Consequently, the drainage direction within the island is currently through narrow wadis toward the northwest. Present elevations on Bubiyan Island are poorly known but generally considered to be ≤ 4 m above mean sea level (Neelamani and Al-Shatti, Reference Neelamani and Al-Shatti2014). A Governorates of Kuwait topographic map (1975) shows “4–6 m elevation” for the southeasternmost part of the island, consistent with drainage being to the northwest. Some parts of the island may even be below sea level (El Raey, Reference El Raey2010); the topography appears flat in any direction (Fig. 4a–d). Elevations probably change slightly from one year to the next owing to wind deflation and erosion by infrequent but powerful rainstorms.
Bubiyan Island sabkha extends for 25 km from northern Bubiyan Island southeast to a coastal nabkha belt consisting of sand dunes (similar to coppice dunes), with vegetated crests. (a) Deflated, desiccated sabkha located between BRs I and f1 in Area 2 (Fig. 6); (b) gypsum crystallizing in the sabkha (trowel for scale) after rain causes bulbous appearance of the terrain just northwest of BR G-a (Area 2); (c) incipient nabkhas form in-between BRs C and D (Area 1, Fig. 5); (d) nabkhas on BR H (Area 2); (e) an algal bloom colors this ephemeral lake green (just northwest of BR f1, Area 2); these lakes accumulate after torrential winter rains and remain for several weeks. The precipitated salts on the shore in the background show that the lake level has changed.

PREVIOUS WORK ON COASTAL DEPOSITS IN THE GULF
The modern Shatt Al-Arab delta (Fig. 1a), which empties into the northernmost part of the Gulf, is probably the only delta bordering a desert and draining into a hypersaline, shallow, semi-enclosed marine basin (Gunatilaka, Reference Gunatilaka1986). Despite numerous studies (Larsen, Reference Larsen1975; Hansman, Reference Hansman1978; Evans, Reference Evans1979; Albadran, Reference Albadran1995, Reference Albadran2004; Aqrawi, Reference Aqrawi2001; Isaev and Mikhailova, Reference Isaev and Mikhailova2009; Al-Hawi, Reference Al-Hawi2014), no detailed geological or geophysical studies have been conducted in the Shatt Al-Arab delta region owing to the confluence of the political borders of Kuwait, Iraq, and Iran (Gunatilaka, Reference Gunatilaka1986; Al-Mosawi and Al-Manssory, Reference Al-Mosawi and Al-Manssory2019) (Fig. 1b).
Most coastal deposits along the southwestern margin of the Gulf, however, have been relatively well studied and are relicts of a Holocene sea-level highstand and subsequent RSL fall. Although temporal and spatial inconsistencies have been documented, a highstand, 1–2.5 m higher than at present, is recorded between 7000–3000 cal yr BP with a peak ca. 4000 cal yr BP (Lambeck, Reference Lambeck1996; Jameson and Strohmenger, Reference Jameson and Strohmenger2012; Engel and Brückner, Reference Engel and Brückner2014; Lokier et al., Reference Lokier, Bateman, Larkin, Rye and Stewart2015; Hosseinyar et al., Reference Hosseinyar, Behbahani, Moussavi-Harami, Lak and Kuijpers2021; Khanna et al., Reference Khanna, Petrovic, Ramdani, Homewood, Mettraux and Vahrenkamp2021). Parker et al. (Reference Parker, Armitage, Engel, Morley, Parton, Preston, Russ and Drechsler2020) documented the highstand at 2.8–3.10 m with an upper limit of 3.75 m above the present sea level. Thereafter RSL fell and coastal systems prograded (Kassler, Reference Kassler and Purser1973; Vita-Finzi, Reference Vita-Finzi2001; Williams and Walkden, Reference Williams and Walkden2002; Parker et al., Reference Parker, Armitage, Engel, Morley, Parton, Preston, Russ and Drechsler2020; Rivers et al., Reference Rivers, Engel, Dalrymple, Yousif, Strohmenger and Al-Shaikh2020; Khanna et al., Reference Khanna, Petrovic, Ramdani, Homewood, Mettraux and Vahrenkamp2021).
Dalongeville (Reference Dalongeville, Calvet and Gachet1990) described the Late Holocene highstand from Failaka Island, Kuwait, ~14 km southeast of Bubiyan Island (Fig. 1a), as having occurred ca. 4500 yr BP, and Reinink-Smith (Reference Reinink-Smith2015) described the highstand, 3.5 m higher than at present, from nearby Bahra-Subiya (Fig. 1a) at ca. 5000–3500 cal yr BP (Fig. 2a). The ensuing RSL fall led to progradation of coastal systems along the entire southwestern margin of the Gulf, from Kuwait to Abu Dhabi. Ages of these coastal deposits have been reported to range between 7000–1400 cal yr BP (Rivers et al., Reference Rivers, Engel, Dalrymple, Yousif, Strohmenger and Al-Shaikh2020), but generally are considered to be 4500–3000 cal yr BP, with elevations of 1–4 m (Alsharhan and Kendall, Reference Alsharhan and Kendall2003; Jameson and Strohmenger, Reference Jameson and Strohmenger2012, Reference Jameson and Strohmenger2014; Engel and Brückner, Reference Engel and Brückner2014; Reinink-Smith, Reference Reinink-Smith2015).
Although no dedicated studies have been conducted on the formation of Bubiyan Island, the beach ridges on the island were first mentioned in two unpublished reports by Mecall (Reference Mecall1952) and Hunziker and Mecall (Reference Hunziker and Mecall1952). Al-Asfour (Reference Al-Asfour1982) published five preliminary 14C dates from beach ridges near the southern tip of Bubiyan Island, from Area 1 of this study (Fig. 5). Carter et al. (Reference Carter, Crawford, Mellalieu and Barrett1999), Carter and Crawford (Reference Carter and Crawford2001, Reference Carter and Crawford2002, Reference Carter and Crawford2003), Carter (Reference Carter2002, Reference Carter2003), Carter and Philip (Reference Carter and Philip2010); Blair et al. (Reference Blair, Kennet and al-Duwish2012), and Bieliński et al. (Reference Bieliński, Białowarczuk, Kiersnowski, Piątkowska-Małecka, Reiche, Smogorzewska and Szymczak2015) described intermittent human activity on beach ridges of the northeastern Kuwait mainland, first during the Ubaid period, and then during the Sasanian and early Islamic periods (until at least the eighth century AD) (Fig. 2a). No previous detailed archaeological studies have been conducted on Bubiyan Island.
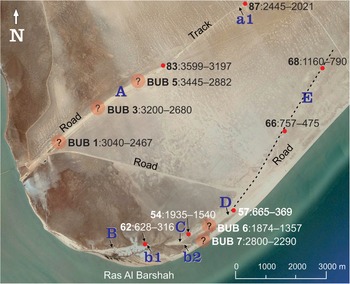
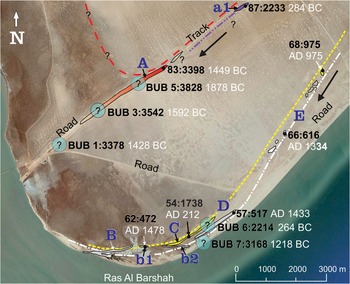
Dated beach ridges from Area 1. BRs A, a1, B, b1, b2, C, and E, are marked by large, blue font. AMS dates are listed as 2σ calibration ranges at 95% probability (see Table 1 for cal yr BC and AD). All dates are preceded by sample numbers (in bold) and their locations are shown as red dots. Al-Asfour's (Reference Al-Asfour1982) original 14C dates of 3170 ± 80 (BUB 1); 3300 ± 80 (BUB 3), 3520 ± 85 (BUB 5); 2240 ± 80 (BUB 6); and 3000 ± 80 14C (BUB 7), were recalibrated to 3040–2467 cal yr BP (BUB 1); 3200–2680 cal yr BP (BUB 3); 3445–2882 cal yr BP (BUB 5); 1874–1357 cal yr BP (BUB 6); and 2800–2290 cal yr BP (BUB 7) using OxCal 4.4 (Bronk Ramsey, Reference Bronk Ramsey2009) based on the Marine20 radiocarbon age calibration curve (Heaton et al., Reference Heaton, Köhler, Butzin, Bard, Reimer, Austin and Ramsey2020). Al-Asfour's (Reference Al-Asfour1982) original dates were located on a hand-drawn map and are here depicted as transparent circles (with question marks) to indicate their exact locations are unknown. The black, dashed line shows the trend of BR E merging into BR D.

METHODS
In order to differentiate and distinguish beach ridges in Area 1 versus Area 2, the main beach ridges (BRs) were labeled A–E (Area 1) and F–K (Area 2), respectively (Figs. 5, 6). Some of the beach-ridge characteristics are shown in Figure 7a–c. Smaller beach ridges, and even smaller “patches” in Area 1, were labeled a1 and b1–b2 to indicate their presumed former continuity with BRs A and B. Small beach ridges and patches labeled f1–f3, g1–g3, and k1–k3 in Area 2 were assumed to be linked to the main beach ridges F, G (G-a, G-b), and K.
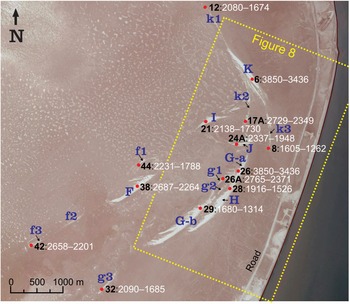
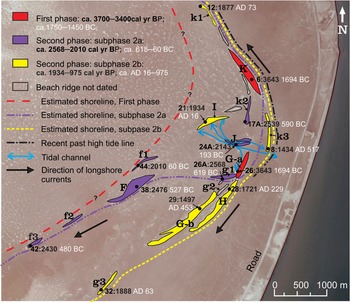
In Area 2, BRs F–K, f1–3, g1, g2, and k1–3, are shown in large blue font. AMS dates (in white) are preceded by sample numbers in black, bold font, and their locations are shown as red dots. All AMS dates are shown as 2σ calibration ranges at 95% probability (see Table 1 for cal yr BC and AD). The dotted rectangle shows the location of Figure 8.

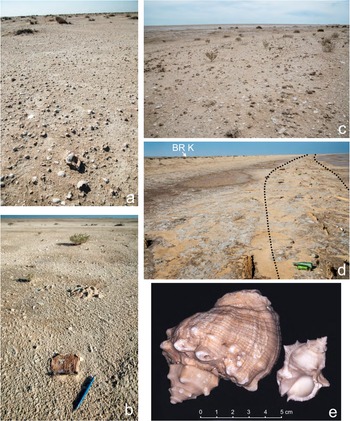
Beach ridge photos. (a) BR G-a (Area 2, Fig. 6) with a large shell of Bufonaria echinata Link, 1807, in the center foreground; (b) this pottery sherd was found in the most northeasterly reach of BR G-a; (c) bioturbated beachrock (dark lumps) litter the berm of BR K (Area 2); (d) the old glass-bottle tide line (between dotted lines) northeast of BR K (arrow); recent downpours left parts of the ground wet; (e) a relatively large, slightly abraded shell of Indothais lacera Born, 1778; shells of this species were used for all AMS dates from Areas 1 and 2. Photos (a–c) are looking toward the southwest, (d) is looking northeast.

All of the beach ridges, most of which are readily apparent on Google Earth images, were repeatedly investigated in detail, on foot by the first author during a 3.5-year period. To establish precise depositional environments of spits and shoals, the mollusks from the beach ridges were identified (unpublished results) and compared with mollusks from the present beach and intertidal areas on Bubiyan Island. Thin shelly deposits on the supratidal flat in nearby Subiya (Fig. 1a) were also investigated for comparison. The effects of torrential rain and dust storms on the shelly beach ridges were observed to evaluate their possible erosional or depositional consequences.
Twenty-one mollusk shells from Areas 1 and 2 were collected for AMS dating (Figs. 5, 6). Only shells of the well-preserved, ubiquitous, carnivorous gastropod Indothais lacera with minimally abraded exteriors and without apparent bioerosion (sponge borings) or alteration (Fig. 7e) were collected. Owing to its thick shell, I. lacera is less likely to have been severely abraded, corroded, contaminated by near-surface weathering, or moved by water or wind. Tamura (Reference Tamura2012, p. 279) stated “Radiocarbon dating of articulated shells, which are considered not to be extensively reworked, provides robust results.” Articulated bivalves were considered for AMS dating in this study, but rejected because small bivalves were observed to be transported onto the sabkha by strong winds and, therefore, also may have been blown onto the beach ridges. Larger bivalves, such as Protapes cor, Placuna placenta, or species of the genus Anadara, also were excluded because they commonly were more altered than I. lacera.
Samples for dating were collected from berm tops (where present), away from the periphery where mixing with more recent material could have occurred during flooding by torrential winter rains or former tides. Thus, the sample ages probably are minimum ages, representing the last storm surge prior to abandonment. Any site showing recent human activity was avoided. The locations of all samples were recorded using a Garmin Oregon 650 GPS device with horizontal spatial accuracy of ~5 m.
Considering that consistency in the selection of shell portions is vital for obtaining robust age data (Milano and Nehrke, Reference Milano and Nehrke2018), the I. lacera samples were crushed, and only the thickest interior whorls and the columella (toward the spire) were saved for dating. Exterior parts of the gastropod shells were discarded to avoid potential contamination from secondary carbonate.
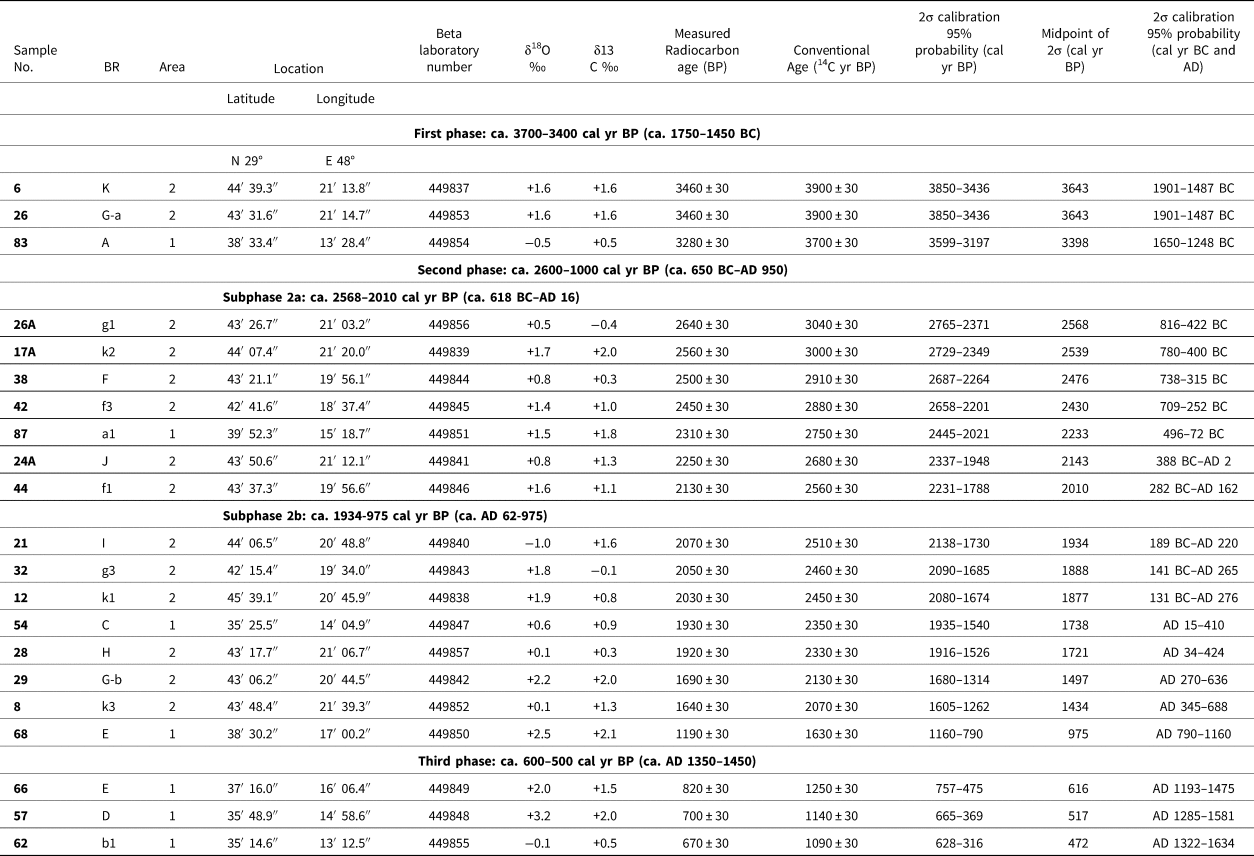
The 21 mollusk shell samples were submitted to Beta Analytic, Inc. in Miami, Florida, USA, for Accelerator Mass Spectrometry (AMS 14C) dating. Beta Analytic adhered to their standard protocol for AMS dating of shells, which includes the physical removal of any visible contaminant (including easily spotted white, chalky recrystallized calcite), and standard acid etching to remove the outer half of any exterior shell components. Ages reported as radiocarbon years before present (14C yr BP) are conventional radiocarbon ages corrected for isotopic fractionation using the δ13C (Table 1). Ages reported as calendar years (i.e., cal yr BP, BC, and AD) were calculated in compliance with the Marine20 database (marine radiocarbon calibration curve), as described by Bronk Ramsey (Reference Bronk Ramsey2009) and Heaton et al. (Reference Heaton, Köhler, Butzin, Bard, Reimer, Austin and Ramsey2020). A local Delta ± R correction from Qatar of 46 ± 53 yr (Southon et al., Reference Southon, Kashgarian, Fontugne, Metivier and Yim2002) was applied to each sample.
AMS ages from Bubiyan Island beach ridges. Each date was derived from the unaltered interior columella and whorls of the thick-shelled gastropod Indothais lacera (Fig. 7e). The boundaries of the main phases are the midpoint of the 2σ calibration range rounded approximately to the nearest century.

BR = Beach Ridge
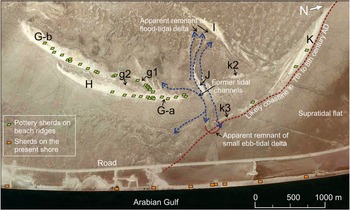
A widely dispersed but persistent scatter of pottery sherds examined by Robert Carter was found mainly on BRs G-a and g1, some on BR G-b and H, and rarely on BR K, all in Area 2. All sherds were collected and recorded unless they were small, non-descript, or severely corroded. The range and distribution of the sherds on the beach ridges (as well as on the present beach) were documented and mapped as shown in Figure 8.
Torpedo jar sites on BRs G-a, g1, G-b, and H, and sherds found on the present shore in Area 2. The ages of the sherds on the present beach vary more than on the beach ridges, but several sherds are of Sasanian to Islamic periods. It seems not a coincident that these old sherds were discovered only on the coastline closest to BRs G and H given the location of the former tidal inlet. Pottery sherds of likely seventh to eighth century AD age were not found elsewhere along the ~25 km beach.

RESULTS
Beach ridges on Bubiyan Island
The beach ridges on Bubiyan Island are up to 5 km inland from the present shore, but most are within 1–2 km (Figs. 5, 6, 9, 10). In Area 1, all of the beach ridges are near the present shore except for BR A (~2 km long), which is ~5 km inland. Some beach ridges in Area 1 are small, disjointed patches (as in BR E) covered by thin layers of shells. Most dated beach ridges in Area 1 do not have well-developed berms; the exceptions are the recent-past berms, which were not dated and are separated by strand plains from the present beach and berm.
The likely order of beach-ridge development in Area 1. BRs A, a1, B, b1, b2, C, and E, are marked by large, blue font. All BP dates and sample numbers are in black bold, and their locations are shown as black dots. BC and AD dates are in white. All BP, BC, and AD dates are midpoints of the 2σ calibration range; for 2σ calibration ranges at 95% probability, see Table 1 and Figure 5. Al-Asfour's (Reference Al-Asfour1982) samples are depicted as transparent circles (with question marks) to indicate their exact locations are unknown. Dashed lines and solid colors are as follows (see also legend on Fig. 10): Red: probable First phase shoreline; Purple: Second phase, subphase 2a shoreline, is represented only by BR a1 and can be correlated from Area 2 (Figs. 10, 12A); the strandline of subphase 2a probably closely paralleled the First phase shoreline. Yellow: Second phase, subphase 2b shoreline; White: Third phase shoreline. The paleoshorelines of subphase 2b and the Third phase appear to have trended ~N35°E, ≤ 7° difference from the N42°E trend of the present shoreline.

The likely order of beach ridge development in Area 2. The beach ridges are marked in large font. All BP dates and sample numbers are in black bold, and their locations are shown as black dots. BC and AD dates are in white. All BP, BC, and AD dates are midpoints of the 2σ calibration range; for 2σ calibration ranges at 95% probability, see Table 1 and Figure 6. During the First phase, the initial lateral accretion of BRs G-a and K was slow with probable subsequent erosion in the downdrift directions until the Second phase. BRs g1, F, f1–f3 delineated the first unequivocal coastline during subphase 2a (outlined by a purple, dashed, double-dotted line). The coastline in the northeastern part of Area 2 has remained essentially constant since subphase 2a, until the recent past, as indicated by the recent-past high-tide line. In the southwestern part of Area 2, however, the shoreline prograded ~1000 m between subphases 2a and 2b.

In Area 2, several sets of “inland” beach ridges are stranded up to ~1.5–4.5 km from the present ~25-km-long, southeast-facing beach of Bubiyan Island (Figs. 6, 7a–d, 10). Although some of these beach ridges are nearly 2 km long, they are insignificant features in the vast sabkha. BRs F–K are 700–2000 m long × 50–125 m wide, with 70–100 m widths most common. BR K is the most prominent beach ridge with a preserved berm that stands ≤ 3 m above the sabkha, while BRs G-a and H have a relief of ≤ 2 m.
Unlike the predominantly cemented beach ridges in nearby Bahra-Subiya (Reinink-Smith, Reference Reinink-Smith2015) (Fig. 1a), all of the beach ridges on Bubiyan Island consist of unconsolidated mollusk shells and shell fragments, foraminiferal sand, and small amounts of silt and clay; rare ≤ 4-cm pebbles are mostly basic igneous lithologies. The shells on BRs G-a, G-b, H, and K are well preserved, commonly with intact spines, which is uncommon on the present beach. The small, outlying beach ridges and patches identified by small letters and numbers (Figs. 5, 6, 9, 10) exhibit little or even negative relief of a few cm relative to the surrounding muddy sabkha, which tends to swell with interstitial crystallization of gypsum and halite after torrential rain (Fig. 4b). Occasional small, bioturbated, sandy/muddy/shelly, calcareous lumps are present on some beach ridges, but these lumps are widespread only on BR K (Fig. 7c). The lumps probably originated from hardgrounds, which are common in the shallow sub-surface throughout much of the Gulf (Paul and Lokier, Reference Paul and Lokier2017; Ge et al., Reference Ge, Pederson, Lokier, Traas, Nehrke, Neuser, Goetschl and Immenhauser2020). Although hardgrounds were not observed on southeastern Bubiyan Island, small areas of firmground can be found in the present intertidal region.
AMS dates
AMS dates from the gastropod Indothais lacera (Fig. 7e) collected on beach ridges in Areas 1 and 2 range from 3850–3436 cal yr BP to 628–316 cal yr BP (Table 1). The oldest ages are from BR A in Area 1 (Fig. 5) and BRs G-a and K in Area 2 (Fig. 6); BRs G (G-a and G-b), H, and K, are the best-preserved beach ridges with the most diverse mollusk fauna and well-developed berms. Other beach ridges and patches in Areas 1 and 2 show mostly intermediate ages of 2765–2371 cal yr BP to 1160–790 cal yr BP (Table 1). These beach ridges may be located both landward and seaward of the main beach ridges (Fig. 6). The youngest beach ridges, 757–475 cal yr BP to 628–316 cal yr BP, are from beach ridges closest to the present beach in Area 1.
Relationship of ancient beach ridges to recent sea level
High-tide lines and storm berms outlined by debris are present in Areas 1 and 2. In Area 1 (Fig. 9), a relatively recent storm berm is recorded as a substantial accumulation of recent trash on BR B, but curiously not on or along BRs b1 and b2 (disconnected segments of BR B), where only a few degraded pieces of driftwood were found. None of the other beach ridges in Area 1 shows evidence of recent or past storm berms or high-tide lines. In Area 2, a relatively recent high-tide line occurs within 100–200 m of BRs G-a and K (Figs. 7d, 10); it is characterized by old glass bottles, decaying wood fragments, and the occasional frayed boat line. A similar high-tide line in the Bahra-Subiya area, dominated by old glass bottles, was described by Reinink-Smith (Reference Reinink-Smith2015). Those bottles were manufactured mostly between 1940–1960 (some as early as the 1920s), indicating that high tides flowed farther inland in the recent past. This seems to be the case also on Bubiyan Island, given that a “Dettol antiseptic” bottle manufactured ca. 1920 was found near BR G-a. A raised coastal road (marked as “road” in Figures 5, 6, 9, 10) was likely built just prior to 1980. This road may have prevented more recent plastic or glass trash from being added to the glass-bottle tide line—whether by tide or by wind. No high tide lines were observed near BRs F, G-b, or H.
Archaeological finds
Pottery sherds of Sasanian and early Islamic periods on BRs G-a, g1, G-b, and H were found in mainly a 700 × 300 m area in the central to northeastern back beach area; for instance, they define a distinct pattern of distribution on BR g1, which connects BR G-a with BR G-b (Fig. 8) (yet no sherds were found on nearby BR g2). The sherds were not concentrated in visible scatters, as described by Blair et al. (Reference Blair, Kennet and al-Duwish2012); most sherds have angular edges, corroded surfaces, and occur as small fragments from the bodies of ceramic vessels. Rarely, sherds clustered in a small area fit together to form part of a vessel. The most-distinctive and best-preserved sherds (commonly with rims) were found along the northern and northeastern margins of BR G-a, and can be identified as “torpedo jar”—a kind of jar analogous to amphorae of the classical Mediterranean—fragments (see Supplementary Figure 15).
A few pottery sherds, generally with better surface preservation than the sherds on the beach ridges, were found on the present-day intertidal area, berm, and washover fans, ~1–2 km directly southeast of BRs G-a, H, and K (Fig. 8). These sherds have mainly rounded, eroded edges; some are glazed; and a few are encrusted with oysters, barnacles, and bryozoans (Supplementary Figures 16, 17). Two small, poorly preserved body sherds (not recorded) were also found on BRs B and C in Area 1 (Fig. 5). The archaeology is discussed in the Supplementary material.
DISCUSSION
Development of Shatt Al-Arab delta, southern Bubiyan Island, and beach ridges
As the Shatt Al-Arab delta prograded into the shallow northern Gulf in the Late Holocene, an isolated prodelta lobe, the embryonic Bubiyan Island, formed in the westernmost reaches of the delta, likely from a paleochannel of the Euphrates River flowing into what are currently the Khor Al-Zubair and Khor Abdullah estuaries (Figs. 1a, 3). The only mention of this channel, in the context of Bubiyan Island is by Wilson (Reference Wilson1925, p. 226) who asserted “we are fully justified on the evidence in assuming Bubiyan Island to be the gift of the Euphrates, and to consist of silt brought down by the Euphrates, and the Euphrates only, before the beginning of the Christian era.”
The age of this Euphrates paleochannel is uncertain. Hansman (Reference Hansman1978) referred to it as having been active in the fourth century BC. Zarins (Reference Zarins1992) stated that a major southern channel of the Euphrates appeared ca. 2000 BC (3950 yr BP) and flowed until Parthian times (247 BC–AD 224; 2197–1726 yr BP). Jotheri (Reference Jotheri2016) pointed out that, based on archaeological sites along its course, the channel probably flowed during the Sasanian (AD ca. 300–650; 1650–1300 cal yr BP) and early Islamic (AD ca. 650–800; 1300–1150 cal yr BP) periods. Jotheri et al. (Reference Jotheri, Allen and Wilkinson2015) previously had maintained, however, that ancient rivers in many cases are older than their associated settlements (just as Bubiyan Island is >2000 yr older than the Sasanian and early Islamic pottery found on its beach ridges). Jotheri (Reference Jotheri2016) cited an age of 2470–2285 BC (4420–4235 yr BP) for a marsh deposit immediately under the Euphrates paleochannel. The channel probably formed and Bubiyan Island surfaced soon after the formation of the marsh deposit, given that the two oldest beach ridges on Bubiyan Island are 3850–3436 cal yr BP (Table 1).
The Bubiyan Island prodelta was abandoned, likely owing to lack of accommodation space in the shallow northern Gulf along with decreasing sediment input from the Euphrates paleochannel. Neotectonic activity adjacent to the Euphrates paleochannel resulted in detachment of the river course from the Gulf, cessation of river discharge, and development of the Khor Al-Zubair estuary (Zarins, Reference Zarins1992; Yaseen, Reference Yaseen1998; Muttashar, Reference Muttashar2010) (Fig. 1a). Growth of the westernmost part of the delta ceased. As the climate became increasingly arid, the sediment load into the entire delta gradually decreased (Aqrawi, Reference Aqrawi2001; Milli and Forti, Reference Milli, Forti, Romano and D'Agostino2019), and progradation into the Gulf slowed significantly, with increasing abandonment of the channel network (Milli and Forti, Reference Milli, Forti, Romano and D'Agostino2019). Cores from at least 34 boreholes drilled on Bubiyan Island to ~35 m depth consist of undifferentiated and finely laminated mud and silt (Bao and Huang, Reference Bao and Huang2013; El-Nahas et al., Reference El-Nahas, Chitambira, White and Brew2014; unpublished sources), demonstrating the absence of classic coarsening-upward deltaic sequences.
Considering the Gulf's tectonic stability, world-wide, short-lived, decimeter-scale (±25 cm) sea-level fluctuations throughout the past ca. 2100 yr until the onset of the modern rise in the late nineteenth century (Bungenstock et al., Reference Bungenstock, Mauz and Schafer2004; Sivan et al., Reference Sivan, Lambeck, Toueg, Raban, Porath and Shirman2004; Gehrels et al., Reference Gehrels, Kirby, Prokoph, Newnham, Achterberg, Evans, Black and Scott2005; Vos and Kiden, Reference Vos and Kiden2005; Mauz and Bungenstock, Reference Mauz and Bungenstock2007; Kemp et al., Reference Kemp, Horton, Doonnelly, Mann, Vermeer and Rahmstorf2011, Reference Kemp, Horton, Vane, Bernhardt, Corbett, Engelhart, Anisfeld, Parnell and Cahill2013; Kopp et al. Reference Kopp, Dutton and Carlson2017) may have affected the Gulf. For instance, along the low-angle Abu Dhabi coast, Middle to Late Holocene, small-scale sea-level changes resulted in major lateral shifts of facies belts (Lokier et al., Reference Lokier, Bateman, Larkin, Rye and Stewart2015; Khanna et al., Reference Khanna, Petrovic, Ramdani, Homewood, Mettraux and Vahrenkamp2021). Coastal changes in Qatar also indicate minor fluctuations of sea level during the Late Holocene (Engel and Brückner, Reference Engel and Brückner2014) (See also Fig. 2). The nearly flat topography of Bubiyan Island, at an elevation of ~4 m, would have been especially susceptible to changes from minor sea-level fluctuations, especially given that tidal variations are ~4 m in the study area (Rakha et al., Reference Rakha, Al-Salem and Neelami2007).
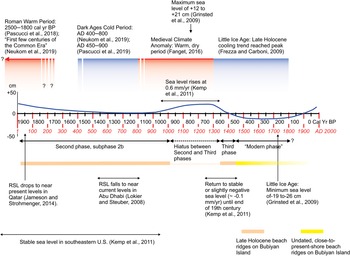
Peak warming and cooling climate events during the past 2000 yr (Neukom et al., Reference Neukom, Steiger, Gómez-Navarro, Wang and Werner2019) probably also contributed to RSL changes. Climate phases, such as the Medieval Climate Anomaly (MCA) (ca. 1150–650 yr BP, with a peak at ca. 950–750 yr BP) (Mann et al., Reference Mann, Zhang, Rutherford, Bradley, Hughes, Shindell and Ni2009; Rosenthal et al., Reference Rosenthal, Linsley and Oppo2013; Fanget et al., Reference Fanget, Bassetti, Fontanier, Tudryn and Berné2016; Lüning et al., Reference Lüning, Gaɫka and Vahrenholt2017) and the Little Ice Age (LIA) (ca. 650–150 yr BP), are associated with short-lived sea-level fluctuations (Moberg et al., Reference Moberg, Sonechkin, Holmgren, Datsenko and Karlen2005; Mann et al., Reference Mann, Zhang, Hughes, Bradley, Miller, Rutherford and Ni2008; Vermeer and Rahmstorf, Reference Vermeer and Rahmstorf2009; Kemp et al. Reference Kemp, Horton, Vane, Bernhardt, Corbett, Engelhart, Anisfeld, Parnell and Cahill2013; PAGES 2k Consortium, 2013; Thompson et al., Reference Thompson, Mosley-Thompson, Davis, Zagorodnov, Howat, Mikhalenko and Lin2013). Consensus is absent about the precise spatial and temporal extent of these climate events, which may be regionally constrained (Neukom et al., Reference Neukom, Steiger, Gómez-Navarro, Wang and Werner2019). Figure 11 suggests possible correlations of these climate events with RSL during development of beach ridges on Bubiyan Island.
Inferred Bubiyan Island RSL curve for the past 2000 yr (see also Fig. 2). This RSL model for the development of Bubiyan Island and the abandonment of spits and barriers as beach ridges is manifested, as shown, also in other parts of the Gulf, such as in Abu Dhabi (Lokier and Steuber, Reference Lokier and Steuber2008; Lokier et al., Reference Lokier, Bateman, Larkin, Rye and Stewart2015), Qatar (Jameson and Strohmenger, Reference Jameson and Strohmenger2014), and RSL curves shown in Figure 2b. RSL oscillations apparently correlate with climate events described by Frezza and Carboni (Reference Frezza and Carboni2009), Fanget et al. (Reference Fanget, Bassetti, Fontanier, Tudryn and Berné2016), Pascucci et al. (Reference Pascucci, De Falcob, Del Vaisc, Sannad, Melise and Andreuccie2018), and Neukom et al. (Reference Neukom, Steiger, Gómez-Navarro, Wang and Werner2019), and even when considered globally (Grinsted et al., Reference Grinsted, Moore and Jevrejeva2009; Kemp et al., Reference Kemp, Horton, Doonnelly, Mann, Vermeer and Rahmstorf2011). Beach ridges were abandoned on Bubiyan Island when RSL fell during cold periods, such as the LIA; beach ridges were not abandoned when RSL was stable or rising, such as during the MCA.

Steric sea-level changes (i.e., density changes in sea water generated by temperature [thermosteric] and salinity [halosteric]), may have contributed to regional RSL changes (Church et al., Reference Church, Roemmich, Domingues, Willis, White, Gilson, Stammer, Church, Woodworth, Aarup and Wilson2010b) during Late Holocene climate events. It is not yet resolved, however, how deep-ocean steric conditions affect semi-enclosed seas and continental shelves (Church et al., Reference Church, Woodworth, Aarup and Wilson2010a; Dangendorf et al., Reference Dangendorf, Frederikse, Chafik, Klinck, Ezer and Hamlington2021), because at the coast, ocean depth decreases to zero, and the steric height component of sea level vanishes (Bingham and Hughes, Reference Bingham and Hughes2012; Dangendorf et al., Reference Dangendorf, Frederikse, Chafik, Klinck, Ezer and Hamlington2021).
Although hydrographic records (Swift and Bower, Reference Swift and Bower2003; Good et al. Reference Good, Martin and Rayner2013), and comprehensive surveys of currents and water properties (Reynolds, Reference Reynolds1993) are deficient in the Gulf, El-Gindy and Eid (Reference El-Gindy and Eid1997) stated that seasonal temperature variations associated with the thermohaline circulation may be large; monthly mean thermosteric heights range from +2.2 cm in July to −2.1 cm in February (Hosseinibalam et al., Reference Hosseinibalam, Hassanzadeh and Kiasatpour2007). Compared to the southeastern part of the Gulf, the steric height is always lower in the northwestern and central regions where sea level is depressed by salinity (El-Gindy and Eid, Reference El-Gindy and Eid1997). Assuming that salinity increased during the Late Holocene because of increased evaporation at higher temperatures and decreased fresh-water input from the Shatt Al-Arab delta, the halosteric and thermosteric effects may have counteracted one another, but without knowing their magnitudes, the overall steric effect on RSL cannot be determined. Considering the powerful Shamal winds in the northern Gulf, steric changes also may have been affected by local wind forcing (Reynolds, Reference Reynolds1993; Dangendorf et al., Reference Dangendorf, Frederikse, Chafik, Klinck, Ezer and Hamlington2021).
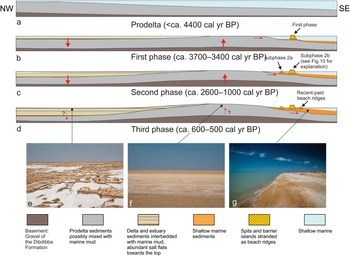
Over the past ca. 4000 yr, different parts of Bubiyan Island experienced different depositional environments. The interior of southern Bubiyan Island probably surfaced first as salt flats soon after the peak of the Holocene highstand (Figs. 2, 12, 13); major salt flats are still common, especially in the northern part of the island (Fig. 13e). Presently, the only indications of a nearby marine environment in the interior, now sabkha (Fig. 4a–d), are small, windblown shell fragments found on the surface. The area northwest of the interior was likely protected from dynamic shore processes because the emerging topography of the interior served as a barrier to the open sea and baffled waves and currents (Fig. 13b).
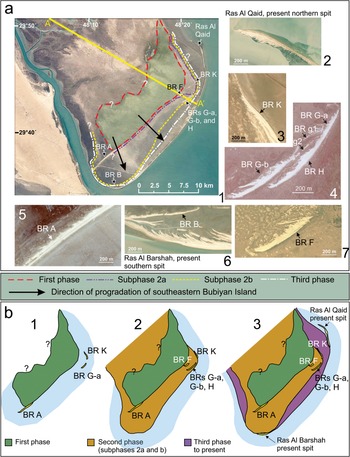
(a) A proposed model of the development of the southeastern part of Bubiyan Island. For closer detail of beach-ridge evolution, see Figures 9 and 10. Line A-A’ in a1 refers to the cross sections in Figure 13. The recurved shapes of the main beach ridges (a3–5, 7) are analogous to the present northern (a2) and southern (a6) spits. (b) A sequential schematic display shows the three phases of development of Bubiyan Island.

(a–d) Hypothetical, schematic cross sections (not to scale) depicting the development of Bubiyan Island during the Late Holocene (see line A-A’ in Figure 12a for approximate location). (a) Prodelta deposition; (b) First phase: the oldest spits, BRs G-a, and K form; (c) Second phase: BR G-a reactivated and accreted as BRs G-b (see Fig. 10); (d) recent-past, undated beach ridges; Third-phase beach ridges are preserved only in Area 1 (Fig. 9) and not along transect A-A’ in Area 2 (Figs. 10, 12). The red arrows indicate minor uplift, subsidence, and progradation of Bubiyan Island. (e) The present salt flat looking toward the northwest from the new “access highway” (see Fig. 1c); the salt flat was probably significantly more extensive during the First phase (widespread, but ephemeral salt flats presently form farther southeast as well, especially after heavy downpours). (f) Featureless sabkha; ephemeral lakes (see Fig. 3e) are common on the sabkha after heavy rains. (g) The current beach looking southwest at medium-high tide; coastal nabkhas to the right in the background. See Figure 7 for beach-ridge environment (area between photos f and g).

Abandonment of spits and shoals and progradation of southeastern Bubiyan Island appear to have occurred in three phases of decreasing RSL: ca. 3700–3400 cal yr BP, ca. 2600–1000 cal yr BP, and 600–500 cal yr BP, with RSL stability in-between (Table 1, Figs. 9–11, 12A). Abandonment of spits and shoals may have continued until the modern sea-level rise, but beach ridges ostensibly younger than the Third phase were not dated. The three phases apparently occurred during minor uplift of southeastern Bubiyan Island (Lees and Falcon, Reference Lees and Falcon1952; Kassler, Reference Kassler and Purser1973; Al-Asfour, Reference Al-Asfour1982) (Fig. 13), which probably reflects a slight forebulge (≤1–2 m) caused by sediment loading to the northwest. The uplift triggered progradation of the southeastern shoreline, as suggested by the apparently higher elevation of southeastern Bubiyan Island and drainage to the northwest (Lees and Falcon, Reference Lees and Falcon1952; Al-Hasem, Reference Al-Hasem1997).
The recurved ridges of the spits on Bubiyan Island (Fig. 12a2–7) mark former shorelines, indicating that spit aggradation was episodic, likely because of changes in sediment supply (van Heteren et al, Reference van Heteren, Oost, van der Spek and Elias2006; Wright et al, Reference Wright, Kruse, Forman and Harris2018). BRs G-a and G-b may have accreted episodically during a ca. 2000 yr span, given the vastly different ages of the proximal (BR G-a, 3850–3436 cal yr BP: sample 26) and distal (BR G-b, 1680–1314 cal yr BP; sample 29) parts of BR G (Fig. 10). Such millennia-scale records of spit evolution have been reported by Tillmann and Wunderlich (Reference Tillmann and Wunderlich2013), Wright et al. (Reference Wright, Kruse, Forman and Harris2018), and Bateman et al. (Reference Bateman, McHale, Bayntun and Williams2020). In the Gulf, Jameson and Strohmenger (Reference Jameson and Strohmenger2014) described how differences in ages of landward and seaward limits of a single spit in Qatar can be as much as 2000 years.
The Shatt Al-Arab delta appears to have contributed only negligible amounts of siliciclastic sediments to spit formation on Bubiyan Island, therefore spits depended almost entirely on a source of coarse bioclastic sediments, including large and spiny shells. Scheffers et al. (Reference Scheffers, Engel, Scheffers, Squire and Kelletat2011) stated that strong waves are needed to move substantial amounts of coarse material to build ridges above high tide level. Thus, a changing wave climate and variable abundance of shelly debris may have caused episodic deposition on Bubiyan Island beach ridges, with possible erosion between. Three main phases of beach ridge development can be recognized.
First phase: ca. 3700–3400 cal yr BP (ca. 1750–1450 BC)
During this phase, which was accompanied by RSL fall on Bubiyan Island and in the Gulf (Evans et al., Reference Evans, Schmidt, Bush and Nelson1969; Dalongeville, Reference Dalongeville, Calvet and Gachet1990; Jameson and Strohmenger; Reference Jameson and Strohmenger2014, Lokier et al., Reference Lokier, Bateman, Larkin, Rye and Stewart2015) (Fig. 2), a headland at the southern margin of the new interior (Area 1), perhaps merely a shoal, became an attachment point for a spit, BR A (3599–3197 cal yr BP; sample 83) (Figs. 9, 12b1), that had accreted toward the end of the Holocene highstand; a headland probably would not have formed had the area still been submerged. This spit accreted southwestward, consistent with the counterclockwise marine and longshore currents predominant today in this part of the northern Gulf (Alosairi and Pokavanich, Reference Alosairi and Pokavanich2017; Vaughan et al., Reference Vaughan, Al-Mansoori, Burt and Sheppard2019; Safarkhani et al., Reference Safarkhani, Yarahmadi, Hamzeh and Sharafi2021), and presumed to have been predominant in the Late Holocene.
BR A has been severely anthropogenically altered in recent times, but detailed field observations show that the beach faced southeast; the berm, where preserved, is behind the beach face; and washover fans are (poorly) preserved northwest of the berm. BR A originally may have been recurved like the current spit (Ras Al Barshah) in Area 1, but was straightened to form a road of crushed shells excavated from parts of BR A. A few laterals, which may initially have been more recurved, are still present (Fig. 12a5). The AMS date of 3599–3197 cal yr BP (sample 83) (Fig. 5) corroborates Al-Asfour's (Reference Al-Asfour1982) dates of 3040–2467 (BUB 1) cal yr BP, 3200–2680 (BUB 3) cal yr BP, and 3445–2882 (BUB 5) cal yr BP. Sample 83 was collected from the most pristine part of a small, relatively intact, narrow finger extending northwest from, and parallel to, BR A. Although the exact locations of Al-Asfour's (Reference Al-Asfour1982) samples are unknown, BR A is the only beach ridge containing shells in the area from which the three 14C dates could have been derived. The unspecified locations of samples BUB 1 and 3 were possibly from the road extending southwest from BR A (Figs. 5, 9); it is difficult to distinguish precisely where BR A ends. The road existed in 1982, and was referred to by Al-Asfour (Reference Al-Asfour1982) as “road.” Nonetheless, Al-Asfour's samples were probably obtained from less-disturbed localities, given the increased anthropogenic activity since 1982.
In Area 2, the spits that would become BRs G-a and K also developed from a new headland (possibly a shoal) concurrently with formation of the interior, but they were separated from the interior by a shallow lagoon (Figs. 10, 12, 13b). The initial spits of BRs G-a and K were relatively small (500–1000 m), and a continuous, exposed coastline connecting them was probably not yet present (Fig. 10). The lagoon to the west of BRs G-a and K, however, probably terminated as an indistinct tidal-dominated coastline (red, dashed line in Fig. 10). With a large horizontal distance between high and low tides, BRs G-a and K spits accreted laterally by wave-driven longshore drift (described as a dominant force in spit formation by Pedersen et al., Reference Pedersen, Deigaard and Fredsøe2008), which shaped the rounded outline of the northeastern shore of the embryonic Bubiyan Island (Fig. 10). As indicated by their recurved ridges, BRs G-a and K (Figs. 6, 12a3, 4) accreted in different directions (southwest versus northwest) from the same headland, but from different attachment points, probably because the curvature of the new headland caused changes in wave refraction and longshore drift directions. Ashton et al. (Reference Ashton, Nienhuis and Ells2015, p. 198) attributed such an “asymmetric wave climate as causing spits to extend in both the net downdrift and updrift directions.”
An 800-year interval of relatively stable sea level: ca. 3400–2600 cal yr BP (1450–650 BC)
None of the beach ridges of southeastern Bubiyan Island was dated to 3400–2600 cal yr (Table 1, Fig. 2a), during which time the RSL fall in the western Gulf, as depicted by Evans et al. (Reference Evans, Schmidt, Bush and Nelson1969), Lokier et al. (Reference Lokier, Bateman, Larkin, Rye and Stewart2015), and Reinink-Smith (Reference Reinink-Smith2015) (Fig. 2a, B), seems to have been slow and uniform. The sea-level curves of Dalongeville (Reference Dalongeville, Calvet and Gachet1990) and Jameson and Strohmenger (Reference Jameson and Strohmenger2012) (Fig. 2b) illustrate short-lived highstands followed by precipitous RSL falls and reversals. The general trend, however, is RSL fall after ca. 3000 cal yr BP. A requirement for spit and barrier formation is a relatively stable sea level (NOAA, 2019), which favors the sea-level curves of Evans et al. (Reference Evans, Schmidt, Bush and Nelson1969), Lokier et al. (Reference Lokier, Bateman, Larkin, Rye and Stewart2015), and Reinink-Smith (Reference Reinink-Smith2015). Hence, some barriers and spits in the lagoon of southeastern Bubiyan Island likely formed the foundations for beach ridges stranded during the Second phase. During this hiatus the First phase BRs G-a and K may have partially reactivated.
Second phase: ca. 2600–1000 cal yr BP (650 BC–AD 950)
This phase partly overlaps the Dark Ages cold period (ca. 1525–1100 cal yr BP; AD ca. 425–850) (Neukom et al., Reference Neukom, Steiger, Gómez-Navarro, Wang and Werner2019; Pascucci et al., Reference Pascucci, Frulio and Andreucci2019) and appears to have begun with a relatively steep RSL fall (ca. 2500–2000 cal yr BP) followed by a slight RSL fall (ca. 2000–1200 cal yr BP) (Figs. 2, 11)—events that seem to have spanned the Gulf. An abandoned reef platform in Qatar attests to sea level having dropped to near present levels by ca. 1900 14C yr BP±100 yr (Jameson and Strohmenger, Reference Jameson and Strohmenger2014) (Fig. 2b, 11). A progradational sabkha sequence in Abu Dhabi indicates that sea level had fallen to near present levels by 1440–1170 cal yr BP (Lokier and Steuber, Reference Lokier and Steuber2008) (Fig. 11).
Thus, with an apparent decrease in the Late Holocene sea-level rise during the Second phase, perhaps in addition to continued marginal uplift of southeastern Bubiyan Island, additional seaward-facing areas of the island that were established as spits and barriers became stranded (Fig. 12). The Second phase is hereafter subdivided into two subphases, 2a (ca. 2568–2010 cal yr BP) and 2b (ca. 1934–975 cal yr BP), to distinguish key periods of spit and barrier abandonment and major changes in the coastline (Table 1, Figs. 9, 10, 14).
In Area 1, subphase 2a is represented only by BR a1 (ca. 2233 cal yr BP; sample 87), which appears to be along a southwest extension of the shoreline that formed during subphase 2a in Area 2 (Fig. 12a). Except for the recent past, no beach ridges are preserved in the region between Areas 1 and 2, which appears to have been repeatedly flooded.
In Area 2, during subphase 2a, a new coastline exposed to waves and southwesterly longshore currents from the open sea was delineated by BRs g1 (ca. 2568, sample 26A), F (ca. 2476, sample 38), f2 (undated), f3 (ca. 2430, sample 42), with a likely continuation to a1 (ca. 2233 cal yr BP, sample 87) from Area 1 (Figs. 9, 10). Hence, during subphase 2a, BR G-a reactivated after a ca. 1000 yr hiatus to form BR g1, which accreted in a westerly direction, probably following longshore current directions around a curved headland. BR f1 (ca. 2010 cal yr BP; sample 44), which is younger than and located behind BR F, may have accumulated, or been reworked by tidal currents flowing past and behind BR F in the latter part of subphase 2a; the mollusk fauna from BR f1 indicates a shoal or low-energy beach, probably deposited at the high-tide mark. BR K may have accreted slightly during subphase 2a (undated segment northwest of BR K in Fig. 10).
During subphase 2a, the northern margin of BR G-a seems to have been perpendicular to an east-west trending tidal channel, as evinced by the orientation of BR J (Figs. 8, 10). A vague remnant of the southern bank of this tidal channel is still visible (Fig. 8); it probably has been demarcated more recently by high tides. BR k2 (ca. 2539 cal yr BP, sample 17A) may have formed as a shoal related to the initial formation of the tidal inlet; recurved ridges indicating accretion are not present (the small flood-tidal delta forming BR I formed later, during early subphase 2b).
In Area 1, over the interval separating subphase 2a (BR a1, ca. 2233 cal yr BP) from 2b (BR C, ca. 1738 cal yr BP), the shoreline stepped seaward ~4–5 km (Fig. 9). During subphase 2b, BR C delineated the southernmost shoreline of Bubiyan Island (Figs. 5, 9). If Al-Asfour's (Reference Al-Asfour1982) date of ca. 1616 (1874–1357) cal yr BP (BUB 6) is correct, it likely also was derived from BR C. The northeastern-most BR E age (ca. 975 cal yr BP, sample 68) is the oldest (subphase 2b) in a string of cheniers that developed southwestward mostly during the Third phase.
In Area 2, over the interval separating subphase 2a from 2b, the shoreline stepped seaward ~1000 m (Fig. 10). BR G-a accreted southwestward after a ca. 1000 yr hiatus (since the formation of BR g1) and possibly advanced through the most proximal part of what is currently BR H (ca. 1721 cal yr BP, sample 28), BR g2, to BR G-b (ca. 1497 cal yr BP, sample 29), which is the distal part of BR G-a. Tides appear to have flowed in and around the area between BRs G-a, g1, g2, G-b, and H, disrupting the continuity between BR G-a and G-b.
In the northern part of Area 2, BR K reactivated after an apparent ca. 1800 yr hiatus (or less, if reactivated during subphase 2a, as suggested by an undated segment northwest of BR K) and accreted northwestward to BR k1 (ca. 1877 cal yr BP, sample 12). The seaward-facing segment of BR k1 has since been eroded by tides and waves. Thus, ages decrease to the northwest from BR K (ca. 3643 cal yr BP, sample 6, to 1877, sample 12), and to the southwest from BR G-a (ca. 3643 cal yr BP, sample 26; ca. 2568 cal yr BP, sample 26a; ca. 1721 cal yr BP, sample 28; and 1497 cal yr BP, sample 29). BR g1 (sample 26a) branched off earlier, forming the proximal part of the southwest-trending shoreline that emerged during subphase 2a. BR g3 probably formed as a separate shoal or low-energy beach, prior to the bifurcation of BR G.
In Area 2, during subphase 2b, as the wave energy decreased, the shoreline prograded to the southeast. BR G bifurcated (ca. 1600 cal yr BP) giving rise to BRs G-b and H (Fig. 10), which subsequently accreted southwestward as separate spits. Pedersen et al. (Reference Pedersen, Deigaard and Fredsøe2008) explained such bifurcation as occurring when an updrift shoreline accretes, and the shoreline advances, a new spit may form in front and parallel to the original spit, but the new spit will have retreated relative to the original spit and may cut off sediment supply to the original spit. The advancement of BR H and continued RSL fall cut off sediment supply to BR G-b, which eventually became a barrier to the sea and prevented any further growth of BRs F, f1–f3, and other smaller shoals. As the RSL continued to fall, BR H likewise became isolated from the open sea and ceased to grow as waves and longshore currents lost their influence.
The tidal channel north of BR G-a (now filled by mud and silt) and its tributaries likely advanced as far as BR I (ca. 1934 cal yr BP, sample 21), at the northern bank of the tidal inlet. Storm tides surging in a northwesterly direction shaped BR I as the water fanned out to form a small flood-tidal delta (Figs. 8, 10).
A ca. 400-year hiatus between Second and Third phases: ca. 1000–600 cal yr BP (AD 950–1350)
This interval occurs mostly during the MCA (Fig. 11), which, in the Northern Hemisphere, is generally described as a warm period characterized by intense dryness (Fanget et al., Reference Fanget, Bassetti, Fontanier, Tudryn and Berné2016). Most Afro-Arabian onshore sites indicate a warm MCA (Lüning et al., Reference Lüning, Gaɫka and Vahrenholt2017), and several studies in the Mediterranean have highlighted warmer and drier conditions during the MCA (Wassenburg et al., Reference Wassenburg, Immenhauser, Richter, Niedermayr, Riechelmann, Fietzke and Scholz2013; Martinez-Ruiz et al., Reference Martinez-Ruiz, Kastner, Gallego-Torres, Rodrigo-Gámiz, Nieto-Moreno and Ortega-Huertas2015; Bassetti et al., Reference Bassetti, Berné, Sicre, Dennielou, Alonso, Buscail, Jalali, Hebert and Menniti2016; Pascucci et al., Reference Pascucci, De Falcob, Del Vaisc, Sannad, Melise and Andreuccie2018).
Sea level rose by 6 cm/century along the U.S. Atlantic coast from ca. 1000–600 yr BP, which spans the MCA and which, according to Kemp et al. (Reference Kemp, Horton, Doonnelly, Mann, Vermeer and Rahmstorf2011), probably can be extrapolated worldwide. Even a minor increase in sea-level rise of 24 cm in 400 yr would have affected the formation of spits and barriers on the low-lying Bubiyan Island. Pre-existing beach ridges from spits and barriers that had already been stranded during earlier phases would have been largely unaffected because of prior continuous progradation of the coastline. Warmer and drier conditions during the MCA probably also resulted in steric sea-level changes (Church et al., Reference Church, Gregory, Huybrechts, Kuhn, Lambeck, Nhuan, Qin, Woodworth, Houghton, Ding, Griggs, Noguer, van der Linden, Dai, Maskell and Johnson2001, Reference Church, Roemmich, Domingues, Willis, White, Gilson, Stammer, Church, Woodworth, Aarup and Wilson2010b), causing sea-level oscillations over a wide area (Baker and Haworth, Reference Baker and Haworth2000a, Reference Baker and Haworthb).
Barriers, spits, and shoals apparently continued to form on Bubiyan Island, but none was abandoned as beach ridges for an interval of ca. 400 yr, consistent with relatively stable RSL. A string of thin cheniers (unlabeled beach-ridge patches of BR E, Area 1) (Fig. 5) was deposited and perhaps somewhat redistributed by tides and waves during this 400-yr hiatus.
Third phase: ca. 600–500 cal yr BP (AD 1350–1450)
This phase coincides with a ~0.6° C drop in temperature in the Northern Hemisphere, onset of the LIA (Mann et al., Reference Mann, Bradley and Hughes1998), and short-term RSL fall (Fig. 11). In Area 1, the gently curved southern perimeter of the Bubiyan Island shoreline (Fig. 9) prograded to the southeast, as indicated by the string of successively younger (although mostly undated) cheniers and shoals of BR E developing toward the southwest: (ca. 975 cal yr BP, sample 68; ca. 616 cal yr BP, sample 66), to BR D (ca. 517 cal yr BP, sample 57). The oldest part of BR E (ca. 975 cal yr BP, sample 68) was stranded during the last part of subphase 2b. Cheniers of BR E were subsequently segregated into patches by rainstorms and tides. BR C (1738 cal yr BP, sample 54), abandoned during subphase 2b, was truncated by BR B. Storm surges entering a tidal inlet in the back-beach area of what would become the present spit, Ras Al Barshah, and rain deluges have since segregated BR B into segments BRs b1 (ca. 472 cal yr BP, sample 62) and b2 (undated). Torrential rainstorms (not tides) appear to cause most erosion on the present sabkha, and ephemeral lakes are common after such events (Fig. 4e).
In the southern part of Area 1, Al-Asfour's (Reference Al-Asfour1982) sample BUB 7, with an age of 2800–2290 cal yr BP, is problematic because its age falls partly within the hiatus between the First and Second phases, but mostly within subphase 2a, yet it seems to have been collected from a recent or possibly one of the sub-recent berms (Figs. 5, 9). Either the recent berm was contaminated by older shells (possibly from BR A, ~5 km to the northwest), the core of the recent berm formed concurrently with early subphase 2a, or the sample location was misidentified. Contamination from BR A seems unlikely, larger shells from BR A may have been scattered in the former back-beach areas where they were originally deposited in washover fans, but they appear not to have been transported across the sabkha between the beach ridges by natural processes such as rain, wind, or tides. Moreover, BUB 7 is ca. 200 yr younger than the youngest age for BR A (3040–2467 cal yr BP, BUB 1), and shells could not have been reworked from older, lithified outcrops because such outcrops are entirely absent on southeastern Bubiyan Island.
In Area 2, apparently, no beach ridges were stranded during the Third phase. Toward the end of the Third phase, the lingering lagoonal environment of southeastern Bubiyan Island successively turned into intertidal flats, followed by supratidal flats and sabkha. Windblown dust added additional sediments.
The present coastal area developed over the past ca. 500 yr. The most prominent new features are the Ras Al Qaid spit off the northern shore and the Ras Al Barshah spit off the southern shore (Figs. 1c, 12a2, 6, 6, b3). In the northeastern part of Area 2, the recent-past high-tide line remains close to the ancient, curved shoreline from subphase 2b, although high tides are now mostly blocked by a raised coastal dirt road. Most of the recently formed land consists of supratidal flats. Except for the northern and southern spits, which are currently accreting, most of the present coastline of southeastern Bubiyan Island is migrating landward and can be described as transgressive and retrogradational, probably owing to rising RSL during the past ca. 100 yr.
Beach-ridge abandonment contemporaneous with early Islamic activities
The coast of southeastern Bubiyan Island was in its Second phase (subphase 2b) of progradation during the Sasanian and early Islamic periods—a time of human-focused activities in Area 2. People were periodically visiting, or possibly occupying, BR G-a, which was a well-established but relatively small spit that had formed ca. 2000 yr earlier (sample 26, 3850–3436 cal yr BP, Fig. 6). Pottery of Sasanian and early Islamic periods on BRs G-a, g1, and G-b appears to have been shattered in situ by both natural and anthropogenic causes. The pottery probably shattered at different times since the Sasanian period and provides evidence that these beach ridges have not been reworked by the sea for at least ca. 1700 yr, if at all.
Besides the east-west oriented tidal channel north of BR G-a (Fig. 8), tidal tributaries most likely also curved back into the lagoonal areas, in the former back-beach areas, behind and between BRs G-a, g1, and G-b, as evinced by a string of sherds scattered mainly on these beach ridges (Fig. 8). This might have been the center of activity in this area; boats arriving with flood tides and leaving with ebb tides were likely protected from waves and found mooring in the back-beach areas.
Sherds were not found on any other beach ridges in Area 2, except for three fragments on prominent BR K (Fig. 8), which is the same age (3850–3436 cal yr BP) as BR G-a, but with a better-preserved berm. BR K was probably located adjacent to a shallow, off-shore, muddy shelf (as is the present beach), and exposed directly to surf from the Gulf, which provided no opportunity for sea-faring vessels to find safe harbor. Moreover, the lagoon in the sheltered area behind BR K may have been too shallow for sea-faring vessels, especially since there does not appear to have been any access via tidal channels, or the lagoon may already have dried up to form a supratidal flat or sabkha.
When were boats no longer able to use the tidal inlet to reach BRs G-a and G-b? Spits and islands in Area 2 had ceased to develop by the sixth century AD, when the shallow lagoon ultimately dried up to become a mud or salt flat. The tidal inlet, however, may have remained navigable for another few centuries, with tides preventing it from completely filling up with mud, and thus enabling visitors to reach the beach ridges by boat until approximately the eighth century AD. As the Late Holocene RSL continued to drop, and the tidal channel filled with mud and silt, the beach ridges would have become isolated from the sea, and human activities requiring sea-faring vessels would have ceased.
No pottery sherds were found on BRs F, I, or J, or on any of the smaller beach ridges or patches in Area 2 (Fig. 6). BRs f1–f3, g3, and k1–k3 appear to have been mere shoals, which may explain the absence of sherds. Moreover, by the time the smaller barrier islands and shoals had become stranded, the back-lagoon area already had been filling with mud, and in the absence of tidal channels it may have been too shallow for boats to traverse.
Even though it is closer to the mainland, Area 1 shows little evidence of human activity during the same time period as in Area 2. Only one small, non-descript sherd was found on each of BRs B and C (locations not recorded) (Fig. 5), and these sherds may have washed up from the sea. The comparative lack of human activity in Area 1 may reflect inaccessibility for sea-faring boats, lack of shelter from wind and waves, or unsuitability of those beach ridges for human activity for other reasons.
Why were the torpedo jars and other ceramics left on the beach ridges? Perhaps they were accidentally shattered by visiting fishermen and left where they broke. Alternatively, they may have been abandoned after their contents were transferred into less-fragile containers, and subsequent anthropogenic activities or natural causes through the centuries may have broken and fragmented what had originally been whole jars (Simpson, Reference Simpson, Potts, Roaf and Stein2003). Blair et al. (Reference Blair, Kennet and al-Duwish2012, p.16) suggested that the contents of torpedo jars were transferred to skin containers, which are “lighter, less fragile, and more malleable, making them much better suited than torpedo jars for mule or camel transportation into the interior.” This seems unlikely in the context of the Bubiyan finds, where transport into the interior would need to be by boat, possibly across a shallow lagoon, and then across the Khor Al-Subiya before reaching the Kuwait mainland (Fig. 1c).
Sherds of Sasanian and early Islamic periods were also found on the present-day berm, washover fans, and intertidal areas (Fig. 8). How did these old sherds end up on the present shore? In general, a complex history of naturally generated movements and repeated cycles of burial and exhumation can account for the scatter and migration of sherds. With no indication of beach-ridge erosion during or after the Sasanian and early Islamic periods, the sherds found on the present-day beach may have originated from broken jars discarded directly into the water from seafaring boats, possibly while entering or exiting the tidal inlet north of BR G-a (Fig. 8). The sherds then could have been preserved in the muddy shelf seaward of the beach. Much later, the wave base would have been lowered during storms, and sediments not normally agitated during fair-weather wave conditions would have been churned up. Sherds located near the sediment-water interface then could have been dislodged and washed up on the present beach.
Indications of an abrupt southeasterly coastline progradation at ca. 1972 cal yr BP
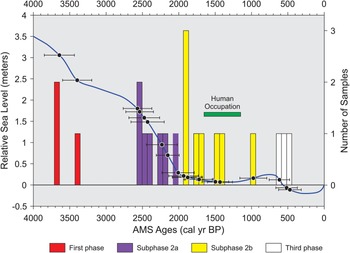
The distribution in time and space of the 21 AMS dates and the site of human occupation in Area 2 of this study reveal important details regarding the Late Holocene evolution of Bubiyan Island and the western Shatt Al-Arab delta. Figure 14 shows the distribution of the 21 AMS ages (listed in Table 1) relative to the three phases of beach-ridge evolution and human presence during subphase 2b. Fourteen AMS samples are from Area 2, 12 of which are from the Second phase. Thus, the timing of shoreline progradation and beach-ridge evolution is much better constrained in Area 2 than in Area 1, especially during the Second phase.
Histogram of midpoints of AMS ages from Table 1. Histogram bar widths are 71 years. A 76-yr gap, centered on 1972 cal yr BP, separates subphases 2a and 2b; this is when a major southwest progradation of the shoreline occurred. Superimposed on the histogram and the inferred RSL curve from Bubiyan Island (see also Figs. 2, 11) are the 21 AMS ages (black dots) of this study and their error bars. The 3.5 m RSL at 4000 cal yr BP is based on Reinink-Smith (Reference Reinink-Smith2015). All other RSL values are inferred.

Perhaps the most important inference that can be gained from the distribution of AMS ages is precise timing of the major southeasterly progradation of the shoreline between subphases 2a and 2b that occurred in both areas. Based on the ages in Table 1, this boundary is estimated to be at the midpoint of 2σ (ca. 1972 cal yr BP) of the 76-year interval between the youngest age included in subphase 2a (2010 cal yr BP, sample 44) and the oldest age included in Subphase 2b (1934 cal yr BP, sample 21). Between subphases 2a and 2b, the shoreline stepped seaward by ~4–5 km in Area 1 (Fig. 9) and by ~1 km in Area 2 (Figs. 9, 10).
The exact cause of the major progradational coastline shift between subphases 2a and 2b is difficult to determine, but it might reflect an abrupt increase in the northwesterly tilt of southeast Bubiyan Island, as indicated by the northwesterly drainage of wadis northwest of this study area (Fig. 1a). If the hingeline of this tilt was along a NE/SW axis (as would be expected if the tilt were caused by a forebulge from deltaic sediment loading), then the much greater southeasterly progradation (~4–5 km) of the shoreline in Area 1 could be explained by Area 1's location farther from the hingeline, more directly updip on the forebulge. In contrast, the lesser (~1 km) southeasterly progradation of the shoreline in Area 2 might reflect that area's location closer to the tilt axis, where it would have experienced less vertical uplift. The increased southeasterly progradation between subphases 2a and 2b on Bubiyan Island could also be a manifestation of a regional RSL fall that might become more apparent as more age data are obtained from coastal deposits elsewhere in the Gulf.
SUMMARY AND CONCLUSIONS
Bubiyan Island, the westernmost isolated prodelta lobe of the Shatt Al-Arab delta, developed by delta overflow from a paleochannel of the Euphrates River and first surfaced as a mud-salt flat ca. 4000 cal yr BP. Sediment loading northwest of Bubiyan Island caused minor uplift and progradation of the southeastern shoreline of the island. Drainage turned to the northwest, and newly formed spits established an incipient shoreline on the southeastern part of the island.
Three phases of minor (≤2 m) RSL fall (ca. 3700–3400 cal yr BP; ca. 2600–1000 cal yr BP; ca. 600–500 cal yr BP) caused stranding of small spits, barrier islands, and shoals to become beach ridges. A major southeasterly progradation of the shoreline, probably related to an abrupt increase in the northwesterly tilt of southeastern Bubiyan Island, occurred near the middle of the Second phase (ca. 1972 cal yr BP) in both Areas 1 and 2.
In the hiatuses (ca. 3400–2600 cal yr BP and ca. 1000–600 cal yr BP) between the three phases, RSL appears to have stabilized to near stillstands, during which times spits and barrier islands accreted, mostly toward the southwest. The stillstand between the Second and Third phases overlapped the warm interval of the MCA (ca. 1150–650 cal yr BP). The Third phase coincided with the LIA onset (ca. 630–150 cal yr BP) and short-term RSL reversals. As RSL continued to drop during the Third phase, growth of spits and shoals slowed as the lagoon to the northwest became increasingly shallow. After ca. 500 cal yr BP, undated beach ridges continued to form only close to the present shoreline.
The latter part of the Second phase coincided with human presence mainly on the spits that would become BRs G-a, g1, and G-b in Area 2. Sheltered moorage accessible through a navigable tidal inlet appears to have been available in the back-beach areas of the spits. Torpedo-jar pottery scatter indicates a Sasanian (ca. AD 300–650; 1650–1300 cal yr BP) to early Islamic (ca. AD 650–800; 1300–1150 cal yr BP) presence, most likely toward the latter part of this range.
Acknowledgments
The first author thanks Mohammed Al-Sarawi for introducing me to Bubiyan Island. This project would not have been possible without the generous issuance of permits by the Kuwaiti Department of Defense for visiting Bubiyan Island. The many random acts of kindness by the military personnel on Bubiyan Island enhanced the work experience—thanks for the many cups of tea! We are indebted to several reviewers for generously offering numerous insights and many constructive and invaluable comments on the manuscript: Brian Atwater, Nick Lancaster, Stephen Lokier, Vincenzo Pascucci, Jennifer Pournelle, James Shulmeister, David Van Alstine, and two anonymous reviewers. Thank you to Stephanie Zaborac-Reed for editing the manuscript. Funding for the research was sponsored by Kuwait University Research Grant, No. SE 01/16. The Kuwait University Research Administration supported the granting of the project and facilitated implementation of the research.
Supplementary Material
The supplementary material for this article can be found at https://doi.org/10.1017/qua.2022.3.