Introduction
Information about the yield of a crop during the growing season would be useful for grain marketing purposes as well as for informing input decisions. For example, the current fertiliser N recommendation system for cereals in Ireland allows for adjustment of fertiliser N inputs based on expected yield. However, the value of expected yield is determined as the largest whole-farm mean yield of the previous three seasons. This approach takes no account of seasonal variables, such as temperature and rainfall, which will have a significant influence on yield particularly under the variable climate that prevails in Ireland. In addition, it also takes no account of the variation in yield that can occur between and within fields.
Use of spectral reflectance measurements of crops has been widely researched as a means of estimating both grain yield and quality of cereal crops (Tucker, Reference Tucker, Holben, Elgin and McMurtrey1980; Sharma et al., Reference Sharma, Bu, Denton and Franzen2015; Magney et al., Reference Magney, Eitel, Huggins and Vierling2016). Typically reflectance at one or more wavelengths or wavelength bands in the visible and near infra-red regions of the spectrum are either directly related to yield or combined to produce a vegetation index. Variation in reflectance in the visible region of the spectrum, particularly at red and blue wavelengths is related to the leaf chlorophyll content while variation in reflectance in the NIR region is related to the amount of biomass or leaf area present. Both leaf chlorophyll content and leaf area change over a growing season, often independently, as the plant progresses through its life cycle. In addition the relationship between leaf chlorophyll and leaf area is influenced by management decisions, such as fertiliser inputs which as a consequence may have a significant effect on reflectance measurements.
The optimum growth stage at which to measure spectral reflectance in order to estimate yield appears to vary. A number of studies have indicated that reflectance around anthesis or early grain fill has the most potential to predict yield (Fetch et al., Reference Fetch, Steffenson and Pederson2004; Babar et al., Reference Babar, Reynolds, van Ginkel, Klatt, Raun and Stone2006; Magney et al., Reference Magney, Eitel, Huggins and Vierling2016). However Marti et al. (Reference Marti, Bort, Slafer and Araus2007) suggested that measurements made at early stem elongation could also give a good indication of yield. The condition of a crop, in terms of the amount of biomass present or the nutrient, particularly nitrogen, concentration of that biomass at any stage will be influenced by the management of that crop. Many studies have measured reflectance on crops receiving different levels of fertiliser N but with each level being applied on the same dates or at the same growth stages. In practice however the date or growth stage that fertiliser N will be applied will vary depending on factors such as weather conditions and availability of machines or labour. The effect of altering the timing of fertiliser N inputs has received relatively little attention in terms of its effects on reflectance measurements and consequent effects on the relationship between reflectance measurements and crop yield.
The objectives of this study were to identify if grain yield of high yielding winter barley crops grown under Irish conditions could be predicted using reflectance measurements and in particular to determine what effect altering the timing of fertiliser N inputs would have on the relationship between reflectance measurements and yield.
Materials and methods
Two series of field experiments were established at the Teagasc, Crops Research Centre, Carlow, Ireland (52.86o N, 6.92o W, 54 m a.m.s.l.). The soil was principally of a sandy loam texture except in 2015 when the soil was a medium clay loam. In each case the site had been in tillage for at least 20 years and the previous crop was a cereal.
The first series of experiments compared the response to fertiliser N of three cultivars of winter barley in the 2013 and 2014 growing seasons. A split-plot experimental design was used with five replications with cultivar (KWS Cassia, a two-row type; Leibniz, a six-row type; Volume, a six-row hybrid type) as the main plot factor and N application rate (100, 140,180, 220, 260 kg N/ha) as the split plot factor. N rates were applied in two applications, 33% at the onset of growth in early to mid-March and the remainder at GS30-31. Plot size was 12 m × 2.2 m.
The second series of experiments compared the effect of altering the timing of the initiation of the fertiliser N applications and was carried out over three growing seasons between 2013 and 2015. In each experiment three timings (‘early’, ‘mid’ and ‘late’) of the initial application of fertiliser nitrogen were examined. The first application of fertiliser N was applied to the ‘early’, ‘mid’ and ‘late’ treatments in late February/early March, mid-March and late March/early April, respectively. In addition to timings, the experiments compared treatments where different proportions of the total amount of N (30%, 50% and 70%) were applied in the first application. A total of 180 kg N/ha was applied in each experiment as CAN in two applications, with the second application being made 20–30 days after the first application. Crops were sown in early October and received standard inputs of pesticides to control weeds, diseases and pests. Nutrients other than nitrogen were applied uniformly over the experimental area at rates equal to or higher than the standard recommendations for winter barley (Coulter and Lalor, Reference Coulter and Lalor2008).
Canopy reflectance was measured using a hand held Crop Circle ACS 470 instrument (Holland Scientific Inc., Lincoln, Nebraska, USA) which is an active sensor emitting white light (∼400 to ∼800 nm) and measuring reflectance in three user determined wavelengths. For this study reflectance was determined at 760, 730 and 670 nm. At each measurement date 25–35 readings were made in each plot at a height of ~0.7 m above the crop canopy, avoiding plot edges. Measurements were made at a range of dates in each experiment. Grain yield (adjusted to 85% DM) was determined using a small plot combine harvester.
Two vegetation indices were calculated as
 $$NDVI{\,\equals\,}{{R_{{760}} {\,\minus\,}R_{{670}} } \over {R_{{760}} {\plus}R_{{670}} }}$$
 $$NDRE{\,\equals\,}{{R_{{760}} {\,\minus\,}R_{{730}} } \over {R_{{760}} {\plus}R_{{730}} }}$$
where R760, R730 and R670 are reflectance at 760, 730 and 670 nm respectively.
Data was initially subjected to analysis of variance. For the nitrogen rate experiments the relationship between NDRE and yield was examined using regression analysis for individual seasons and for data combined over the two seasons. Linear and quadratic models, each with and without variety specific coefficients, were fitted and the model with the highest r2 chosen. For the nitrogen timing experiments Pearsons simple linear correlation coefficients between vegetation indices and grain yield were calculated.
Results
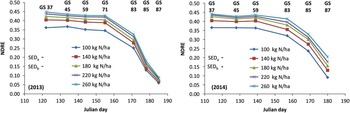
The effect of rates of fertiliser N application on the NDRE from flag leaf emergence until the end of the grain filling period is presented in Figure 1. In general NDRE for a particular N application rate remained constant or decreased slowly as the crop progressed from flag leaf emergence until the completion of anthesis and then declined quickly thereafter. At measurement dates before the onset of grain filling NDRE increased in response to additional fertiliser N but the increase was progressively less as fertiliser N level increased. There were significant differences between varieties in the progression of NDRE over time with NDRE of Volume declining more rapidly than that of either Cassia or Leibniz.
Effect of fertiliser N application rate on progression of NDRE over time in 2013 and 2014. NDRE data are means for three cultivars. GS-growth stage. SEDa–standard error of difference for comparison within a growth stage. SEDb–for comparison between growth stage.

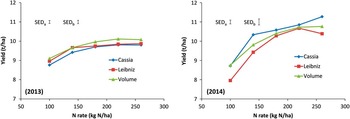
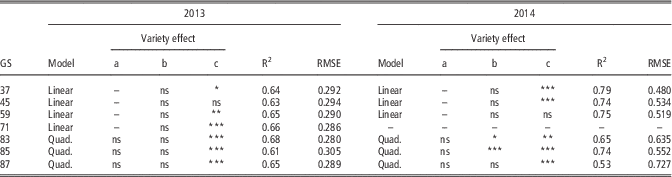
The effect of fertiliser N application rate on grain yield is presented in Figure 2. There was a greater response in grain yield to fertiliser N, and consequently a greater range in yield, in 2014 compared to 2013. NDRE had a higher correlation than NDVI with yield on the majority of occasions in both seasons in the N response experiments. When NDRE at individual sensing dates was related to yield a linear relationship (r2=0.63–0.66 in 2013 and r2=0.74–0.79 in 2014) was detected for the first four dates in 2013 and the first three dates in 2014 corresponding to the period between flag leaf emergence and the end of anthesis (Table 1). During this period varietal differences were observed for the intercept, but not the slope, of the linear relationships for two of the first three dates in each season. After this period, as the crop began grain filling, quadratic relationships were detected between NDRE and yield on the majority of occasions with varietal effect on the relationships again detected on the majority of the occasions.
Effect of fertiliser N application rate on grain yield in 2013 and 2014. SEDa–standard error of difference for comparisons within a cultivar. SEDb–standard error of difference for comparison between cultivars.

Characteristics of regression models between grain yield and NDRE of winter barley at a range of growth stages (GS) in 2013 and 2014. Models were either linear (y=bx +c) or quadratic (y=ax2+bx +c) with a significant variety effect indicating that separate values for the coefficients (a, b or c) gave a higher r2

*** P<0.001 ** P<0.01 * P<0.05 ns not significant
In order to determine seasonal effects reflectance data for the first three dates in the two seasons was combined and the relationship between NDRE and yield examined. This analysis revealed that there was a significant year effect on the relationship between NDRE and yield. When using the combined data no variety effect was detected for the relationship between NDRE and yield.
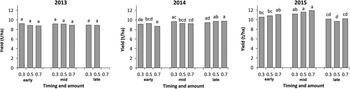
The effect of fertiliser N timing on grain yield is presented in Figure 3. Grain yield differences between the ‘early’ and ‘mid’ treatments were generally small and not statistically significant with any differences that did occur being in favour of the mid-March timing (‘the mid treatment’). Surprisingly, even where the first N application was delayed until late March/early April yield was significantly reduced in only one season compared to the ‘mid’ timing. However, this late treatment tended to result in late maturing tillers, particularly where the proportion applied in the first application was small. Increasing the proportion of the total applied in the first application tended to give reductions in yield, albeit often not statistically significant, in each experiment except in 2015.
Effect of timing and size (30–70% of total N) of the first N application on grain yield of winter barley (cv. Cassia). Total N was applied in two applications beginning in late February/early March (early), mid-March (mid) or late March/early April (late). The proportion of the total N applied in the first application is given by 0.3, 0.5 or 0.7. Bars with the same letter are not significantly different (P>0.05).

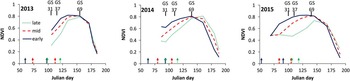
While timing of the initiation of fertiliser N applications had relatively small effects on grain yield there were considerable effects on reflectance measurements made during the season (Figure 4). Trends in NDVI were closely mirrored by trends in NDRE, so only NDVI results are presented. Initiating fertiliser N application in late February or early March, the ‘early’ treatment, resulted in higher NDVI than the other treatments during the stem elongation phase of growth. Delaying the first N application until the ‘mid’ and ‘late’ timings gave progressively lower NDVI at the early measurement dates. However as the crop approached anthesis differences in NDVI between the timing treatments declined such that at anthesis differences between the three timing treatments were small in two of the three seasons. Altering the proportion of N applied in the first application had only small effects on NDVI throughout the measurement period compared to altering the timing of the first N application (data not shown).
Effect of timing of the first N application on NDVI during the growing season. Data are from treatments receiving 30% of total N in the first application. Arrows indicate the dates of application of fertiliser N for the respective timing treatments.

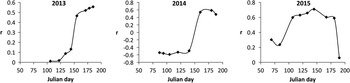
Correlations coefficients between NDVI and yield are presented in Figure 5. Correlations in the early part of the growing season varied depending on the season, ranging from a negative correlation in 2014 to a positive correlation in 2013 and 2015. Correlations were at or near their highest and consistently positive between Julian day 145 and 160 which corresponded to the period between ear emergence and anthesis. Thereafter the correlation varied, increasing in 2013 and decreasing in 2014.
Pearson correlation coefficients between NDVI and both yield and protein over the course of three growing seasons.

Discussion
The seasonal effect on the relationship between vegetation index and yield, detected in the nitrogen response experiments, and the effect of altered timing of fertiliser N inputs on vegetation index indicates that use of vegetation indices to provide estimates of grain yield requires careful consideration of many factors.
Even though grain yield was largely unaffected by application timing of fertiliser N, large differences in vegetation indices were observed during the stem extension phase of crop growth. This indicates that using reflectance measurements made during that period to estimate harvest parameters, particularly yield is unlikely to produce reliable results. Fetch et al. (Reference Fetch, Steffenson and Pederson2004) made similar findings using different varieties and fungicide levels while Magney et al. (Reference Magney, Eitel, Huggins and Vierling2016), working with wheat, found that NDVI measurements made during the heading phase were more closely related to yield than measurements made at earlier dates.
Yield in barley is known to be strongly related to the number of grains per unit area which in turn is related to the number of ears per unit area (Kennedy et al., Reference Kennedy, Bingham and Spink2017). Since the number of ears per unit area will have been largely determined as the crop approaches anthesis it stands to reason that reflectance measurements made at this stage would be more closely related to yield than measurements made earlier in the season before final ear number has been determined.
One of the objectives of the work was to determine if reflectance-based yield estimates could be used to guide input levels. The majority of inputs will be made to an established winter wheat crop during the period of stem extension. The large differences in reflectance measurements observed between treatments that ultimately had similar yield as a result of changes in the timing of fertiliser N inputs indicates that reflectance based yield estimates are of little value during this period. The relative consistency of measurements made between flag leaf emergence and early grain fill suggest that yield estimates during this period may be more useful in managing inputs particularly late application of fertiliser N or fungicides.
Some authors have reported better relationships between reflectance and harvest parameters when measurements at more than one date are taken into account (Li-Hong et al., Reference Li-Hong, Wei-Xing and Lin-Zhang2007). Magney et al. (Reference Magney, Eitel, Huggins and Vierling2016) used the rate of change of NDVI over different growth periods and the duration of these periods to predict harvest parameters including yield. However given the differences in the rate of change of NDVI over time observed in this study as a result of differences in timing of fertiliser N inputs it is likely that systems that use multiple NDVI observations over time will require that crop input timings are carefully managed in order to ensure that they do not differ substantially from the conditions under which prediction equations have been obtained.
Conclusions
Crop management, particularly the timing of fertiliser N inputs, can have significant effects on reflectance measurements early in the growing season, reducing their predictive ability in terms of yield. Reflectance measurements made around anthesis in high yield barley crops are best related to grain yield and will reduce effects of crop management, such as differences in timing of application of N fertilizer, on the relationship between vegetation index and yield.