I. INTRODUCTION
Ultra high-temperature ceramics (UHTC) comprise a class of materials characterized Reference Wuchina, Opila, Opeka, Fahrenholtz and Talmy1–Reference Johansson, Helmersson, Hibbs and Sundgren3 by high-melting points, chemical inertness, high hardness, Reference Zerr, Miehe and Riedel4–Reference Limeng, Feng and Yu7 and moderate oxidation resistance. Reference Carney, Parthasarathy and Cinibulk8–Reference Parthasarathy, Rapp, Opeka and Kerans16 These ceramics typically comprise either group IVB or VB transition metals bonded with boron, carbon, or nitrogen. Based on the M:X ratio, where M is the metal species and X is the interstitial light element (boron, carbon, or nitrogen), various metal-rich M6X5, M4X3, M3X2, and/or M2X compounds can be stabilized. The properties of these UHTCs can be further engineered to achieve specific performance metrics by tailoring the phase types and fractions within the microstructure. In this work, the oxidation behavior of hafnium nitrides with various tantalum nitride alloying additions has been investigated. To the authors’ knowledge, there have not been any studies addressing how tantalum nitrides may alter the oxidation behavior of the hafnium nitrides.
Oxidation in ceramics commonly occurs by matrix diffusion-controlled Reference Shimada9,Reference Shimada10,Reference Shimada and Inagaki12,Reference Shimada, Nakajima and Inagaki13,Reference Desmaison, Alexandre and Desmaison17 and/or boundary-controlled processes. Reference Shimada11,Reference Desmaison, Alexandre and Desmaison17–Reference Opeka, Talmy, Wuchina, Zaykoski and Causey19 In diffusion-controlled conditions, the oxidation rate can be regulated by the diffusion rate of oxygen or metal through the oxide product. In a boundary-controlled process, cracking within the microstructure provides fast-track pathways for the oxygen to penetrate deeper into the material and accelerate oxidation. The hafnium nitrides have been reported to exhibit both matrix diffusion- and boundary-controlled oxidation mechanisms. Reference Desmaison-Brut and Montintin18,Reference Wuchina20
During this oxidation process, an oxide scale typically forms. The low plasticity of the oxide scale can hinder the relaxation of the scale’s growth stresses. This leads to microcracking and decohesion of the scale-termed spallation. Reference Desmaison, Alexandre and Desmaison17 Hence tailoring of phases and compositions that can lead to the formation of an adherent, protective oxide scale is advantageous in that it can reduce the matrix and/or boundary oxidation. Reference Desmaison-Brut and Montintin18
Hafnium oxide has three polymorphs, which are the following: (a) monoclinic α-HfO2 (P21/c), which forms below 1743 °C, (b) tetragonal β-HfO2 (P42/nmc) that forms above 1743 °C, and (c) cubic δ-HfO2
 $\left( {Fm\bar 3m} \right)$
, which is stable above 2200 °C up to the melting point.
Reference Okamoto21,Reference Shin, Arroyave and Liu22
If the oxide scale forms on the nitride matrix and/or goes through a series of temperatures where one of these phase transitions occurs, the volumetric change will generate additional stress states that can promote decohesion. Desmaison-Brut and Montintin
Reference Desmaison-Brut and Montintin18
reported that the oxidation rate for hafnium nitride was lower between 800 and 1000 °C as compared to higher temperature exposures because of a possible intermediate oxynitride phase that had similar kinetic behavior as the monoclinic α-HfO2. Their work was carried out in a carbon dioxide environment. To date, little work has been done exploring the structure or composition of this oxynitride phase or how tantalum nitride additions may influence its formation. In this research, hafnium nitride with various amounts of tantalum nitride, processed by vacuum plasma spray deposition, was studied. The oxidation behavior is addressed as a function of phase content and the formation of complex oxide scale products.
II. EXPERIMENTAL
A. Materials and methods
Four specimens of (HfN)1−x (TaN) x , where x is based on the starting blended powder compositions of 0.0, 18.8, 28.1, and 46.7 at.%, were fabricated by vacuum plasma spraying (VPS). The specimens are referenced based on the ratio of the starting blend powders. Postspraying, the ceramics were chemically analyzed by a light element combustion analysis technique, commonly referred to as LECO testing, to determine any compositional changes that could occur during VPS. The VPS process flows powders into a plasma torch where they are melted and form a rapidly solidified deposit on a substrate surface, which for these materials was a graphite mandrel. Hence, the molten powders and resulting deposit can change composition due to vapor pressure differences between the powders’ constituents and yield a final phase content different than the initial phase content.
The starting blend powders, δ-HfN and δ-TaN, were sieved with a 325 mesh. These powders were synthesized via a self-propagating high temperature synthesis (SHS) reaction of tantalum and hafnium in the presence of nitrogen. The initial tantalum and hafnium had a purity of 99.5 and 99.2%, respectively. After SHS, the δ-TaN and δ-HfN were determined to contain 46.7 and 49.0% at.% nitrogen, respectively, with less than 800 ppm of oxygen.
A custom-constructed VPS stainless steel chamber was evacuated to 10 Pa using mechanical pumps, whereupon it was backfilled with argon to a pressure of 26.6 kPa. Reference Schulz, Wang, Morris, Butts and Thompson23 A volume mixture of 70:1 Ar:H2 served as the plasma gas for the feedstock powder through the VPS tungsten cathode plasma gun operated at a processing power of 45 kW. This gas composition has been shown to increase the processing temperature and lower porosity in deposited material. Reference Schulz, Wang, Morris, Butts and Thompson23,Reference Trignan-Piot, Berardo, Gastaldi and Giorgio24 The as-sprayed material was deposited to an approximate thickness of 20 mm. Post-VPS fabrication, the nitride material was mechanically sectioned into 250 mm × 200 mm × 20 mm test specimens for the characterization and oxidation studies.
B. Specimen characterization
The characterization of the nitrides consisted of optical and electron beam imaging as well as electron and x-ray diffraction (XRD) analysis for the preoxidation and postoxidation conditions. A FEI F20 Tecnai (scanning) transmission electron microscope (STEM), operated at 200 keV, was used to provide both microstructure imaging and chemical analysis using electron dispersive x-ray spectroscopy (EDS). For the microstructure imaging, high-angle annular dark field (HAADF) was used, as it is based on atomic number or Z-contrast imaging, Reference Williams and Carter25 which readily reveals chemical partitioning between the phases, i.e., hafnium and/or tantalum-rich phases will appear bright because of their higher atomic number than a light element—oxygen or nitrogen–phases. The TEM specimens were prepared using a FEI Quanta 3D Dual electron beam-focus ion beam (FIB) microscope that permitted site specific extraction and thinning of the desired TEM foils. Reference Morris, Wang, Thompson and Butts26,Reference Morris, Wang, Matson and Thompson27 Scanning electron microscopy (SEM) imaging of the initial powders as well as the preoxidation and postoxidation surfaces was performed in a JOEL 7000 SEM operated at 20 keV. This microscope was equipped with the Oxford Instruments electron backscattered diffraction (EBSD) platform, which provided phase identification within the microstructure images. The SEM specimens were mounted and mechanically polished using a 3 μm diamond paste with a further polish for 24 h in aqueous 0.05 μm silica slurry using a Vibromet. Reference Morris, Wang, Thompson and Butts26,Reference Morris, Wang, Matson and Thompson27
The phase content was identified by XRD using a Bruker D8 Discovery General Area Diffraction Detector System operated with Cu Kα radiation as the source at a setting of 45 keV and 40 mA. All XRD scans were taken from the exposed top surface of the bulk of the specimen. The collected peaks were compared with the phase data found in the International Center for Diffraction Data (ICDD), given in Refs. 28–48. Prior to XRD analysis, the preoxidation specimens were crushed and ground using a mortar and pestle, which ensured a random texture and sufficiently large sampling volume from the powder particulates. Postoxidation XRD analysis was conducted directly on the scale formed on the surface. An XRD line scan was also conducted with a 0.8 mm spot size with 0.01 mm steps for dwell times of 180 s. The reported accuracy of significant figures is based on the 2θ step size.
C. Specimen oxidation
In the oxidation experiment, both the pre- and postoxidation specimen masses were measured. The samples were cut to be approximately 12 mm × 12 mm × 12 mm. Since slight sample size variations could exist among them, the mass change for each composition is reported as a percentage change with respect to its initial mass allowing a direct comparison among them. The specimens were placed in silica boats and heated under atmospheric conditions in a 99.5% alumina tube inserted in a Sentro Tech Corp 1700 high-temperature tube furnace with MoSi2 heating elements. The specimens were heated from room temperature to either 700, 1200, or 1700 °C. The 700 and 1200 °C maximum temperature experiments consisted of heating to 200 °C at a 20 °C/min, where it was held for 10 min, then ramped up to the targeted maximum set point at a rate of 10 °C/min, where it was held for an hour and then allowed to cool to room temperature, which took approximately 2 h. The 1700 °C maximum temperature experiments were the same up to 1200 °C but followed with a 10 min hold at 1200 °C and then ramped to 1700 °C at the same rate, where it was held for one hour and allowed to furnace cool afterward, which took approximately 3 h. This heating procedure was the furnaces manufacturer’s recommendations to achieve the higher temperature set points.
III. RESULTS
A. Preoxidation
The average initial powder sizes were between 6–7 μm for both δ-HfN and δ-TaN powders. The as-sprayed specimen porosity and nitrogen content is tabulated in Table I. The porosity was measured using the Delesse Principle, which compares the surface area fraction of the total pore count divided by the total surface area of the image. Reference Weibel49 The nitrogen measurements were provided by the light element combustion analysis technique, commonly referred to as LECO testing.
Analysis of the four (HfN)1−x (TaN) x , where x is the starting blend composition of 0.0, 18.8, 28.1, and 46.7 at.%. Post-VPS processed data of the porosity and nitrogen content.

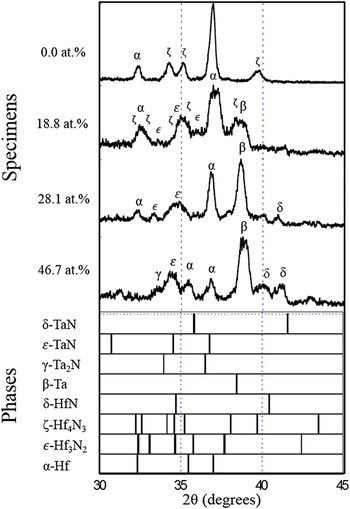
The XRD scans for the four preoxidized nitride specimens confirmed the phases of α-Hf, β-Ta, δ-HfN, δ-TaN, ε-Hf3N2, ζ-Hf4N3, and γ-Ta2N, Figure 1. The identification of the metal and metal-rich nitrides confirmed the loss of nitrogen, as noted in the LECO measurements.
Preoxidation normalized XRD scans for the (HfN)1−x (TaN) x specimens, where x is the starting blend 0.0, 18.8, 28.1, and 46.7 at.%. The various phase indicators are presented below for the four specimens with the Greek annotated symbols for the identified phases placed above the experimental XRD peaks.

B. Oxidation treatment
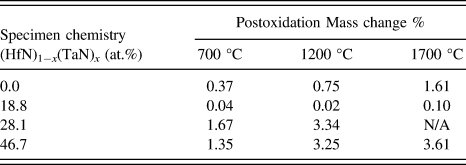
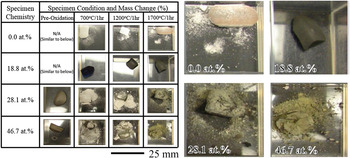
In the oxidation experiments, an increase in maximum temperature led to an increase in mass change, Table II. Pre- and postoxidation optical images of the specimens are shown in Figure 2, with magnified images for clearer viewing provided to the right of the image. Comparing Table II and Fig. 2, as the mass change increased, there was a corresponding presence of an oxide scale, evident by the change in color of the specimens and prevalent powder (which is the delaminated scale) around the bulk of the specimen. The only exception with respect to the spalling was the 18.8 at.% specimen, which had a dark-colored scale as compared to the white or brown color observed in the other specimens.
Postoxidation mass change for the (HfN)1−x (TaN) x nitrides, where x is the starting blend amount of 0.0, 18.8, 28.1, and 46.7 at.%.

Pre- and postoxidation optical images of the (HfN)1−x (TaN) x , where x is starting blend composition of 0.0, 18.8, 28.1, and 46.7 at.%. Note the dark scale and lack of oxide powder for the 18.8 at.% specimen compared to the other specimens. Enlarged images for each specimen from the 1700 °C/1 h are provided for easier viewing.

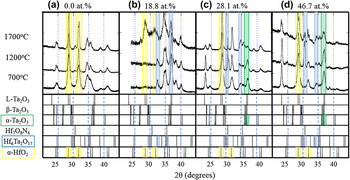
The oxide scale phases for all the postoxidized specimens are shown in the XRD spectra in Figs. 3(a)–3(d). Because of the multiphase nature of the specimens and the various oxide possibilities, there are several overlapping diffracted peaks. This is evident by considering each phase’s line indicators shown at the bottom of each XRD scan in Fig. 3; the reader is referred to Fig. 1’s XRD line indicators for the metallic and metallic nitride phases. Consequently, phase identification was challenging. In cases of peak overlap, we have complimented our XRD phase identification using the visual cues from the oxide scale color in deducing the dominate phase, i.e., a white scale supported the presence of HfO2 verses a brown scale suggesting a dominate Ta2O5 phase. This does not necessarily discredit that other phases, where peak overlap occurs, are not present, but it does help in determining the most likely or dominate phase fraction. To assist the reader, we have highlighted the most dominate oxide phases to each experimental XRD scan with a faint-colored box—the yellow denotes α-HfO2, light blue Hf6Ta2O17, and light green α-Ta2O5.
Postoxidation normalized XRD scans for the (HfN)1−x (TaN) x , where x is the starting blend composition of (a) 0.0, (b) 18.8, (c) 28.1, and (d) 46.7 at.%. The possible oxide phase identification information is placed below each scan. Specifically, faint color boxes are provided over the experimental and phase indicator data to help and guide the reader to the dominate oxide phases identified. The yellow denotes a-HfO2, light blue Hf6Ta2O17, and light green a-Ta2O5.

Those specimens with dominant white-colored scale/powder had strong α-HfO2 peaks located at 28.36° and 31.68° 2θ. The specimens that developed a brown-colored scale, notably the 28.1 and 46.7 at.% heated to 1700 °C, have a high-intensity α-Ta2O5 peak at 35.5° 2θ. This is a clear case of the need for cross correlation to the visual oxide scale color. One may note that hafnia also has peaks near 35° 2θ, but in Fig. 2, a brown oxide scale is observed indicative that Ta2O5 is present even though the hafnia peak at 28.4° 2θ (no overlap with tantalum oxide) can be seen. Similar to hafnium oxides, tantalum oxides have different polymorphs at different temperatures. These are the orthorhombic L-Ta2O5 (Pmm2) (below 700 °C),
Reference Klechkovskaya, Pinkser and Khikova50
triclinic β-Ta2O5
 $\left( {P\bar 1} \right)$
(stable between 700 °C and 1320 °C), and monoclinic α-Ta2O5 (C2/m) (1320 °C till its melting temperature at 1872 °C)
Reference Reisman, Holtzberg, Berkenblit and Berry51
phases.
The 18.8 at.% specimen, which had a dark-colored scale, Fig. 2, had XRD peaks—33.7° and 34.4° 2θ—that could be indexed to the orthorhombic Hf6Ta2O17 phase 48 at each temperature condition, highlighted by the faint blue box. Though the peak near 35° 2θ also overlaps the hafnia and tantalum oxides, the color of the scale suggests that this peak is not from those phases. The dark scale color for the 18.8 at.% specimen, as well as the lack of experimental diffraction peaks for either hafnia or tantalum oxide between ∼25 to ∼30° 2θ, adds further evidence that the scale is Hf6Ta2O17. At 1700 °C, the presence of α-HfO2, α-Ta2O5, became more readily apparent.
IV. DISCUSSION
The post-VPS process (HfN)1−x (TaN) x specimens’ combustion analysis, Table I, indicated that the nitrogen content was depleted from the initial blend mixture upon spraying. In the case for the Hf:N ratio, as nitrogen is lost, the metal-rich rhombohedral ζ-Hf4N3 and ε-Hf3N2 phases were stabilized; similarly, as nitrogen was lost in the Ta:N ratio, a hexagonal γ-Ta2N phase precipitated. In addition, all the specimens showed some fraction of elemental hafnium and/or tantalum. As a consequence of this multiphase microstructure, a complex oxidation behavior occurred.
The control 0.0 at.% specimen (no TaN addition) had moderate mass changes as compared to either the 28.1 or 46.7 at.% specimens, Table II. The XRD scale (28.4° 2θ) of this specimen was indexed as α-HfO2, confirming that the white powder was hafnia. In contrast, the 28.1 and 46.7 at.% had a strong primary β-Ta peak in the postsprayed condition. Since tantalum Reference Humphrey52 oxidizes faster than hafnium Reference Humphrey53 and was prevalent in the material, this explains the observed poorer oxidation resistance. The XRD scans of these scales were primarily α-HfO2 and α-Ta2O5. The change in oxide scale resulted in a change in color from white to brown as seen in Fig. 2.
The specimen with the lowest mass change, 18.8 at.%, contained a lower β-Ta peak as compared to α-Hf and prevalent close-packed-like structures of ε-Hf3N2, ζ-Hf4N3 and γ-Ta2N phases, Fig. 1. The low mass change for this 18.8 at.% specimen was also in agreement with the XRD phase identification that this specimen did not readily oxidize, Table II, or spall, Fig. 2. At 1700 °C, the 28.4° 2θ peak for α-HfO2 was evident for this specimen, and the onset of a white scale powder was noted (Fig. 2), which coupled well with a subtle mass change tabulated in Table II. At each oxidation temperature, this specimen had the clearest XRD evidence for the Hf6Ta2O17 phase, Fig. 3. Though the higher tantalum nitride content specimens, 28.1 or 46.7 at.%, also could be indexed with this phase, the scale color change to brown is suggestive that Ta2O5 was dominate. By alloying the hafnium nitride with a smaller amount of tantalum nitride, i.e., 18.8 at.%, the system appears to be able to provide an adequate balance of tantalum to promote the formation of the Hf6Ta2O17 scale without the deleterious effects of Ta2O5 or even HfO2. The complex nature of this orthorhombic oxide scale appears to reduce the rate of oxidation of the nitride.
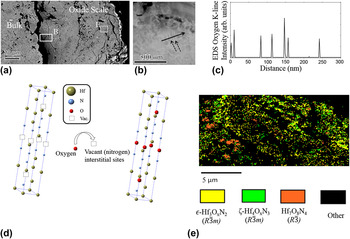
A TEM foil was extracted near the scale-bulk interface, shown in the boxed region labeled (B) for the SEM micrograph in Fig. 4(a), for the 18.8 at.% specimen at 1700 °C. The Hf-rich phase lathes, indicated by the dash arrows, are evident in the STEM-HAADF micrograph in Fig. 4(b) by their bright (metal-rich) contrast. Figure 4(c) is the EDS line scan (solid arrow) for oxygen content, which increases as the probe is scanned over each of the Hf-rich phases. This is suggestive that these particular metal-rich nitride phases act as oxygen “getters.” As noted in the SEM micrograph, Fig. 4(a), the oxide scale does show numerous microcracks, where oxygen could penetrate into the material through the scale, though caution should be used to deduce if prevalent cracking existed at the elevated temperature or was a consequence of thermal contraction between all the phases upon cool down for postmortem examination.
The 1700 °C postoxidation (HfN)1−x (TaN) x x = 18.8 at.% specimen (a) SEM micrograph revealing the bulk and oxide scale interface with regions of interest for the (S)TEM foil lift out by FIB—denoted as box (B)—and EBSD phase map region box (E). (b) STEM-HAADF micrograph, which dash arrows point to the Hf-enriched nitride lath-like microstructure. The solid arrow indicates the EDS line scan direction. (c) STEM-EDS line profile revealing increases in the oxygen intensity at the Hf-enriched nitride lath positions. (d) Proposed oxygen filling of interstitial vacant sites in the Hf-rich nitride rhombohedral structures. (e) EBSD phase map revealing transitional oxynitride phase formations within the scale.

These metal-rich rhombohedral ζ-Hf4N3 and ε-Hf3N2-based structures Reference Rudy54 may provide for the nucleation sites for the prior reported oxynitride Hf7O8N4 phase, which also has the rhombohedral symmetry. 42 The ζ-Hf4N3 structure has one-quarter and the ε-Hf3N2 structure has one-third of its light element interstitial sites vacant in the crystal structure, Fig. 4(d). Assuming that the oxygen fills these vacant interstitial sites, the composition of these “transitional” oxynitride phases would be ζ-Hf4O x N3 and ε-Hf3O x N2. Unfortunately, discernable oxynitride phase identification proved difficult in the XRD phase scan due to the similar Hf7O8N4 peak locations near 31° and 35° 2θ to the Hf6Ta2O17 phase, Fig. 3. However, by tracking the lattice parameter shift of the ζ-Hf4N3 and ε-Hf3N2 phases, one may deduce if oxygen site filling is occurring by corresponding changes in the lattice parameter. A XRD line scan that transversed from the bulk through the scale was performed with the lattice parameters for the ζ-Hf4N3 and ε-Hf3N2 phases tabulated in Table III.
Lattice parameters (left) based on peak shift from the 18.8 at.% 1700 °C oxidized specimen. The values are compared to prior literature (right most column). The 0.0 mm represents within the bulk of the ceramic moving toward the oxide scale whose outer edge was at 0.50 mm.

Using these XRD-determined lattice parameters with the proposed “transitional” oxynitride rhombohedral structures—ζ-Hf4O x N3 and ε-Hf3O x N2—along with the previously reported Hf7O8N4 phase, 42 an EBSD phase map, Fig. 4(e), was taken from a portion of the scale shown as the box region labeled (E) in the SEM micrograph of Fig. 4(a). The proposed ζ-Hf4O x N3 and ε-Hf3O x N2 phases were successfully identified in the EBSD phase map adding further confidence to their existence. To the authors’ knowledge, these proposed intermediate oxynitride phases of Hf4O x N3 and Hf3O x N2 have not been previously reported. By filling these interstitial vacancies, the oxynitride layer could be providing a further barrier for oxygen diffusion. If additional oxygen is still required to pass through this phase, it will either require substitutional site exchange and/or a phase transformation to another oxide, such as the Hf6Ta2O17 phase. Further work is still needed to determine the sequence of oxidation; however, the presence of these transitional oxynitrides near the bulk oxide scale interface does suggest that they are likely initial phases that accommodate the onset of oxidation in these hafnium nitrides.
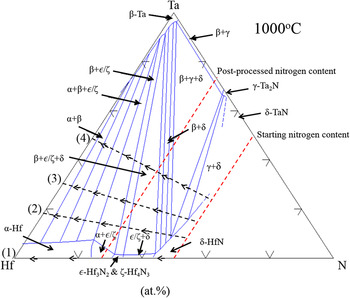
How these metallic and metal-rich nitride phases developed in the final-deposited material can be inferred by considering the phase equilibrium within this system with increasing Ta composition. Though VPS is a highly dynamic process and can lead to nonequilibrium phases, phase diagrams can provide very useful insights into how the system may be driven towards equilibrium. Reference Schulz, Wang, Morris, Butts and Thompson23 The approximate location for each post-VPS-sprayed specimen, using the postsprayed LECO nitrogen results, is plotted in the ternary Hf–Ta–N phase diagram Reference Rudy55 in Fig. 5. Each specimen’s location is numbered as (1)–(4) on the left side of the phase diagram. Clearly, the experimental presence of a variety of phases, Fig. 1, than those allowed in the phase diagram indicates that the experimental system was not in equilibrium. Regardless, one can still glean how phase fractions may be driven to achieve equilibrium.
Ternary Hf–Ta–N phase diagram at 1000 °C based from Rudy. Reference Rudy55 Note, the ε-Hf2N phase in the original report, Reference Rudy54 which was later shown to be incorrect, Reference Rudy54 has been replaced by the authors with ε-Hf3N2 & ζ-Hf4N3, which are the correct phases. Numbers (1)–(4) identify the four specimens based on their TaN content of (1) 0.0, (2) 18.8, (3) 28.1, and (4) 46.7 at.%. The dashed lines with arrows point in the direction of nitrogen loss. The red-dashed line indicates the starting and postprocessed nitrogen content. The intersection of these dashed lines is the approximate composition for the four specimens. As the Ta content is increased, and the nitrogen content is reduced (or lost), the system is driven further into the mixed metal-rich nitrogen phase fields and toward the metallic Ta phase field.

As the tantalum amount increased, which is moving from (1) to (4) along the Hf–Ta line in Fig. 5, coupled with the nitrogen lost from 50 to 25 at.% (shown by the two dashed red lines), the system is driven further into phase fields where the rhombohedral hafnium-rich nitride ε-Hf3N2 and ζ-Hf4N3 phases are present. This volume fraction increase is confirmed by the XRD intensity increases of these phases relative to α-Hf in Fig. 1. Though these hafnium-rich nitrides existed at higher tantalum nitride additions too, the higher fraction of metallic β-Ta (e.g., the system is being driven toward the β-Ta phase field in Fig. 5) caused the system to retain a phase that has poorer oxidation properties, which dominated the oxidation at those compositions. The 18.8 at.% specimen appears to be a good balance of stabilizing the rhombohedral hafnium-rich nitride phases for oxidation improvement while maintaining a lower amount of available metallic Hf and Ta to form the bimetallic Hf6Ta2O17 scale.
It is interesting to note that the 18.8 at.% specimen also had the highest porosity of the specimens, Table I, which one nominally assumes to yield the worst oxidation resistance because such microstructure defects allow easy pathways for oxidation. In contrast, this specimen had superior oxidation resistance. This indicates that the formation of the complex oxide scale of both bimetallic and oxynitride phases is an effective means for oxidation resistance, even in systems with less than desirable microstructure consolidation. Once the 18.8 at.% specimen was exposed to a higher temperature (1700 °C), this scale became less effective and a stronger presence of α-HfO2 (evident by the XRD peak identification in Fig. 3) was observed.
V. CONCLUSION
A series of (HfN)1−x (TaN) x compositionally mixed powders, where x = 0.0, 18.8, 28.1, and 46.7 at.%, were processed by VPS. The resulting nitrides lost approximately 25 at.% nitrogen during the spraying operation. The loss of nitrogen is associated with differences in vapor pressure between the species under the high temperature and the vacuum environment processing conditions of VPS. This nitrogen loss facilitated the formation of metal-rich nitride ζ-Hf4N3, ε-Hf3N2, γ-Ta2N, and elemental metal phases in the final microstructure. The formation of these phases has been explained by the system being driven further into their respective phase fields with an increase in Ta and loss of N using a ternary phase diagram as a guide.
Oxidation experiments were conducted between 700 and 1700 °C. The dominate oxide scale composition included α-HfO2 and α-Ta2O5 when the specimen contained a significant fraction of α-Hf and/or β-Ta in the microstructure. The exception was the 18.8 at.% specimen, which formed a dark oxide scale indexed as Hf6Ta2O17 with smaller formations of oxynitride phases within the scale. These collectively reduced the rate of oxidation. Using shifts in the XRD scans, coupled with EBSD phase mapping, transitional ζ-Hf4O x N3 and ε-Hf3O x N2 oxynitride phases were proposed and are believed to be intermediate transitions prior to the stabilization of the reported Hf7O8N4 phase. 42 STEM-HAADF and EDS line profiles confirmed that the hafnium-rich nitride phases had increases in oxygen content near the oxide scale with corresponding shifts in the XRD-determined lattice parameters. The presence of ζ-Hf4N3 and ε-Hf3N2 phases within the preoxidized specimen appears to promote the stabilization of these transitional oxynitride phases as well as the ultimate formation of a passivating bimetallic oxide scale that forms from the elemental species.
ACKNOWLEDGMENT
The authors thank Dr. Eric Wuchina for technical discussions. This work has been approved for public release 14-MDA-7794.