Introduction
Located beneath the Northern Subtropical High, the United Arab Emirates (UAE) has an arid to hyper-arid desert climate with a mean annual precipitation of 72 mm and a mean maximum summer temperature exceeding 40°C (Böer, Reference Böer1997; Raafat, Reference Raafat and Kumar2007; Dawoud et al., Reference Dawoud, Hameed, Alhashmi, Dash, Athamneh, Sallam and Othman2019; Paparella and Burt, Reference Paparella and Burt2023). As a result, the southern, western, and central parts of the country are covered by vast stretches of aeolian (desert) sand, whereas the coastal areas of the Arabian Gulf, particularly to the west of Abu Dhabi, are active locations of sabkha evaporite deposition (Evans et al., Reference Evans, Kinsman and Shearman1964; Evans, Reference Evans, Kendall and Alsharhan2011; Lokier and Steuber, Reference Lokier and Steuber2009). Nonetheless, less arid conditions prevail in a narrow stretch in the northeastern and eastern parts of the country, with the Hajar Mountains receiving a mean annual precipitation of 160–190 mm from the northwesterly Shamal winds, with the Mediterranean Sea as a moisture source, and southwesterly winds, with the Indian Ocean as a moisture source (Böer, Reference Böer1997; Niranjan Kumar and Ouarda, Reference Niranjan Kumar and Ouarda2014; Weyhenmeyer et al., Reference Weyhenmeyer, Burns, Waber, Macumber and Matter2002; Ouarda et al., Reference Ouarda, Charron, Kumar, Marpu, Ghedira, Molini and Khayal2014; Dawoud et al., Reference Dawoud, Hameed, Alhashmi, Dash, Athamneh, Sallam and Othman2019; Paparella and Burt, Reference Paparella and Burt2023). Consequently, these areas are the active recharge sites of groundwater for much of the country.
Despite being hot and arid, the early dispersal of humans across Arabia from Africa has raised speculation about humid episodes in the past in this region (Rosenberg et al., Reference Rosenberg, Preusser, Fleitmann, Schwalb, Penkman, Schmid, Al-Shanti, Kadi and Matter2011; Groucutt and Petraglia, Reference Groucutt and Petraglia2012; Atkinson et al., Reference Atkinson, Thomas, Parker and Goudie2013). Lately, there has been a shift in the focus of paleoclimate studies to consider the impacts of climate change. Being predominantly arid, the country is highly vulnerable to the consequences of climate change, with warmer temperatures (∼1°C increase in 2020 and ∼1.5–2°C predicted by 2040, Abu Dhabi Global Environmental Data Initiative [AGEDI], 2015) and less rainfall, which would cause further freshwater scarcity. Since ∼40% of the country’s freshwater comes from groundwater (used for irrigation), and another ∼40% from desalination (used for human consumption), a decline in groundwater availability will increase reliance on desalination, leading to higher costs. To comprehend current scenarios and forecast future trends in precipitation patterns, it is crucial to understand the variations in precipitation intensity during the Quaternary.
In the earlier paleoclimate studies on relict lake deposits, (triple) oxygen isotope ratios of speleothems, oxygen and hydrogen isotope ratios of speleothem fluid inclusions, alluvial fan deposits formed by drainage system activation, and climate modeling, precipitation was more intense during numerous intervals during the Late Pleistocene to the Mid Holocene (330–300 ka, 200–180 ka, 135–120 ka, 82–78 ka, and 10–6 ka; Burns et al., Reference Burns, Matter, Frank and Mangini1998; Fleitmann et al., Reference Fleitmann, Burns, Neff, Mudelsee, Mangini and Matter2004, Reference Fleitmann, Burns, Mangini, Mudelsee, Kramers, Villa and Neff2007, Reference Fleitmann, Burns, Matter, Cheng and Affolter2022; Mauz et al., Reference Mauz, Shen, Alsuwaidi, Melini, Spada and Purkis2022; Tian et al., Reference Tian, Fleitmann, Zhang, Sha, Wassenburg, Axelsson and Zhang2023; Markowska et al., Reference Markowska, Vonhof, Groucutt, Breeze, Drake, Stewart and Albert2025). An increase in precipitation resulted from the strengthened Indian summer monsoon (ISM) caused by a northward shift of the intertropical convergence zone (ITCZ; Burns et al., Reference Burns, Matter, Frank and Mangini1998, Reference Burns, Fleitmann, Matter, Neff and Mangini2001; Fleitmann et al., Reference Fleitmann, Burns, Mudelsee, Neff, Kramers, Mangini and Matter2003a, Reference Fleitmann, Burns, Neff, Mangini and Matter2003b, Reference Fleitmann, Burns, Neff, Mudelsee, Mangini and Matter2004, Reference Fleitmann, Burns, Mangini, Mudelsee, Kramers, Villa and Neff2007; Rosenberg et al., Reference Rosenberg, Preusser, Fleitmann, Schwalb, Penkman, Schmid, Al-Shanti, Kadi and Matter2011; Enzel et al., Reference Enzel, Kushnir and Quade2015; Parton et al., Reference Parton, Farrant, Leng, Telfer, Groucutt, Petraglia and Parker2015; Fleitmann et al., Reference Fleitmann, Burns, Matter, Cheng and Affolter2022; Tian et al., Reference Tian, Fleitmann, Zhang, Sha, Wassenburg, Axelsson and Zhang2023). However, a study by Enzel et al. (Reference Enzel, Kushnir and Quade2015) suggested that the lake deposits had been misinterpreted as wetland deposits in previous studies, and the rainfall increase to maintain wetlands was smaller, suggesting no drastic changes in the precipitation intensity during the late Quaternary.
Although later studies by Engel et al. (Reference Engel, Matter, Parker, Parton, Petraglia, Preston and Preusser2017) and others opposed Enzel et al. (Reference Enzel, Kushnir and Quade2015), additional data are needed for a better understanding of climate change in the Arabian Peninsula during the late Quaternary using a proxy from a different archive than the fossil lakes/wetlands or speleothems. Furthermore, most of these studies were conducted in the high-altitude areas of the southwestern, southern, and southeastern Arabian Peninsula, particularly in Yemen, Oman, and Saudi Arabia (Rosenberg et al., Reference Rosenberg, Preusser, Fleitmann, Schwalb, Penkman, Schmid, Al-Shanti, Kadi and Matter2011; Enzel et al., Reference Enzel, Kushnir and Quade2015). Fewer studies have been reported from the low-altitude northern and central parts of the Arabian Peninsula. These studies predominantly focus on a particular lake deposit in the northeastern UAE (Awafi, Ras Al Khaima) and a few alluvial fan deposits on the UAE–Oman border (Parker et al., Reference Parker, Davies and Wilkinson2006a, Reference Parker, Goudie, Stokes, White, Hodson, Manning and Kennet2006b, Reference Parker, Preston, Walkington and Hodson2006c; Preston et al., Reference Preston, Parker, Walkington, Leng and Hodson2012; Atkinson et al., Reference Atkinson, Thomas, Parker and Goudie2013). This creates a noticeable spatial gap in the late Quaternary climate record, prompted by the lack of consistent chronology and robust paleoclimate proxies in the area, as no continuous stratigraphical sequences exist, predominantly due to the prolonged and often strong deflation of Quaternary deposits.
Here, we study the variations in the oxygen isotope ratios (δ18O) of the meteoric cement of a carbonate-rich aeolianite, the Ghayathi Formation (Hadley et al., Reference Hadley, Brouwers, Brown, Alsharhan, Glennie, Whittle and Kendall1998), outcropped as zeugen (isolated, table-shaped ridges formed due to wind erosion in semi-arid and arid areas) in coastal and inland Abu Dhabi and Dubai, and understand their implications for the hydrological cycle during the late Quaternary in the UAE. The cements, precipitated as isopachous/bladed low-Mg calcite crystals inside and outside a thin micrite rim, and visible as coated hollow grains under a microscope, were handpicked from weakly consolidated sediments. Later, they were measured for their major element concentrations (Ca, Mg, and Sr) and δ18O values. In addition, δ18O values of individual spots in calcite crystals of the cements were also measured using a secondary ion mass spectrometer (SIMS). A Craig–Gordon model based on the results supports the role of humidity, evaporation, and salinity in controlling the δ18O values of groundwater from which these cements precipitated. Radiocarbon ages of marine deposits that overlie the aeolianites in coastal outcrops were used to constrain the age of the aeolianites.
Regional geology
The UAE is located at the northeastern edge of the Arabian plate, bordering the southern Arabian Gulf (Fig. 1). Most of the country is covered by thick Miocene–Quaternary sediments, which entirely conceal the Mesozoic to late Precambrian sedimentary and metamorphic basement (Evans and Kirkham, Reference Evans, Kirkham, Hellyer and Aspinall2005; Styles et al., Reference Styles, Ellison, Arkley, Crowley, Farrant, Goodenough and McKervey2006; Farrant et al., Reference Farrant, Ellison, Thomas, Pharaoh, Newell, Goodenough, Lee and Knox2012). However, parts of the basement are exposed in the Hajar Mountains, a collisional regime formed when Africa and Arabia collided with Eurasia during the closure of the Neo-Tethys Ocean during the Late Cretaceous to the Paleogene (Fig. 1).
Inset figure shows the study area (red square). The zoomed-in image of the study area shows the geological map of the UAE with Miocene (Baynunah Formation, Shuwaihat Formation, Dam and Rhas Khumais Formation, Gachsaran Formation, and Barzaman Formation), Pleistocene (Fuwayrit Formation, Ghayathi Formation, Madinat Zayed Formation, and Hili Formation), and Holocene (Rub’ al Khali Formation and Abu Dhabi Formation) sediments (modified after Farrant et al., Reference Farrant, Ellison, Thomas, Pharaoh, Newell, Goodenough, Lee and Knox2012). The green circles are the sediment sampling locations, and the black circles are the locations from where shells for radiocarbon analyses are collected. The green circles with crosses denote the samples used for SIMS analysis. The black rectangle is the water sampling location. The arrows on the top right show the location of the Hajar Mountains.

The uplift and erosion of the Hajar Mountains since the Miocene generated most of the Quaternary to Recent sediments (Fig. 1; Styles et al., Reference Styles, Ellison, Arkley, Crowley, Farrant, Goodenough and McKervey2006; Farrant et al., Reference Farrant, Ellison, Thomas, Pharaoh, Newell, Goodenough, Lee and Knox2012). The gravels and alluvial fans of the Hili Formation formed during humid episodes in the late Quaternary when coarse sediments were eroded and carried down by wadis, which formed alluvial fans along the Hajar Mountain front that extend to the Abu Dhabi coastline (Fig. 1; Styles et al., Reference Styles, Ellison, Arkley, Crowley, Farrant, Goodenough and McKervey2006; Farrant et al., Reference Farrant, Ellison, Thomas, Pharaoh, Newell, Goodenough, Lee and Knox2012). On the contrary, the extensive Pleistocene to Recent aeolian dune systems, including the Madinat Zayed Formation, the Late Pleistocene to Holocene Ghayathi Formation, and the Holocene Rub’ al Khali Sand Formation, were all formed under strong wind actions during arid episodes (Styles et al., Reference Styles, Ellison, Arkley, Crowley, Farrant, Goodenough and McKervey2006; Farrant et al., Reference Farrant, Ellison, Thomas, Pharaoh, Newell, Goodenough, Lee and Knox2012; Garzanti et al., Reference Garzanti, Vermeesch, Andò, Vezzoli, Valagussa, Allen, Kadi and Al-Juboury2013; Farrant et al., Reference Farrant, Mounteney, Burton, Thomas, Roberts, Knox and Bide2019). However, the unconsolidated dunes of the Ghayathi Formation only stabilised during humid episodes of the Quaternary due to carbonate cementation caused by rising groundwater levels (Kirkham, Reference Kirkham1998; Teller et al., Reference Teller, Glennie, Lancaster and Singhvi2000; Glennie and Singhvi, Reference Glennie and Singhvi2002; Glennie et al., Reference Glennie, Fryberger, Hern, Lancaster, Teller, Pandey and Singhvi2011; Atkinson et al., Reference Atkinson, Thomas, Parker and Goudie2013; Farrant et al., Reference Farrant, Duller, Parker, Roberts, Parton, Knox and Bide2015; Arboit et al., Reference Arboit, Steuber, Mohamad, Alsuwaidi and Ceriani2022). Additionally, marine carbonate deposits (Fuwayrit Formation, Marawah Formation, and Abu Dhabi Formation) formed on the Arabian Gulf coast during the interglacial intervals with high sea levels in the late Quaternary (Fig. 1).
The Holocene carbonate deposition mainly occurred in a complex and extensive suite of coastal barriers, spits, and lagoons in subtidal to intertidal areas (Evans et al., Reference Evans, Schmidt, Bush and Nelson1969; Williams and Walkden, Reference Williams and Walkden2002; Lokier and Florini, Reference Lokier and Fiorini2016; Ge et al., Reference Ge, Lokier, Hoffmann, Pederson, Neuser and Immenhauser2020; Kirkham and Evans, Reference Kirkham and Evans2020). In supratidal areas, evaporites prevail, forming a coastal sabkha, particularly in the Abu Dhabi emirate (Lokier and Steuber, Reference Lokier and Steuber2009; Kirkham and Evans, Reference Kirkham and Evans2020). This study focuses on the late Quaternary Ghayathi and Fuwayrit formations in coastal and inland Abu Dhabi and Dubai (Fig. 1).
Late Quaternary Ghayathi and Fuwayrit formations
The Ghayathi Formation is a carbonate-rich aeolianite outcropping along the coast and adjacent interior of the UAE, predominantly in Abu Dhabi and Dubai, where the shifting modern dunes are exposing these paleodunes beneath (Fig. 1). Continuous stratigraphic sequences of the Ghayathi Formation are absent. It usually outcrops as 1–10 m thick, planar to cross beds in wind-deflated zeugen, overlain by the marine Fuwayrit Formation in the coastal areas, but it also occurs as isolated outcrops in inland areas (Williams and Walkden, Reference Williams and Walkden2001; Farrant et al., Reference Farrant, Duller, Parker, Roberts, Parton, Knox and Bide2015; Arboit et al., Reference Arboit, Steuber, Mohamad, Alsuwaidi and Ceriani2022; Fig. 2). Unlike other regional dune systems, the Ghayathi Formation derived its sediments predominantly from marine carbonates during glacial–eustatic sea-level lows in the late Quaternary, when the Arabian Gulf was exposed and deflated by northwesterly Shamal winds (Kirkham, Reference Kirkham1998; Teller et al., Reference Teller, Glennie, Lancaster and Singhvi2000; Glennie and Singhvi, Reference Glennie and Singhvi2002; Glennie et al., Reference Glennie, Fryberger, Hern, Lancaster, Teller, Pandey and Singhvi2011; Stevens et al., Reference Stevens, Jestico, Evans and Kirkham2014; Farrant et al., Reference Farrant, Duller, Parker, Roberts, Parton, Knox and Bide2015; Lokier et al., Reference Lokier, Bateman, Larkin, Rye and Stewart2015; Arboit et al., Reference Arboit, Steuber, Mohamad, Alsuwaidi and Ceriani2022). During the last glacial cycle, owing to the shallow bathymetry of the Arabian Gulf, most of its floor was exposed until 14,000 years BP (Clark et al., Reference Clark, Dyke, Shakun, Carlson, Clark, Wohlfarth, Mitrovica, Hostetler and McCabe2009; Strohmenger and Jameson, Reference Strohmenger and Jameson2015).
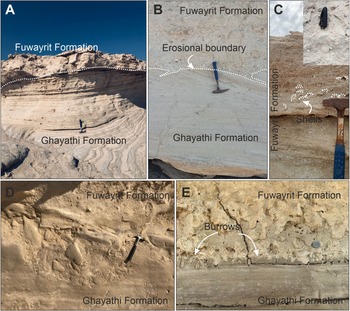
(A) A zeugen in coastal Abu Dhabi where the Fuwayrit Formation caps the Ghayathi Formation. An erosional surface separates the two (marked by a white dotted line). (B) A detailed view of the boundary between the Ghayathi Formation and Fuwayrit Formation. Alternating carbonate-rich and siliciclastic-rich laminations are present in the Ghayathi Formation. A fossils-rich layer is present above the erosional surface in the Fuwayrit Formation. (C) Large bivalve fossils (outlined, inset) in the Fuwayrit Formation used for radiocarbon dating. (D) Angular clasts of the Ghayathi Formation in the Fuwayrit Formation above the erosional surface. (E) Numerous Glossifungites burrows at the Ghayathi Formation and Fuwayrit Formation boundary.

The carbonate grains of the Ghayathi Formation are predominated by coralline red algae, peloids, and extraclasts, but also include foraminifers, bivalves, corals, echinoids, and ooids (Farrant et al., Reference Farrant, Ellison, Thomas, Pharaoh, Newell, Goodenough, Lee and Knox2012, Reference Farrant, Duller, Parker, Roberts, Parton, Knox and Bide2015; Arboit et al., Reference Arboit, Steuber, Mohamad, Alsuwaidi and Ceriani2022; Fig. 3A and B). Besides carbonate grains, siliciclastic grains, predominated by quartz with minor feldspar, clinopyroxene, and heavy minerals, are present in the Ghayathi Formation, contributing to its mixed lithology (Farrant et al., Reference Farrant, Ellison, Thomas, Pharaoh, Newell, Goodenough, Lee and Knox2012, Reference Farrant, Duller, Parker, Roberts, Parton, Knox and Bide2015; Arboit et al., Reference Arboit, Steuber, Mohamad, Alsuwaidi and Ceriani2022; Fig. 3B and C). Previous studies suggest that carbonate grains (∼85 %) dominate the coastal Ghayathi Formation, which reduces to ∼50 % in the inland Ghayathi Formation (Teller et al., Reference Teller, Glennie, Lancaster and Singhvi2000; Farrant et al., Reference Farrant, Ellison, Thomas, Pharaoh, Newell, Goodenough, Lee and Knox2012, Reference Farrant, Duller, Parker, Roberts, Parton, Knox and Bide2015). They also highlight that the quartz predominating in the inland Ghayathi Formation was incorporated from the older Miocene quartz-rich sediments (Fig. 1; Farrant et al., Reference Farrant, Ellison, Thomas, Pharaoh, Newell, Goodenough, Lee and Knox2012). However, a recent study by Arboit et al. (Reference Arboit, Steuber, Mohamad, Alsuwaidi and Ceriani2022) demonstrates that the Ghayathi Formation has a consistent lithology of ∼60% carbonate grains and ∼40% siliciclastic grains from coastal areas to ∼50 km inland, displayed as alternating carbonate-rich and siliciclastic-rich planar/cross pinstripe laminations that are characteristics of aeolian deposits (Figs. 2A, 2B and 2E; 3C; Arboit et al., Reference Arboit, Steuber, Mohamad, Alsuwaidi and Ceriani2022). This recent, detailed study of the granulometric and petrographic properties of the Ghayathi Formation challenges the earlier studies and demonstrates a similar petrology of the coastal and inland Ghayathi Formation.
Thin-section microphotographs of the Ghayathi Formation and Fuwayrit Formation in the plane-polarised light (PPL). (A, B) Carbonate clasts, including various bioclasts (coralline red algae and foraminifers), ooids, peloids, and extraclasts, of the Ghayathi Formation. Quartz grains of various grain sizes coexist with the carbonate clasts. (C) Fine-grained quartz-rich lamina and coarse-grained carbonate-rich lamina in the Ghayathi Formation. (D) Hollow grains in the Ghayathi Formation. Well-developed, bladed to blocky carbonate cements are present inside and outside a thin micritic rim in the hollow grains. The micrite rim preserves the shapes of the original grains. (E, F) Bioclasts, including coralline red algae, foraminifers, and bivalve shells (inset), are present in the Fuwayrit Formation.

The stabilisation of the Ghayathi Formation occurred during humid episodes, when the original unstable carbonate grains (aragonite or high-Mg calcite) were leached by groundwater and reprecipitated as stable calcite cement both inside and outside remnant thin micrite rims, appearing as coated hollow grains in thin sections (secondary moldic pores; Figs. 3D, 4, 5A–D), or in intergranular pore spaces (Fig. 5E; Farrant et al., Reference Farrant, Ellison, Thomas, Pharaoh, Newell, Goodenough, Lee and Knox2012, Reference Farrant, Duller, Parker, Roberts, Parton, Knox and Bide2015; Arboit et al., Reference Arboit, Steuber, Mohamad, Alsuwaidi and Ceriani2022). The pervasive leaching removed all the original aragonite grains, although the original shape of the grains is preserved by the micrite rim and the cements (Fig. 5C and D). The cements are nearly all isopachous, bladed, and drusy, composed of low-Mg calcite, with the absence of gravitational meniscus or stalactitic cements that typically form in the vadose zone of the groundwater (Arboit et al., Reference Arboit, Steuber, Mohamad, Alsuwaidi and Ceriani2022; Fig. 5C, D, F, and G). The calcite cementation reduced most of the porosity to ∼5% in the coastal and ∼25% in the inland Ghayathi Formation (Arboit et al., Reference Arboit, Steuber, Mohamad, Alsuwaidi and Ceriani2022). The micrite rims are uniformly thin and formed either in the marine environment (boring/etching by micro-organisms or high-Mg calcite micro-cementation; Ge et al., Reference Ge, Lokier, Hoffmann, Pederson, Neuser and Immenhauser2020) before the aeolian transport (Fig. 5A, D, F, and G) or in the meteoric environment (coalescence of calcified filaments of micro-organisms around the grains or low-Mg micro-cementation; Calvet, Reference Calvet1982) after the aeolian transport.
Based on optically stimulated luminescence (OSL) dates of the quartz, three different depositional/stabilisation phases (∼120 ka or marine isotope stage [MIS] 5e, 80–60 ka or MIS 5a to MIS 4, and ∼10 ka or MIS 2 to MIS 1) have been proposed for the Ghayathi Formation (Atkinson et al., Reference Atkinson, Thomas, Goudie and Bailey2011; Farrant et al., Reference Farrant, Duller, Parker, Roberts, Parton, Knox and Bide2015). These different ages, however, contradict the similar petrography of the Ghayathi Formation, which instead suggests formation in a similar time period in the late Quaternary. Additionally, there are evident discrepancies in the OSL ages of the Ghayathi and Fuwayrit formations between different studies (Farrant et al., Reference Farrant, Ellison, Thomas, Pharaoh, Newell, Goodenough, Lee and Knox2012; Stevens et al., Reference Stevens, Jestico, Evans and Kirkham2014; Farrant et al., Reference Farrant, Duller, Parker, Roberts, Parton, Knox and Bide2015). One of the main concerns about the OSL ages is that the Fuwayrit Formation located above the Ghayathi Formation in coastal areas has an older OSL age than the Ghayathi Formation (Stevens et al., Reference Stevens, Jestico, Evans and Kirkham2014; Farrant et al., Reference Farrant, Duller, Parker, Roberts, Parton, Knox and Bide2015). Further, the OSL dates of the Fuwayrit Formation from the exact location show an age of 127 ka (sample UAE-1), as determined by Stevens et al. (Reference Stevens, Jestico, Evans and Kirkham2014), and a much younger age of 40.3 ka (sample UAE-7301), as determined by Farrant et al. (Reference Farrant, Ellison, Thomas, Pharaoh, Newell, Goodenough, Lee and Knox2012). The difference between these two OSL dates is substantial, and it appears that the OSL dating of these deposits is likely compromised by their complex depositional history. The age of these formations is described in detail in the discussion.
The Fuwayrit Formation is a well-cemented shallow marine carbonate that outcrops in coastal Abu Dhabi. It is a carbonate grainstone/rudstone predominantly composed of calcareous algae, foraminifers, shell fragments (bivalve, gastropod, and oyster; Figs. 2C, 3E and 3F), and ooids. Quartz grains are occasionally present. The grains are sub-angular, with grain sizes ranging from very fine (10 μm) to coarse (1.32 mm). Large bioclasts, predominantly of bivalves, are abundant in rudstone fabrics (Farrant et al., Reference Farrant, Ellison, Thomas, Pharaoh, Newell, Goodenough, Lee and Knox2012; Arboit et al., Reference Arboit, Steuber, Mohamad, Alsuwaidi and Ceriani2022). The Fuwayrit Formation typically forms an up to 3-m-thick (usually less than 1.5 m) resistant cap rock overlying the Ghayathi Formation in zeugen (Fig. 2A and B; Styles et al., Reference Styles, Ellison, Arkley, Crowley, Farrant, Goodenough and McKervey2006; Farrant et al., Reference Farrant, Ellison, Thomas, Pharaoh, Newell, Goodenough, Lee and Knox2012; Stevens et al., Reference Stevens, Jestico, Evans and Kirkham2014). The lower contact, lying ∼1–6 m above sea level, is usually erosive and overlain by shell lags (Fig. 2C) or angular clasts of the Ghayathi Formation (Fig. 2D). Abundant burrows are also present at the erosive lower contact of the Fuwayrit Formation (Fig. 2E).
Previous studies suggest that the erosive lower surface of the Fuwayrit Formation was formed during the onset of a marine transgression event associated with the last interglacial period (∼125 ka; Farrant et al., Reference Farrant, Ellison, Thomas, Pharaoh, Newell, Goodenough, Lee and Knox2012; Stevens et al., Reference Stevens, Jestico, Evans and Kirkham2014), which eventually led to the deposition of the Fuwayrit Formation. On the contrary, Wood et al. (Reference Wood, Sanford and Habshi2002), based on OSL and 14C dating, proposed a last glacial age (between 17.2 ka and 30.3 ka) for the Fuwayrit Formation and its formation during the peak phase of low eustatic sea level associated with the last glacial maximum. They proposed rapid subsidence (>1 mm/yr) followed by an uplift (∼6 mm/yr) of the southern end of the Arabian Gulf to explain these ages, despite the tectonic quiescence of the area. An alternative point of view by Williams and Walkden (Reference Williams and Walkden2002), who also reported a younger age (between 29.3 ka and 33.4 ka) of the Fuwayrit Formation based on 14C dating, suggested that these younger ages are possibly due to the diagenetic alteration that introduced younger carbon to the analysed shells. In support, a more recent study by Steven et al. (Reference Stevens, Jestico, Evans and Kirkham2014) obtained new OSL ages between 94 ka and 130 ka for the Fuwayrit Formation These ages roughly coincide with the timing of the last interglacial sea-level rise on the global sea-level curve (Waelbroeck et al., Reference Waelbroeck, Labeyrie, Michel, Duplessy, Mcmanus, Lambeck, Balbon and Labracherie2002), leading them to dismiss the tectonic uplift interpretation of Wood et al. (Reference Wood, Sanford and Habshi2002) based on a younger age of the Fuwayrit Formation.
Materials and methods
A total of 59 samples of the Ghayathi Formation and 20 samples of the Fuwayrit Formation were collected from outcrops in coastal to ∼50 km inland Abu Dhabi and Dubai during 2019–2024 (Fig. 1). These also include the 58 samples collected by Arboit et al. (Reference Arboit, Steuber, Mohamad, Alsuwaidi and Ceriani2022). The vertical sampling interval is random, ranging between 0.5 m and 3 m, and special care was taken to avoid visibly altered samples. The coordinates of the sampling locations are given in the supplementary file (except for the ones mentioned in Arboit et al., Reference Arboit, Steuber, Mohamad, Alsuwaidi and Ceriani2022). Forty-seven water samples were collected from open marine, subtidal, to supratidal areas of the Arabian Gulf (Fig. 1) and filtered and stored in polypropylene (PPE) bottles with minimum headspaces. These also include the eight samples collected by Lokier and Steuber (Reference Lokier and Steuber2009).
A total of 18 bivalve and gastropod shells for radiocarbon analyses were collected from the Fuwayrit Formation in Futaisi and Al Nouf in the Abu Dhabi emirate (Figs. 1, 2C). Sediments attached to the shell surface were removed using a hand-held drill with a 4.8 mm tungsten drill bit and carborundum paper, after which the shells were ultrasonically cleaned with deionised water. Small fragments of the shells were powdered and analysed for their X-ray diffraction patterns using an Empyrean XRD (PANalytical) operating with Cu-Kα radiation at Khalifa University, Abu Dhabi. Subsequently, the shells were leached using 0.5 N HCl, and different CO2 fractions were collected, representing different depths in the shells. The outer CO2 fractions obtained from the shallower depths were discarded to avoid contamination that might be associated with recrystallisation. The inner CO2 fractions obtained from deeper depths were graphitised using an Fe-catalyst reaction, and the 14C content was measured in a MICADASTM accelerator mass spectrometer at the Tandem Laboratory, Uppsala University, Sweden. The age calibration was done using the IOSACal v0.4.1 with atmospheric data from Reimer et al. (Reference Reimer, Austin, Bard, Bayliss, Blackwell, Ramsey and Butzin2020), and ages were reported in years before the present (2σ; cal yr BP).
From 32 loosely consolidated samples of the Ghayathi Formation, hollow grains and carbonate grains were handpicked using a fine brush under a stereo microscope (Olympus SZX10). The selected grains were coated with a gold–palladium alloy, and the secondary electron (SE) images of the grains were captured using scanning electron microscopes (SEMs; Phenom Desktop SEM [Thermo Fischer Scientific] and JSM-7610F Field Emission SEM [JEOL]) at 15 keV at Khalifa University, Abu Dhabi (e.g., Fig. 4). Elemental mapping was performed using energy-dispersive X-ray spectroscopy (EDS) attached to the SEM.
Secondary electron (SE) image of hollow grains in the coastal Ghayathi Formation. Note the abundant fragments of broken hollow grains produced during sample preparation.

To measure element concentrations (Ca, Mg, and Sr), 0.4–1.3 mg of hollow grains from nine samples were completely dissolved in 5 mL of 1% HNO3. The leachates were measured with a Thermo Scientific iCAP 7000 series inductively coupled plasma optical emission spectrometer (ICP-OES) at Khalifa University, Abu Dhabi, using the spectral lines 393.366 nm for Ca, 279.553 nm for Mg, and 407.771 nm for Sr. The instrument was calibrated using a PerkinElmer-sourced calibration solution, and NIST SRM 1d calcite reference material was used for quality control. The relative standard deviation for Ca is 2.7%, Mg is 2.2%, and Sr is 2.8%.
For isotope analyses, small pieces of rock samples were ultrasonically cleaned using Milli-Q water and then dried in an oven at 50°C. These bulk rock samples, along with isolated hollow and carbonate grains, were individually powdered using an agate mortar and pestle and were then stored in centrifuge tubes (Sreenivasan et al., Reference Sreenivasan, Bera and Samanta2023). The 37 powdered bulk samples (the remaining 42 samples were analysed by Arboit et al., Reference Arboit, Steuber, Mohamad, Alsuwaidi and Ceriani2022), along with hollow grains and carbonate grains collected from 32 weakly consolidated samples, were analysed for their carbon (δ13C) and oxygen (δ18O) isotope ratios in a Gas Bench II-Conflo IV (Thermo Finnigan) connected to a Delta XP isotope ratio mass spectrometer (IRMS; Thermo Finnigan) at the Ján Veizer Stable Isotope Laboratory, University of Ottawa, Canada. All delta (δ) values of the bulk carbonate, hollow grains, and carbonate grains are reported in parts per thousand (permil ‰) with respect to the VPDB. The international calcite reference materials, NBS-18, NBS-19, and IAEA-612, were used for normalisation (three-point calibration for carbon and two-point calibration for oxygen), and an internal calcite reference material, Lalime C-44 (δ13C: −1.85‰ and δ18O: −22.23‰), was used for quality control. The analytical precision is ± 0.1‰ (1σ) for both δ13C and δ18O. The water samples were equilibrated with carbon dioxide for 48 hours (longer hours are considered for minimising the isotope salt effect), and their δ18O values were measured in GasBench II- Delta XP IRMS (Thermo Finnigan) at the Leibniz Institute for Applied Geophysics, Hannover, Germany. The external reproducibility is better than ± 0.06‰ (1σ). The water δ18O values were reported in per mil (‰) with respect to VSMOW.
Along with the thin sections from 29 samples (the remaining were prepared by Arboit et al., Reference Arboit, Steuber, Mohamad, Alsuwaidi and Ceriani2022), 1-inch-diameter, double-polished, round, thin sections of nine samples of the Ghayathi Formation were prepared at Wagner Petrographic Laboratory, USA. In addition to the plane-polarised light (PPL) images of the thin sections captured using an Olympus DP73 camera, the backscattered electron (BSE) images of the cements were also captured using the JSM-7610F JEOL SEM operated at 15 keV.
The nine double-polished, round, thin sections were used for the SIMS analysis. At first, each thin section was thoroughly examined for its surface quality to ensure that flatness and polish were maintained within 5 µm near all areas designated for analysis. Later, the samples were cleaned in high-purity ethanol and coated with a 35-nm-thick, high-purity gold film (Edwards Scancoat 6 argon sputter coater). Calcite cements precipitated both inside and outside the hollow grains, 6–10 hollow grains per thin section, were analysed. The δ13C and δ18O of 12–27 spots per thin section (2–4 spots per hollow grains) were analysed using a ∼2 nA, Gaussian 133Cs+ primary ion beam with a 5 µm diameter and impact energy of 20 keV in the Potsdam Cameca 1280-HR SIMS at Helmholtz Centre for Geosciences, Potsdam, Germany. The international calcite reference material IAEA-603 was used for quality control. The repeatability, reported using the UWC-3 calcite standard, is ± 0.3‰ for δ18O and ± 0.7‰ to ± 0.9‰ for δ13C (1σ). The δ13C and δ18O values of cement (in ‰ VPDB) mentioned in the following sections represent the δ13C and δ18O values of cement analysed by SIMS. These are not to be confused with the δ13C and δ18O values of hollow grains, even though these data predominantly represent the cement δ13C and δ18O values, as more than 95% of the hollow grains are composed of cements (Fig. 5C–G). However, there can be a minor carbon and oxygen contribution from the micrite rim.
(A) Schematic diagram showing the formation of a hollow grain from a carbonate grain. The first step involves the micritisation of the carbonate grain. This can happen either in a marine environment before wind transport or in a meteoric environment after wind transport. Micritisation is followed by leaching of the carbonate grains by mildly acidic groundwater and cementation. (B) SE image of a carbonate grain. Note the smooth surface. (C, D) SE images of hollow grains with well-developed cements (C) and weakly developed cements (D). Note the bladed to blocky cements present inside and outside a thin micrite rim. (E) Intergranular carbonate cement developed between the grains. (F) SE image of the thin micrite rim composed of fine-grained calcite. (G) Backscattered electron image (BSE) of the hollow grain in thin section.

Results
The XRD patterns of the shells from the Fuwayrit Formation show a predominant aragonite composition, with calcite d104 (d-spacing or interplanar spacing) peaks also being present (Fig. 6). The radiocarbon ages of the samples vary between 46,839 ± 817 14C yr BP and 22,943 ± 82 14C yr BP (see supplementary material). Three of the dated shells have ages beyond the detection limit of radiocarbon dating (>48,000 14C yr BP). The calibrated ages range from >48,000 cal yr BP to 27,138 cal yr BP (Fig. 6).
X-ray diffraction patterns of fossils collected from the Fuwayrit Formation. The aragonite peaks include d111, d021, d012, d200, d031, d112, d130, d211, d220, d221, d041, d132, d113, and d231. The d104 peak characteristics of calcite are present among the rest of the aragonite peaks. Photographs of the fossils, including bivalves and gastropods, are shown on the right. Except for three samples with radiocarbon activity below the detection limit, the radiocarbon ages of all the fossils vary between >48,000 and 27,000 cal yr BP.

The SEM images of a carbonate grain show smooth surfaces with minimum cement (Fig. 5B). The PPL and SEM images of the hollow grains show bladed to blocky calcite cement both inside and outside a thin micrite rim (Figs. 3D, 5C, 5D, 5F, and 5G). These cements are monotonously grey in the BSE images of the thin section (Fig. 5G). The EDS analysis of the cements in hollow grains indicates the predominance of calcium, carbon, and oxygen (Fig. 7A). In contrast, the micrite rims have low but detectable quantities of magnesium, iron, sodium, and potassium in addition to calcium, carbon, and oxygen, which are the major elements (Fig. 7B). The EDS spectra also show the presence of aluminium and silicon. Carbonate grains have a similar composition to that of the micrite rim (Fig. 7C). The Ca, Mg, and Sr concentrations of the hollow grains vary between 338,727 μg/g to 380,293 μg/g, 4554 μg/g to 8116 μg/g, and 5153 μg/g to 44,229 μg/g, respectively (Fig. 7D–F). The Mg/Ca ratio (mmol/mol) varies between 20 and 38 (Fig. 7G).
(A) The energy dispersive X-ray spectroscopy (EDS) analysis of cements shows the predominance of calcium, carbon, and oxygen. (B, C) The EDS analysis of the micrite rim (B) and carbonate grain (C) shows the presence of magnesium, iron, sodium, and potassium in addition to calcium, carbon, and oxygen. (D, E, F) Ca, Mg, and Sr concentrations of the hollow grains handpicked from the weakly consolidated sediments of the Ghayathi Formation. (G) Mg/Ca ratio of the hollow grains.

The δ13C values of bulk carbonate from both the Ghayathi Formation and Fuwayrit Formation, both hollow grains, and carbonate grains are all positive and within a narrow range of +0.7‰ to +3.1‰ (excluding two carbonate grains with values more than +3.5‰; Fig. 8A). On the contrary, the δ18O values show a large range, with values as low as –6.0‰ in hollow grains and as high as +6.1‰ in carbonate grains. The δ18O values of the bulk carbonate (Ghayathi Formation and Fuwayrit Formation) vary between –4.2‰ and +4.1‰. The δ18O values of the hollow grains vary between –6.0‰ and +6.0‰. Except for two samples, the δ18O values of the carbonate grains are all positive and vary between +0.2‰ and +6.1‰ (Fig. 8A). There is a good correlation between the δ13C and δ18O values of the bulk carbonate of the Ghayathi Formation (r2 = 0.6) and Fuwayrit Formation (r2 = 0.7). However, the δ13C and δ18O values of the hollow grains and carbonate grains show no correlation. Except for one sample, the δ18O values of the hollow grains are negative in coastal areas (Fig. 8B). However, most inland samples have positive δ18O values, and there is a positive correlation between the distance of the sample location from the coast and δ18O values (r2 = 0.4; Fig. 8B).
(A) The δ13C and δ18O cross plot of the bulk carbonate (Ghayathi Formation and Fuwayrit Formation) and hollow grains and carbonate grains, handpicked from the weakly consolidated sediments of the Ghayathi Formation. (B) Changes in the δ18O values of the hollow grains with distance from the coast.

The range of cement δ18O values analysed by SIMS covers hollow grain δ18O values for most of the samples (Fig. 9A). Based on the δ18O values of the cements, three clusters (statistically proven different [p value < 0.05] by ANOVA and other tests) can be defined (Fig. 10). Cluster I, representing samples collected within 2 km of the coast, has lower δ18O values, varying between –9.1‰ and +1.6‰. Cluster II, representing samples collected ∼22–26 km from the coast, has relatively higher δ18O values, ranging between –5.1‰ and –0.9‰. Cluster III, representing samples collected 18–28 km from the coast, has exceptionally high δ18O values, varying between +5.1‰ and +12.7‰.
(A) The cement δ18O values for nine Ghayathi Formation samples analysed by SIMS. The δ18O values of bulk carbonate, hollow grains, and carbonate grains are also shown for comparison. (B) Bar diagram showing intra-hollow grain variations in cement δ18O and δ13C values (Δ18O and Δ13C) analysed by SIMS for nine Ghayathi Formation samples. An average of 3–4 cement δ18O values are analysed per hollow grain. The inset figure shows SIMS analysis spots in the cement.

Box and whisker diagrams showing cement δ18O values analysed by SIMS for nine Ghayathi Formation samples. The distance from the coast on the X-axis is not to scale.

Micrometer-scale, intra-hollow grain variations in cement δ18O values (Δ18O or variations in cement δ18O values within a single hollow grain) range from +0.1‰ to +2.0‰ in five out of nine samples (Fig. 9B). In four samples, these variations are quite large, ranging up to +6.3‰ (Fig. 9B). On the contrary, the intra-hollow grain variations in cement δ13C values (Δ13C or variations in cement δ13C values within a single hollow grain) are minimal and within, or approximately, the analytical uncertainty range (Fig. 9B). For example, the intra-hollow grain variations in cement δ13C values for sample K48 range from +0.1‰ to +1.2‰, which contrasts with the quite large range in cement δ18O values, i.e., +1.5‰ to +4.5‰. The δ18O values along the cement’s growth (along the SIMS analysis transect; Fig. 9B inset) either decrease or increase, not following any consistent pattern.
The δ18O values of the water (in ‰ VSMOW) collected from open marine, subtidal, to supratidal areas of the Arabian Gulf vary between +1.8‰ and +7.6‰ (supratidal water δ18O values are shown in Fig. 11 and the rest in Figure S1). Their salinity varies between 45 g/L and 300 g/L.
Box and whisker diagrams showing δ18O values of the groundwater calculated from the δ18O values of the cements, temperature of precipitation (31°C), and temperature-dependent oxygen isotope fractionation factor. The water δ18O values of the Abu Dhabi sabkha are from (1) Wood et al. (Reference Wood, Sanford and Habshi2002) and (2) the present study. The groundwater δ18O values of the recharge area in Al Ain are from (3) Dawoud et al. (Reference Dawoud, Hameed, Alhashmi, Dash, Athamneh, Sallam and Othman2019), and in Oman are from (4) Weyhenmeyer et al. (Reference Weyhenmeyer, Burns, Waber, Macumber and Matter2002). The precipitation data are from Weyhenmeyer et al. (Reference Weyhenmeyer, Burns, Waber, Macumber and Matter2002). The distance on the X-axis is not to scale.

Discussion
Age
Based on the 14C dating of shells, the Fuwayrit Formation has a Late Pleistocene age (>48,000 to 27,000 cal yr BP; Fig. 6). However, considering the calcite peaks in the XRD, it is likely that recrystallisation might have introduced more recent 14C in the shells, biasing the results towards a younger apparent age than the actual age of the shells (Fig. 6). A minor modern carbon contamination can cause dating errors of 20–45 14C cal ka (Burr et al., Reference Burr, Edwards, Donahue, Druffel and Taylor1992). This might also be the reason for the previously published younger ages of the Fuwayrit Formation (Williams and Walkden, Reference Williams and Walkden2002; Farrant et al., Reference Farrant, Ellison, Thomas, Pharaoh, Newell, Goodenough, Lee and Knox2012; Wood et al., Reference Wood, Bailey, Hampton, Kraemer, Lu, Clark, James and Al Ramadan2012). Besides, during >48–27 ka, the sea level was 60–80 m lower than today (Waelbroeck et al., Reference Waelbroeck, Labeyrie, Michel, Duplessy, Mcmanus, Lambeck, Balbon and Labracherie2002). As eustatic sea-level changes largely control the relative sea-level changes in the Gulf (Williams, Reference Williams1999; Stevens et al., Reference Stevens, Jestico, Evans and Kirkham2014), marine carbonates of the Fuwayrit Formation, currently exposed several meters above sea level, could not have formed during times of such lower sea levels. Therefore, in agreement with the study by Stevens et al. (Reference Stevens, Jestico, Evans and Kirkham2014), the Fuwayrit Formation is confirmed to be older and must have formed during the last interglacial sea-level highstand at around 125 ka in MIS 5 (130–80 ka; Kirkham, Reference Kirkham1998; Evans et al. Reference Evans, Kirkham and Carter2002; Waelbroeck et al., Reference Waelbroeck, Labeyrie, Michel, Duplessy, Mcmanus, Lambeck, Balbon and Labracherie2002; Williams and Walkden, Reference Williams and Walkden2002; Evans and Kirkham, Reference Evans, Kirkham, Hellyer and Aspinall2005).
Unlike the Fuwayrit Formation, the OSL dating of the Ghayathi Formation yielded a large spectrum of ages, from as old as 280 ka to as young as 9 ka, which can be attributed to the specific times when dunes were reactivated (polyphase activity of dunes; Evans et al., Reference Evans, Kirkham and Carter2002; Glennie and Singhvi, Reference Glennie and Singhvi2002; Wood et al., Reference Wood, Bailey, Hampton, Kraemer, Lu, Clark, James and Al Ramadan2012; Farrant et al., Reference Farrant, Duller, Parker, Roberts, Parton, Knox and Bide2015, Reference Farrant, Mounteney, Burton, Thomas, Roberts, Knox and Bide2019). Nonetheless, with the new radiocarbon dates in the present study and those published earlier (Williams and Walkden, Reference Williams and Walkden2002; Farrant et al., Reference Farrant, Ellison, Thomas, Pharaoh, Newell, Goodenough, Lee and Knox2012; Wood et al., Reference Wood, Bailey, Hampton, Kraemer, Lu, Clark, James and Al Ramadan2012), the Ghayathi Formation beneath the Fuwayrit Formation in the coastal areas must be older than 125 ka, possibly having formed during the preceding MIS 6 lowstand. However, this older age (>125 ka) of the Ghayathi Formation at Futaisi and Al Nouf contradicts the younger OSL ages of the Ghayathi Formation at two other coastal sites in Abu Dhabi, i.e., 71.6 ± 8.4 ka in Jubail and 77.5 ± 11.6 ka in Ghantoot (Farrant et al., Reference Farrant, Ellison, Thomas, Pharaoh, Newell, Goodenough, Lee and Knox2012, Reference Farrant, Duller, Parker, Roberts, Parton, Knox and Bide2015). At these two locations, a comparative age dating of the Ghayathi Formation was not possible because suitable shells for radiocarbon dating were not found in the overlying Fuwayrit Formation. Furthermore, based on the OSL ages of the Ghayathi Formation in Jubail and Ghantoot, the overlying Fuwayrit Formation must be younger than 71.6 ka, which cannot be aligned with the late Quaternary sea-level change (Waelbroeck et al., Reference Waelbroeck, Labeyrie, Michel, Duplessy, Mcmanus, Lambeck, Balbon and Labracherie2002). Hence, revising the OSL dating of the Ghayathi Formation at these locations is critical.
As the Ghayathi Formation stands isolated in inland areas, a relative age-dating cannot be established to derive the approximate age for the inland Ghayathi Formation. The OSL dates by Farrant et al. (Reference Farrant, Ellison, Thomas, Pharaoh, Newell, Goodenough, Lee and Knox2012, Reference Farrant, Duller, Parker, Roberts, Parton, Knox and Bide2015) show relatively younger ages for the inland Ghayathi Formation, varying between 1 ka and 13 ka. However, due to the very similar petrography of the coastal and inland Ghayathi Formation (Arboit et al., Reference Arboit, Steuber, Mohamad, Alsuwaidi and Ceriani2022), similar depositional ages are more likely than different ages proposed by OSL age models. Additionally, as the carbonate grain type varied significantly in the Arabian Gulf over the last 200 ka (Alsharhan and Kendall, Reference Alsharhan and Kendall2003; Arboit et al., Reference Arboit, Steuber, Mohamad, Alsuwaidi and Ceriani2022), the Ghayathi Formation, suggested to be formed in different time intervals by OSL dating, was unlikely to have similar petrography. Also, a large-scale mobilisation of older, stabilised dunes to inland areas to form younger dunes of the same carbonate grain types seems difficult for a weak transport agent like wind. Hence, it is likely that carbonate grains transported from the Arabian Gulf during an interval of low sea level (likely during MIS 6) underwent multiple stages of mobilisation, resulting in a widespread distribution from the coast to 30 km inland, and finally stabilised during humid periods before 125 ka in the late Quaternary. Nonetheless, the late Quaternary depositional ages of the Ghayathi Formation suggest a late Pleistocene-Holocene age of the calcite cement of the hollow grains. It remains, however, uncertain whether the cements formed during humid episodes of the last or a previous (MIS 6) glacial interval.
Cement chemistry
The EDS analysis indicates a low-Mg calcite composition of the cements (Fig. 7A). In support, the whole rock XRD patterns of Ghayathi Formation (Figure S2) shows predominance of calcite and quartz, indicating a calcite composition of the cements and an absence of metastable carbonates such as aragonite or high-Mg calcite. Furthermore, the Mg concentration of the hollow grains is considerably lower than that of most Holocene biotic and abiotic marine calcite (Fig. 7E and G; Carpenter and Lohmann, Reference Carpenter and Lohmann1992; Barker et al., Reference Barker, Greaves and Elderfield2003; Segev and Erez, Reference Segev and Erez2006; Cléroux et al., Reference Cléroux, Cortijo, Anand, Labeyrie, Bassinot, Caillon and Duplessy2008; Maeda et al., Reference Maeda, Fujita, Horikawa, Suzuki, Yoshimura, Tamenori and Kawahata2017). Overall, these inferences suggest the precipitation of cements from meteoric water.
In contrast to Mg, the hollow grains have high Sr concentrations, higher than most modern and Holocene marine and meteoric calcite (Fig. 7F; Land and Hoops, Reference Land and Hoops1973; Carpenter and Lohmann, Reference Carpenter and Lohmann1992). Such high Sr concentrations are generally considered unrealistic for meteoric low-Mg calcite cements, as Sr is excluded from the crystal structure during the recrystallisation of unstable aragonite or high-Mg calcite to low-Mg calcite. However, meteoric calcite cements can preserve the high Sr concentration of the original aragonite after dissolution–reprecipitation in a semi-closed/closed system (Katz et al., Reference Katz, Sass, Starinsky and Holland1972; Melim et al., Reference Melim, Westphal, Swart, Eberli and Munnecke2002, and references therein; Nguyen et al., Reference Nguyen, Gabitov, Jimenez, Dygert, Varco, Pérez-Huerta, Migdisov, Paul, Kirkland and Dash2021). In support, high Sr concentrations of diagenetic carbonates have been reported in previous studies (Melim et al., Reference Melim, Westphal, Swart, Eberli and Munnecke2002, and references therein). These studies on diagenetic carbonates advocate that owing to a low water–rock ratio during diagenesis, the Sr released by aragonite (modern coralline red algae and foraminifera [miliolids] have Sr concentrations of 2000–5000 μg/g; Kamenos et al., Reference Kamenos, Cusack and Moore2008; Darrenougue et al., Reference Darrenougue, De Deckker, Eggins and Payri2014; Van Dijk et al., Reference Van Dijk, de Nooijer and Reichart2017) would have accumulated in the pore fluid, and later reprecipitated as calcite cements with high Sr concentrations (Melim et al., Reference Melim, Westphal, Swart, Eberli and Munnecke2002). The high Sr and low Mg in closed-system calcite precipitation may be due to the different partition coefficients of Mg and Sr in the calcite.
In contrast to the meteoric origin of the hollow grains, the presence of elements characteristic of seawater, such as magnesium, sodium, etc., suggests a marine origin for the micrite rim and carbonate grains (Fig. 7B and C). Silicon, aluminium, and sodium are possibly present due to clay minerals that were adsorbed onto the grain surface.
Cement carbon and oxygen isotope composition
Before using the late Quaternary, low-Mg meteoric calcite cements of the Ghayathi Formation for paleo-precipitation reconstruction, it is critical to first confirm that the changes in their oxygen isotope composition are indeed related to the changes in the precipitation intensity/source and are not an artefact of other local processes. Hence, a detailed assessment is carried out in the following section, starting with the bulk carbonate δ13C and δ18O values of the Ghayathi and Fuwayrit formations, followed by the hollow grains and cement δ13C and δ18O values.
Similar bulk carbonate δ13C and δ18O values of the Fuwayrit and Ghayathi formations confirm the marine origin of the carbonate clasts of the Ghayathi Formation (constituting 60% of the total clasts; Fig. 8A). The good correlation found between the bulk carbonate δ13C and δ18O values primarily suggests that meteoric diagenesis has played an important role (Fig. 8A). As rainwater percolates through the vadose zone, it gathers organic matter and accumulates it at the upper part of the water-saturated phreatic zone (McClain et al., Reference McClain, Swart and Vacher1992; Whitaker and Smart, Reference Whitaker and Smart2007). The aerobic or anaerobic oxidation of the organic matter releases 12C-enriched CO2 into the water, thereby decreasing the pH and carbonate saturation by forming carbonic acid ( ${\text{C}}{{\text{O}}_2} + { }{{\text{H}}_2}{\text{O}} \leftrightarrow { }{{\text{H}}_2}{\text{C}}{{\text{O}}_3}$), leading to the dissolution of carbonates (
 ${\text{CaC}}{{\text{O}}_3} + { }{{\text{H}}_2}{\text{C}}{{\text{O}}_3} \leftrightarrow {\text{ C}}{{\text{a}}^{2 + }} + { }2{\text{HC}}{{\text{O}}_3}^ - $), predominantly the metastable aragonite (McClain et al., Reference McClain, Swart and Vacher1992). When carbonates reprecipitate (
 ${\text{C}}{{\text{a}}^{2 + }} + { }2{\text{HC}}{{\text{O}}_3}^ - \leftrightarrow {\text{ CaC}}{{\text{O}}_3} + {\text{ C}}{{\text{O}}_2} + { }{{\text{H}}_2}{\text{O}}$), δ13C and δ18O values shift to more negative due to 12C-enriched dissolved inorganic carbon (DIC) and 16O-enriched meteoric water (Swart, Reference Swart2015; Swart and Oehlert, Reference Swart and Oehlert2018; Smith and Swart, Reference Smith and Swart2022). However, such a good correlation exists only in the bulk carbonate and not in hollow grains with cements directly precipitated from meteoric water or carbonate grains (Fig. 8A). As bulk carbonate δ13C and δ18O values are controlled by contributions from different components within the sediment, a good correlation in the bulk samples might be the result of a contribution from cements that were not part of the hollow grains or some other carbonate clasts. The lack of a good correlation between δ13C and δ18O values of the hollow grains and carbonate grains is evaluated in detail below.
The similarity of the δ13C values of the carbonate grains and hollow grains suggests minor soil-derived DIC of the meteoric water, which is consistent with the sparse vegetation and weak soil formation of the desert environments (Fig. 8A). Hence, when the meteoric water leached carbonate grains, the subsequently reprecipitated cement inherited the δ13C values of the carbonate grains, preserving the marine signature. Overall, negligible soil-derived DIC of the meteoric water and the buffering of the δ13C values by the marine carbonate grains are the reasons for the high δ13C values and a lack of good correlation between δ13C and δ18O of the hollow grains. Nonetheless, a minor contribution from the decay of the C4 vegetation (abundant in arid environments) in the DIC may also have contributed to the high δ13C values of the hollow grains. In contrast to δ13C values, there is a considerable difference in δ18O values between carbonate grains and hollow grains (Figs. 8A and 9A). The higher δ18O values of the carbonate grains, higher than the typical δ18O values of modern shallow marine carbonate platforms (between –5.0‰ and +2.0‰; VPDB; Gischler et al., Reference Gischler, Swart and Lomando2009; Swart et al., Reference Swart, Reijmer and Otto2009; Swart, Reference Swart2015; Smith and Swart, Reference Smith and Swart2022), suggest their formation from evaporated marine water. Unlike carbonate grains, a wide range of δ18O values is observed in hollow grains and cements (Figs. 8, 9A, and 10). First and foremost, the δ18O values of most of the hollow grains lie within the range of the δ18O values of the cement, supporting the inference that the δ18O values of the hollow grains predominantly represent the δ18O values of the cement (Fig. 9A). The considerable shift between the δ18O values of the hollow grains and the δ18O values of the cement in the two most inland samples is possibly due to difficulties in identifying and isolating the hollow grains that are relatively weakly developed in the inland samples (Figs. 5D and 9A).
Before addressing the changes in the cement δ18O values between samples, it is critical to understand the micrometer-scale intra-hollow grain cement δ18O variations within samples (Fig. 9B). A previous study by Vincent et al. (Reference Vincent, Brigaud, Emmanuel and Loreau2017) found a wide range of micrometer-scale δ18O variations in cements precipitated within the intra-skeletal pores of bioclasts by using high-resolution SIMS analyses. Microbial activities, enhancing the pore-fluid alkalinity and promoting the carbonate cement precipitation, and microbial catalysis reactions, encouraging faster growth rate and non-equilibrium carbonate cement precipitation, have been invoked to explain large cement δ18O variations within micrometer scales (Hendry, Reference Hendry1993; Riding, Reference Riding2000; Dietzel et al., Reference Dietzel, Tang, Leis and Köhler2009; Dupraz et al., Reference Dupraz, Reid, Braissant, Decho, Norman and Visscher2009; Gabitov et al., Reference Gabitov, Watson and Sadekov2012; Riechelmann et al., Reference Riechelmann, Deininger, Scholz, Riechelmann, Schröder-Ritzrau, Spötl, Richter, Mangini and Immenhauser2013; Cao et al., Reference Cao, Alsuwaidi, Antler, Zhao and Morad2024). The influence of microbial processes should also be reflected in the cement δ13C values. However, in the studied samples, a large variation is only observed in cement δ18O values (Fig. 9B). Hence, it can be due to changes in either the precipitation temperature or fluid δ18O values rather than the microbial activities. A large variation in temperature, i.e., to create a change of ∼6.3‰ (∼24°C; 0.25‰/°C; Kim and O’Neil, Reference Kim and O’Neil1997) in δ18O values at the micrometer scale, is unlikely in near-surface meteoric environments. Hence, these variations seem likely due to evaporation-related shifts towards high δ18O values of the water during the time of the cement growth, as evaporation is a dominant process in controlling the fluid δ18O values in arid environments (Clark and Fritz, Reference Clark and Fritz1997). The role of evaporation in controlling the δ18O values of the cements is discussed in greater detail towards the end of this section.
The δ18O values of both hollow grains and cement increase inland (Figs. 8B and 10). Higher δ18O values inland can be an artefact of a higher position of the inland samples relative to the groundwater table, placing them within the vadose zone. However, no cement morphologies characteristic of the vadose zone, such as pendant and meniscus cement, were seen in the thin sections of the inland Ghayathi Formation. It is also likely that aeolianites, being only weakly cemented by vadose cements, would have been easily removed by aeolian erosion. In any case, the bladed to blocky cements present in the studied Ghayathi Formation suggest precipitation in the phreatic zone. Since both coastal and inland Ghayathi Formation were stabilised in the phreatic zone, the cements were precipitated in equilibrium with the groundwater and can be expected to have preserved the groundwater isotope ratios (Swart and Oehlert, Reference Swart and Oehlert2018; Lu et al., Reference Lu, Murray, Klaus, McNeill and Swart2024).
Different hollow grains/cement δ18O values between the coastal and inland Ghayathi Formation could reflect a difference in evaporation intensity between coastal and inland areas. The effects of evaporation are first observed in the bulk carbonate δ18O values of the Ghayathi Formation (Arboit et al., Reference Arboit, Steuber, Mohamad, Alsuwaidi and Ceriani2022). In an outcrop of the coastal Ghayathi Formation (K18 in Fig. 1), the bulk sediment δ18O values increase upsection, creating a ∼3.6‰ difference over a 1.5 m thickness. However, such a difference is not observed in the inland Ghayathi Formation (cluster II). Rather, outcrops of inland Ghayathi Formation with 3–7 m thickness have similar (>1.0‰ difference between top and bottom) and comparatively higher δ18O values. The progressive rise in δ18O values of the coastal Ghayathi Formation upsection may be the result of higher evaporation towards the top of the former aquifer. Yet, the lower δ18O values of the coastal Ghayathi Formation relative to the inland Ghayathi Formation suggest lesser evaporation and higher humidity in the areas relatively closer to the Gulf (Patlakas et al., Reference Patlakas, Stathopoulos, Flocas, Kalogeri and Kallos2019).
Similarly, the negative δ18O values of cements in clusters I and II support lower evaporation in low-lying areas of the UAE (Fig. 10). This also suggests that these low-lying areas were not part of a sabkha (unlike the modern day) in the late Quaternary. Nonetheless, with less evaporation, the lower δ18O values of the cements in cluster I most closely resemble the original groundwater δ18O values during the late Quaternary. Similar to the present study, low δ18O values of meteoric cements (minimum value of –8.0‰; VPDB) are also reported from Pleistocene oolitic carbonates in coastal Qatar (Holail, Reference Holail1999).
Despite being located inland and closer to cluster II, the cements in cluster III have much higher δ18O values than cluster II (Fig. 10). These cements must have precipitated from meteoric water that experienced intense evaporation. To quantify evaporation, a unified Craig–Gordon model has been used (Gonfiantini et al., Reference Gonfiantini, Wassenaar, Araguas-Araguas and Aggarwal2018, and references therein; Fig. 12). The details of the model are given in the supplementary material. Overall, the parameters that control the oxygen isotope fractionation during the evaporation and thereby the δ18O of the evaporated water are the isotope composition of the initial water, temperature, relative humidity, ambient atmospheric vapour isotope composition, diffusion and/or mixing at the water–air interface, and the thermodynamic activity (salinity) of water.
Craig–Gordon model showing the changes in the δ18O values of the marine water (A) and freshwater (B) during evaporation under different relative humidities. The initial isotope composition of the marine water is +1.0‰ (salinity of 36 g/L), and freshwater is −6.1‰, the isotope composition of atmospheric vapour is –14.8‰, the temperature is 31–32°C, and the turbulence index is 0.4.

The δ18O values of the groundwater (Fig. 11) are calculated from the δ18O values of the calcite cement following the equation from Kim and O’Neil (Reference Kim and O’Neil1997):
 \begin{equation}1000{\text{l}}{{\text{n}}_{{{\alpha }}\left( {{\text{calcite}} - {\text{water}}} \right)}} = 18.03{ }\left( {{{10}^3}{{\text{T}}^{ - 1}}} \right) - 32.42\end{equation}
Where α is the temperature-dependent fractionation factor of the oxygen isotopes, and T is water temperature in kelvins. In the present study, a groundwater temperature of 31°C is considered, which is the average of the groundwater temperature from coastal to 50 km inland Abu Dhabi and Dubai (Wood, Reference Wood2011). The calculated δ18Owater values (in ‰ SMOW) are shown in Fig. 11. The lowest δ18Owater value recorded in cluster I, –6.0‰, is considered the initial δ18O value of the freshwater, and +1.0‰ is considered the initial δ18O value of the water with a salinity of 36 g/L. The rest of the parameter values considered for the modelling are: (1) temperature of 31–32°C (average of modern groundwater temperature from coastal to 50 km inland Abu Dhabi and Dubai [Wood, Reference Wood2011] and Gulf surface water [Lokier and Steuber, Reference Lokier and Steuber2009]), (2) relative humidity varying between 0% and 95% for freshwater evaporation and 50% and 70% for Gulf water evaporation (Patlakas et al., Reference Patlakas, Stathopoulos, Flocas, Kalogeri and Kallos2019), (3) water activity coefficient of 1 for freshwater and <1 (between 0.7 and 1) for marine water, (4) atmospheric vapour δ18O of −14.8 % (VSMOW) and (5) turbulence index of 0.4 (average of four published atmospheric vapour δ18O values and turbulence indices from deserts in Australia and Africa; table 2 of Gonfiantini et al., Reference Gonfiantini, Wassenaar, Araguas-Araguas and Aggarwal2018) have been considered for the model (see supplementary material for details).
According to the model, Gulf water, even after extreme evaporation (∼90% loss of water), cannot produce δ18O values greater than +10.0‰ (Fig. 12A). This is because at high salinity, ion hydration increasingly affects the isotope fractionation of evaporating water (Clark and Fritz, Reference Clark and Fritz1997). In support, the measured δ18O of water in the subtidal, intertidal, and supratidal areas of the Arabian Gulf adjacent to Abu Dhabi show values no greater than +8.0‰ (see Figure S1). On the other hand, freshwater after evaporation loss exceeding 50% under low humidities can produce δ18O values much greater than +10.0‰ (Fig. 12B). Hence, cements in cluster III with δ18O as high as +17.0‰ likely formed from evaporated freshwater. According to this model, the water with high δ18O values (+7.0‰ to +17.0‰) in cluster III (Fig. 11) is formed after 50–80% evaporation of freshwater under relatively low relative humidities of less than 50% (Fig. 12B). In contrast, water with low δ18O values (–6.0‰ to +3.0‰) in clusters I and II is formed after 0–40% evaporation of the freshwater under high humidities (Figs. 11 and 12B). This model supports the inference that humidity significantly controlled the rate of evaporation and thereby the δ18O values of both the water and the precipitated cement. Irrespective of the differences in evaporation intensity and δ18O values, the negligible difference in δ13C values of the cement between coastal and inland areas (Fig. 8A) suggests significant buffering from a largely carbonate-dominated aquifer in the phreatic zone against changes related to CO2 degassing, and isotope-equilibrium precipitation of the cements.
Freshwater in continental sabkhas generally experiences intense evaporation. For example, the δ18Owater value of the Sabkha Matti on the UAE–Saudi Arabia border is as high as +11.3‰ (VSMOW; Saeed et al., Reference Saeed, Shouakar-Stash, Unger, Wood and Parker2021). Assuming a precipitation temperature of 31°C, the precipitating cement from water with a δ18O value of +11.3‰ can have a δ18O value of +7.7‰ (VPDB; Eq. 1), which is still ∼7‰ lower than the highest δ18O values observed in cluster III (Fig. 10). Also, no evaporite minerals characteristic of a sabkha environment are present in the samples in cluster III. Hence, precipitation from sabkha brines can be excluded.
Another possibility is that the carbonate cements were precipitated from water that underwent extreme evaporation in stagnant bodies of water in playa-type environments. In fact, δ18O values as high as +31.0‰ (VSMOW) of lake water have been reported from modern endorheic, semi-arid to arid environments, such as southwestern Madagascar, the Sahara, western North America (Fontes and Gonfiantini, Reference Fontes and Gonfiantini1967; Fontes et al., Reference Fontes, Gonfiantini and Roche1971; Vallet-Coulomb et al., Reference Vallet-Coulomb, Gasse and Sonzogni2008; Horton et al., Reference Horton, Defliese, Tripati and Oze2016). Moreover, a wide distribution of perennial lakes was reported from the Arabian Peninsula during the late Quaternary (McClure, Reference McClure1976; Garrard and Harvey, Reference Garrard and Harvey1981; Gardner, Reference Gardner1988; Lézine et al., Reference Lézine, Saliege, Robert, Wertz and Inizan1998; Parker et al., Reference Parker, Eckersley, Smith, Goudie, Stokes, Ward, White and Hodson2004; Radies et al., Reference Radies, Hasiotis, Preusser, Neubert and Matter2005; Wilkinson, Reference Wilkinson2005; Rosenberg et al., Reference Rosenberg, Preusser, Risberg, Plikk, Kadi, Matter and Fleitmann2013; Parton et al., Reference Parton, Farrant, Leng, Telfer, Groucutt, Petraglia and Parker2015). Two such lakes reported from Awafi and Wahalah in northern UAE (Fig. 13) are low-altitude lakes located ∼5–25 km away from the coast (Parker et al., Reference Parker, Eckersley, Smith, Goudie, Stokes, Ward, White and Hodson2004; Preston et al., Reference Preston, Thomas, Goudie, Atkinson, Leng, Hodson and Walkington2015). Hence, it is likely that the carbonate cements in cluster III were precipitated from meteoric water that was exposed to intense evaporation in playa lakes in the late Quaternary. The absence of evaporites despite intense evaporation is possibly due to the low salinity of the lake water, such that even after intense evaporation, the saturation level for evaporite mineral precipitation was not achieved. In support, the weak/no correlation between the cement δ18O values and element concentrations (Ca, Mg, and Sr; Fig. 7D–F) suggests that the evaporation was intense enough to enrich the water with 18O but not sufficient to form a brine, similar to modern conditions reported from the Sahara, Madagascar and western North America.
(A) Map showing predominant moisture sources for precipitation in the study area since the Late Holocene. Arrows show the northern moisture source (NMS) from the Mediterranean Sea, and the southern moisture source (SMS) from the Indian Ocean. The dashed line shows the location of the intertropical convergence zone (ITCZ). The pink square indicates the study area, and the yellow dots indicate the late Quaternary lake deposits in Awafi and Walalah (UAE), the groundwater recharge area in Al Ain (UAE), and the late Quaternary Hoti cave deposit (Oman). (B) Map showing predominant moisture sources in the Early Holocene to the Late Pleistocene. Note the northward migration of the ITCZ. Maps are modified after Fleitmann et al. (Reference Fleitmann, Burns, Mangini, Mudelsee, Kramers, Villa and Neff2007) and Fleitmann et al. (Reference Fleitmann, Burns, Matter, Cheng and Affolter2022).

Precipitation oxygen isotope composition
Late Quaternary groundwater δ18O values derived from the cements δ18O values of the Ghayathi Formation are compared to the modern groundwater δ18O values (Fig. 11; Weyhenmeyer et al., Reference Weyhenmeyer, Burns, Waber, Macumber and Matter2002; Wood et al., Reference Wood, Sanford and Habshi2002; Dawoud et al., Reference Dawoud, Hameed, Alhashmi, Dash, Athamneh, Sallam and Othman2019; Saibi et al., 2023; Fang et al., Reference Fang, Yang, Yi, Xiong, Shen, Ahmed, ElHaj, Alshamsi, Murad, Hussein and Aldahan2024). Late Quaternary δ18Owater values of cluster I are significantly lower than the modern supratidal sabkha δ18Owater values (this study and Wood et al., Reference Wood, Sanford and Habshi2002; Fig. 11). The lowest δ18Owater value recorded in cluster I is 9.5‰ lower than the lowest δ18Owater values recorded in supratidal sabkha (Fig. 11). Interestingly, the δ18Owater values of cluster I are similar to the modern groundwater δ18O values in the recharge areas of Abu Dhabi emirate (Al Ain) and northern Oman (Jabal Akhdar Mountain and Wadi Samail Catchment; Fig. 13), with a difference of only +2.0‰ to +3.0‰ between the lowest δ18Owater values of cluster I and modern groundwater (Weyhenmeyer et al., Reference Weyhenmeyer, Burns, Waber, Macumber and Matter2002; Dawoud et al., Reference Dawoud, Hameed, Alhashmi, Dash, Athamneh, Sallam and Othman2019). Similarly, the δ18Owater values of cluster II are lower than those of the modern supratidal sabkha but are similar to those of modern groundwater in the recharge areas of Abu Dhabi emirate and northern Oman.
These low late Quaternary δ18O values suggest either a change in precipitation intensity, a change in moisture source, or both, compared to modern precipitation. As the δ18O value of precipitation decreases with an increase in intensity (Rozanski et al., Reference Rozanski, Araguás‐Araguás and Gonfiantini1993), these low δ18O values suggest limited evaporation and high precipitation for the origin of groundwater that cemented the Ghayathi Formation in the late Quaternary. The lower δ18Owater values in clusters I and II, similar to or lower than the δ18O values of the groundwater in the modern recharge areas, indicate that the late Quaternary precipitation intensity in low-altitude areas of the UAE was similar to or higher than the modern precipitation in recharge areas (Fig. 11). The high precipitation is also supported by the expansion of lakes (during 410 ka to 8.5 ka) to low-altitude, coastal areas of the northeastern Arabian Peninsula and the occurrence of wadi deposits (fluvial Hili Formation) that were formed by the perennial surface water discharge from the Hajar Mountains to the coastal lowlands (McClure, Reference McClure1976; Garrard and Harvey, Reference Garrard and Harvey1981; Gardner, Reference Gardner1988; Lézine et al., Reference Lézine, Saliege, Robert, Wertz and Inizan1998; Parker et al., Reference Parker, Eckersley, Smith, Goudie, Stokes, Ward, White and Hodson2004; Radies et al., Reference Radies, Hasiotis, Preusser, Neubert and Matter2005; Wilkinson, Reference Wilkinson2005; Rosenberg et al., Reference Rosenberg, Preusser, Risberg, Plikk, Kadi, Matter and Fleitmann2013; Parton et al., Reference Parton, Farrant, Leng, Telfer, Groucutt, Petraglia and Parker2015; Preston et al., Reference Preston, Thomas, Goudie, Atkinson, Leng, Hodson and Walkington2015).
Apart from the intensity, the low δ18O values of the groundwater also indicate an Indian Ocean moisture source (known as southern moisture source [SMS]) for the late Quaternary precipitation, unlike the Mediterranean moisture source (known as northern moisture source [NMS]) for the Recent precipitation (Figs. 11 and 13; Burns et al., Reference Burns, Fleitmann, Matter, Neff and Mangini2001; Weyhenmeyer et al., Reference Weyhenmeyer, Burns, Waber, Macumber and Matter2002; Arz et al., Reference Arz, Lamy, Patzold, Muller and Prins2003; Fleitmann et al., Reference Fleitmann, Burns, Mudelsee, Neff, Kramers, Mangini and Matter2003a, Reference Fleitmann, Burns, Neff, Mangini and Matter2003b, Reference Fleitmann, Burns, Neff, Mudelsee, Mangini and Matter2004; Enzel et al., Reference Enzel, Kushnir and Quade2015; Nicholson et al., Reference Nicholson, Pike, Hosfield, Roberts, Sahy, Woodhead and Cheng2020). Previous studies based on low speleothem δ18O values (as low as –6.0‰ VPDB in Hoti cave; Fig. 13; Burns et al., Reference Burns, Matter, Frank and Mangini1998, Reference Burns, Fleitmann, Matter, Neff and Mangini2001; Fleitmann et al., Reference Fleitmann, Burns, Mudelsee, Neff, Kramers, Mangini and Matter2003a, Reference Fleitmann, Burns, Neff, Mangini and Matter2003b, Reference Fleitmann, Burns, Neff, Mudelsee, Mangini and Matter2004, Reference Fleitmann, Burns, Mangini, Mudelsee, Kramers, Villa and Neff2007), well aligned δ18O and δ2H values of the speleothem fluid inclusions and local meteoric water line of precipitation sourced from the SMS (Weyhenmeyer et al., Reference Weyhenmeyer, Burns, Waber, Macumber and Matter2002; Fleitmann et al., Reference Fleitmann, Burns, Matter, Cheng and Affolter2022), flooding and development of lakes in interiors of the deserts (McClure, Reference McClure1976; Schulz and Whitney, Reference Schulz and Whitney1986; Lézine et al., Reference Lézine, Saliege, Robert, Wertz and Inizan1998; Rosenberg et al., Reference Rosenberg, Preusser, Fleitmann, Schwalb, Penkman, Schmid, Al-Shanti, Kadi and Matter2011), and the presence of C3 grasslands (Parker et al., Reference Parker, Eckersley, Smith, Goudie, Stokes, Ward, White and Hodson2004, Reference Parker, Goudie, Stokes, White, Hodson, Manning and Kennet2006b; Preston et al., Reference Preston, Thomas, Goudie, Atkinson, Leng, Hodson and Walkington2015) suggest that an intense summer precipitation from the ISM prevailed in the northeastern Arabian Peninsula in the Early Holocene to Late Pleistocene (Fig. 13). The δ18O values of the cements in cluster I, with a mean of –6.0‰, strongly support an SMS as the source for the precipitation and prevalence of the ISM in the late Quaternary northeastern Arabian Peninsula. The intensification of the ISM is likely due to the northward migration of the ITCZ, influenced by the stronger surface heating and greater solar insolation in boreal summers (Fig. 13; Webster et al., Reference Webster, Magana, Palmer, Shukla, Tomas, Yanai and Yasunari1998; Byrne et al., Reference Byrne, Pendergrass, Rapp and Wodzicki2018).
In contrast to the low δ18Owater values from ISM precipitation, the exceptionally high δ18O values of groundwater in cluster III suggest either dry seasons within the monsoon or intermittent and transient arid intervals between humid intervals/monsoon during which ponding water with low salinity experienced intense evaporation.
In other words, the δ18Owater values showing a noticeable increase from the late Quaternary to modern indicate a diminished precipitation intensity/change in moisture source (SMS to NMS) of modern precipitation in the low-altitude northeastern Arabian Peninsula (Fig. 11). As mentioned, the seasonal cycle of solar insolation controls the movement of the ITCZ north and south of the equator (Schneider et al., Reference Schneider, Bischoff and Haug2014; Byrne et al., Reference Byrne, Pendergrass, Rapp and Wodzicki2018). When the Earth warms up due to climate change, the movement of the ITCZ is restricted, and precipitation is more limited to lower latitudes (Lau and Kim, Reference Lau and Kim2015; Byrne et al., Reference Byrne, Pendergrass, Rapp and Wodzicki2018; Kang et al., Reference Kang, Shin and Xie2018; Donohoe et al., Reference Donohoe, Atwood and Byrne2019; Asmerom et al., Reference Asmerom, Baldini, Prufer, Polyak, Ridley, Aquino, Baldini, Breitenbach, Macpherson and Kennett2020; Yuan et al., Reference Yuan, Chiang, Liu, Bijaksana, He, Jiang, Imran, Wicaksono and Wang2023). This suggests that climate change will intensify desert conditions in the UAE and other countries in the Middle Eastern region.
Conclusions
The late Quaternary carbonate-rich aeolianites of the Ghayathi Formation outcrop as erosional remnants or zeugen, capped by the marine Fuwayrit Formation in coastal areas and as isolated outcrops in inland areas of Abu Dhabi and Dubai. The 14C ages of the marine Fuwayrit Formation are compromised by contamination from young carbon; however, its deposition during the last interglacial highstand indicates a Late Pleistocene age older than 125 ka for the underlying Ghayathi Formation in the coastal areas. The absence of the Fuwayrit Formation in inland areas makes it difficult to constrain the age of the inland Ghayathi Formation, which is, however, petrographically indistinguishable from the coastal occurrences.
In the Ghayathi Formation, the carbonate cements are present as well-developed, bladed to blocky calcite crystals inside and outside a thin micrite rim, visible as coated hollow grains under the microscope. These cements/hollow grains are the product of meteoric diagenesis when unstable carbonate grains were leached and later reprecipitated as cements within and around the remnant layer during humid episodes in the late Quaternary. The SEM–EDS and major element analysis (Ca, Mg, and Sr) by ICP-OES analysis indicate a low-Mg calcite composition of the cement, which is characteristic of cement precipitating from meteoric water. High Sr concentrations and high δ13C values of the cements indicate precipitation from meteoric water in a diagenetic environment with a low water–rock ratio, buffered by the chemistry and isotopic composition of the marine carbonates.
The δ18O values of the hollow grains isolated from weakly consolidated sediments and the individual spots in the cements analysed by SIMS show a wide range, varying between −9.0‰ in coastal the Ghayathi Formation to +12.7‰ in the inland Ghayathi Formation. The low and high δ18O values of the cements imply formation from weakly and strongly evaporated groundwater under high and low humidities, respectively. This inference is also backed by the results of the Craig–Gordon evaporation model. Regardless, the low δ18O values of the cements in the coastal Ghayathi Formation suggest intense precipitation in the low-altitude areas of the UAE in the late Quaternary, in a similar or greater intensity compared to the modern recharge areas in the Hajar Mountains, and predominance of a southern or Indian Ocean moisture source for the precipitation in the late Quaternary. This was the result of the northward migration of the ITCZ and intensification of the ISM. It has been shown that the oxygen isotopic composition of meteoric cements of continental aeolianites can provide important information about climate change in arid regions. Further interpretations are currently limited because of uncertainties about the precise timing of the deposition, stabilisation, and cementation of the Ghayathi Formation.
Supplementary material
The supplementary material for this article can be found at https://doi.org/10.1017/qua.2026.10073.
Acknowledgments
We thank Cyril Aubry for his help with the SEM imaging and mapping. We thank Frédéric Couffignal and Nurlan Akhmetov for their support with the SIMS and ICP-OES analysis, respectively. We thank two anonymous reviewers and Senior Editor Lewis Owen for their valuable suggestions, which helped us improve the earlier draft of the manuscript. We thank Karin Perring at QR, and Sian Gordon and Zoe Lewin at CUP for their assistance with the manuscript. This research work is supported by Khalifa University, Abu Dhabi (RIG-2023-061).
Data availability
All data used in the manuscript are provided in the supplementary material (e-component).
Competing interests
The authors declare that they have no known competing financial interests or personal relationships that could have appeared to influence the work reported in this paper.
Author contributions
Writing – original draft: S.P.S. Writing – review and editing: S.P.S., T.S., M.A., M.W. Conceptualisation: S.P.S., T.S., M.A. Data curation: S.P.S., T.S., M.A., M.W., I.M.H., K.M. Formal analysis: S.P.S., T.S., M.A., M.W., I.M.H., K.M. Investigation: S.P.S., T.S., M.A., M.W., I.M.H., K.M. Funding acquisition and resources: T.S., M.A. Project administration: T.S., M.A.