Introduction
Gyrodactylus salaris Malmberg, 1957 infections on Atlantic salmon Salmo salar in Norwegian rivers have caused dramatic ecological and economic losses for the past four decades (Johnsen, Reference Johnsen1978; Johnsen & Jensen, Reference Johnsen and Jensen1986, Reference Johnsen and Jensen1991; Heggberget et al., Reference Heggberget, Johnsen, Hindar, Jonsson, Hansen, Hvidsten and Jensen1993; Mo, Reference Mo, Pike and Lewis1994; Bakke et al., Reference Bakke, Harris and Cable2002). This monogenean parasite was probably introduced during the 1970s with imported salmon parr from Swedish hatcheries located in the Baltic drainage area where relatively resistant salmon occur (Malmberg, Reference Malmberg1993, Reference Malmberg2004). The Norwegian salmon, in contrast, demonstrated a high susceptibility to the parasite, which resulted in devastating infections within a few years. However, laboratory experiments have shown that susceptible salmon strains also occur in other parts of Europe including Ireland, Scotland and Denmark (Bakke & Mackenzie, Reference Bakke and Mackenzie1993; Dalgaard et al., Reference Dalgaard, Nielsen and Buchmann2003, Reference Dalgaard, Larsen, Jorndrup and Buchmann2004; Heinecke et al., Reference Heinecke, Martinussen and Buchmann2007), which indicates the importance of implementing protective measures in order to prevent parasite spread to these areas. Questions associated with the genetic and physiological background for resistance and susceptibility are highly relevant, and answers may eventually lead to control of this parasitosis. A number of studies have elucidated elements in the resistance pattern of salmon with regard to G. salaris infections (Harris et al., Reference Harris, Soleng and Bakke1998; Lindenstrøm et al., Reference Lindenstrøm, Sigh, Dalgaard and Buchmann2006; Matejusova et al., Reference Matejusova, Felix, Sorsa-Leslie, Gilbey, Noble, Jones and Cunningham2006; Collins et al., Reference Collins, Olstad, Sterud, Jones, Noble, Mo and Cunningham2007a, Reference Collins, Olstad, Sterud, Jones, Noble, Mo and Cunninghamb; Kania et al., Reference Kania, Larsen, Ingerslev and Buchmann2007), but no final conclusion of decisive factors has been reached. The present study presents molecular and immunohistochemical studies, which can explain, at least partly, the different vulnerability of East Atlantic and Baltic salmon strains.
Materials and methods
Fish
East Atlantic salmon eggs from the Danish River Skjern were hatched and fry reared to the age of 4 months at the Danish Center for Wild Salmon, Jutland, and subsequently brought to the experimental university facility, University of Copenhagen, Frederiksberg. The average weight and body length were 6.7 ± 4.2 g and 9.5 ± 1.8 cm, respectively. Baltic salmon eggs from the River Ume Älv in Sweden were directly imported from the Swedish hatchery and hatched at the Copenhagen University facility, and fry were kept for 4 months until experimentation. The average weight and length were 6.5 ± 2.7 g and 9.5 ± 1.3 cm, respectively. All fish were acclimatized in four 120 l tanks for 2 weeks before experimentation and fed (1% of biomass daily) the same pelleted dry feed (1.5 mm, 47% protein, 20% lipids and 14% carbohydrates; Ecostart 17, Biomar, Brande, Denmark).
Parasites
A laboratory stock of the Norwegian form of Gyrodactylus salaris from the River Lærdalselva was originally imported from Oslo (Norway) and propagated in our laboratory on Scottish salmon for 5 years before experimentation (Dalgaard et al., Reference Dalgaard, Nielsen and Buchmann2003).
Water and fish tanks
The water used was a 50:50 mixture of deionized water and municipal water (Frederiksberg County), which was dechlorinated by continuous aeration for 1 week before use. The 120 l tanks were kept aerated and with internal biofilters (Eheim, Germany) in a thermostat-controlled room at 12–13°C with a 12 h light:12 h dark cycle.
Experimental design
A total of 180 fish were used and allocated randomly to individual groups. For each strain of salmon, a total of 90 salmon were divided into three groups (two experimental replicates and one control group). Thus, 120 salmon (60 fish from River Ume Älv and 60 fish from River Skjern) were exposed to parasites. This was done by exposing (for 24 h) two groups each of 30 River Ume Älv fish to 600 live parasites and two groups each of 30 River Skjern fish to 600 live parasites. The infection was performed by placing the fish with infected salmon fins carrying parasites in 120 l aquaria with lowered water levels. Another 60 salmon (2 × 30 control fish) were kept and handled similarly, but without inducing infection (sham infection with uninfected fins).
Sampling for molecular analysis
At days 0, 16, 22, 29, 36 and 43, a total of four individuals from each tank were randomly sampled for molecular analysis. Then sampling for parasite counting was performed (five other fish were removed for this purpose) to prevent any effect on gene expression due to handling. Fish were anaesthetized and killed in MS-222 (200 mg/l). Fin tissue samples from the individual fish were conserved in RNAlater™ (Sigma-Aldrich, Copenhagen, Denmark).
Parasite counting
Subsamples (five specimens) of fish in all six groups were examined (days 0, 16, 22, 29, 36 and 43). Following anaesthesia of fish in MS-222 (50 mg/l), the parasites were counted on all body regions (Buchmann & Uldal, Reference Buchmann and Uldal1997) under a dissection microscope (7–40 × magnification). The infection level was expressed as mean intensity (mean number of parasites per infected fish) (Bush et al., Reference Bush, Lafferty, Lotz and & Shostak1997).
Isolation of RNA and cDNA synthesis
RNA was isolated from sonicated fin and skin tissue with GenElute™ Total RNA kit (Sigma-Aldrich). Removal of genomic DNA was conducted with deoxyribonuclease I (Sigma-Aldrich). Finally, the quality was checked with 1% agarose electrophoresis of 2 μl of the RNA and by measuring the ratio of absorptions at 260 and 280 nm. An amount of 400 ng RNA was used in each 20 μl reaction for cDNA synthesis with TaqMan® Reverse Transcription Reagents (Applied Biosystems, Naerum, Denmark). The cDNA was diluted ten times in RNase-free water (Invitrogen, Taastrup, Denmark).
Real-time quantitative PCR (Q-PCR)
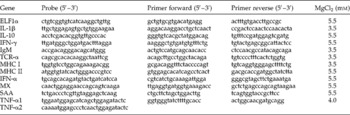
A total of 2.5 μl of the diluted cDNA were used as template in a 12.5 μl real-time quantitative polymerase chain reaction using JumpStart™ Taq ReadyMix™ (Sigma-Aldrich) in the Mx3000P™ real-time PCR system (Stratagene, La Jolla, California, USA). Cycle conditions for all reactions were one cycle of pre-denaturation at 94°C for 2 min and 45 cycles with denaturation at 94°C for 30 s. Annealing and elongation were in one step at 60°C for 1 min with end point measurement. Expression analyses were performed for the immune-relevant genes encoding interferon-γ (IFN-γ) (GenBank accession number AY795563), MX isoforms 1, 2 and 3 (GenBank accession numbers for MX1: U66475, MX2: U66476, MX3: U66477), MHC I (conserved region of ten sequences presented by Grimholt et al., Reference Grimholt, Drablos, Jorgensen, Hoyheim and Stet2002) and IgM (GenBank accession number S48658). Primers, probes (designed from the above-mentioned sources) and MgCl2 concentrations used are listed in table 1. Elongation factor α1 (ELF-1α) (GenBank accession number AF321836) was used as the housekeeping gene, as it has been shown to be the least regulated gene among several others and very useful for the study of expression of immune-relevant genes (Raida & Buchmann, Reference Raida and Buchmann2008).
Genes investigated with data on primers and probes (Kania et al., Reference Kania, Larsen, Ingerslev and Buchmann2007) used for QPCR, together with MgCl2 concentrations.

Tumour necrosis factor (TNF)-α1 and 2 were amplified in a duplex reaction with the TNF-α1 forward and reverse primers together with both the TNF-α1 and 2 probes.
Analysis of Q-PCR data
Data were analysed according to the 2− ΔΔC t method by Livak & Schmittgen (Reference Livak and Schmittgen2001). Change in threshold cycle number (ΔC t) was calculated by the difference in the C t between the target gene and the housekeeping gene for each individual. The means of the control groups (uninfected groups for each sampling point for each salmon strain) were calculated. For each salmon strain, the ΔΔC t values were then calculated as the difference between the ΔC t of the infected individual and the average of the uninfected group at the sampling point. The t-test was used to test whether the ΔΔC t values of the replicas were different. If not, the data of a replica were merged into one group. The values for each group at each sampling point were averaged and standard error of the mean calculated before calculating folds as 2–ΔΔC t. The 95% confidence intervals of the fold value were then calculated according to Livak & Schmittgen (Reference Livak and Schmittgen2001). If the fold value was greater than 1, the fold was denoted as a fold increase (positive values); if it was less than 1, the negative reciprocal was calculated and the result denoted as a fold decrease (negative values); and if the fold value was equal to 1, the target gene was considered unregulated. However, in order to detect substantial regulations, only regulation of more than threefold was considered. The t-test was used to detect differences between groups using a 5% probability level.
Histology and immunohistochemistry
Tail fins infected with G. salaris were taken from River Skjern salmon and River Ume Älv salmon at day 22. The samples (from two fish from each fish group; Rivers Skjern and Ume) were fixed for 24 h in 10% neutral formalin and subsequently transferred to 70% ethanol. Following dehydration in graded ethanol series, the fins were paraffin embedded and sectioned (3 μm) and mounted on pretreated slides. The slides were either stained directly with haematoxylin and eosin according to standard methods, or parallel sections were reacted with antibodies raised against human CD3 (polyclonal rabbit anti-human CD3, A0452, DAKO, Glostrup, Denmark) (Bakke-McKellep et al., Reference Bakke-McKellep, Frøystad, Lilleng, Dapra, Refstie, Krogdahl and Landsverk2007) in order to detect cell proliferation in fins from the two salmon types (Lilleeng et al., Reference Lilleeng, Penn, Haugland, Xu, Bakke, Krogdahl, Landsverk and Frøystad-Saugen2009).
After the primary incubation and subsequent washing, the Envision® system (DAKO) was used with the secondary peroxidase-conjugated antibody, and 3-amino-9-ethylcarbazole was used as substrate. Counterstaining with Mayer's haematoxylin was subsequently performed.
The enumeration of CD3-positive cells in microscopic sections was carried out on serial sections from the fins of each of the groups using computer-assisted microscopy. The number of pixels in the studied regions was converted to areas using the Image-Pro® Analysis program (Media Cybernetics, L. P., Silver Spring, Maryland, USA).
Results
Challenge infection
The duplicate groups of River Skjern and River Ume Älv, respectively, did not differ significantly within the strain with respect to parasite loads and gene expression profile. Therefore, the duplicate groups were pooled for further calculations and presentation. Investigations confirmed that the G. salaris population increased rapidly on Atlantic salmon from River Skjern, but showed a modest performance on skin and fins of Baltic salmon from River Ume Älv. From day 22 post-infection, the mean intensity decreased on River Ume Älv salmon (maximum infection of 122 parasites per host at day 15), whereas the parasite burden on River Skjern salmon continued to increase to high levels (maximum intensity of 3000 parasites per fish on day 43) (table 2).
Course of Gyrodactylus salaris infection of salmon from River Skjern and River Ume Älv through 43 days (ten fish per sample, duplicates pooled).

Gene expression in fins
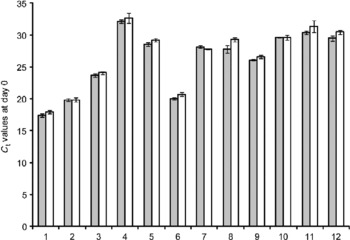
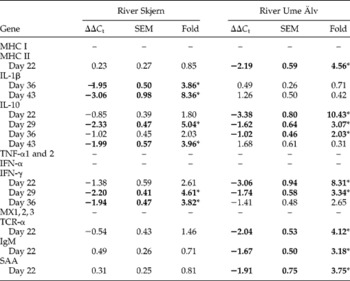
The tested genes all showed a constitutive expression although at a different level (fig. 1). Following challenge, River Skjern salmon (highly susceptible) showed significant regulation of a few genes in the fin tissue investigated. Thus, a significant up-regulation of the interleukin-1β (IL-1β) gene was seen on days 36 and 43, interferon-γ (IFN-γ) on days 29 and 36 and IL-10 on days 29 and 43. River Ume Älv salmon (less susceptible) showed significant up-regulation of genes encoding IL-10 (up to 11-fold) on days 29, 36 and 43; MHC II on day 22; IgM on day 22; serum amyloid A (SAA) on day 22; T-cell receptor (TCR)-α on day 22; and finally, IFN-γ on days 22 and 29 (table 3).
Basic transcript of investigated genes in fin tissue of two salmon strains at day 0 (uninfected Control fish). C t values and SEM for each gene. Threshold values (C t) are indicated by shaded (River Skjern) and white columns (River Ume Älv). Numbers indicate the genes: 1 for ELF-1α; 2 for MHC I; 3 for MX 1, 2 and 3; 4 for IL-10; 5 for IgM; 6 for MHC II; 7 for IFN-α; 8 for SAA; 9 for TCR-α; 10 for IL-1β; 11 for IFN-γ; 12 for TNF-α1 and 2.

Expression of immune-relevant genes in fins from the two salmon strains during infection with Gyrodactylus salaris expressed as fold up-regulation.

Genes that were regulated are indicated in bold. Only days with significant regulation are shown with detailed ΔΔC t values, SEM and fold. *Significantly different from time point control, P < 0.05 (t-test).
Histology and immunohistochemistry
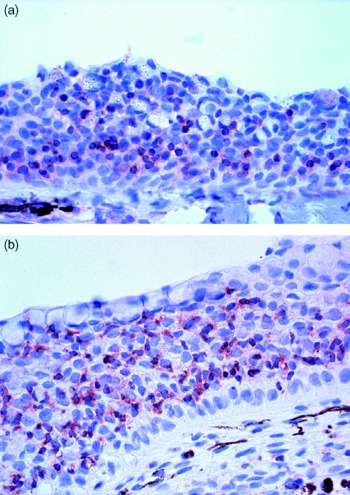
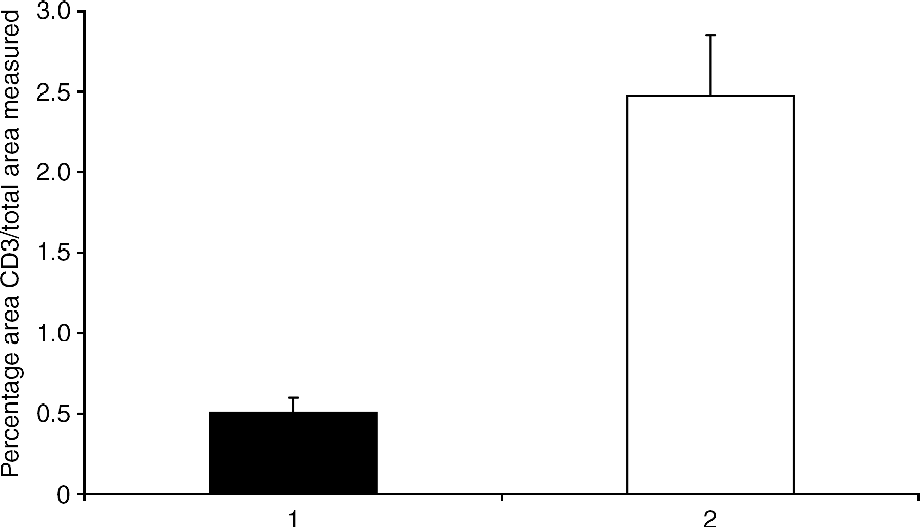
Histology indicated infiltration with inflammatory cells in the epidermis of both groups, but a trend was seen for more inflammatory cells (polymorphonuclear granulocytes) in the epidermis of highly susceptible salmon (not shown). Fin epidermis from highly susceptible salmon (River Skjern) showed a higher occurrence of CD3-positive cells compared with fin epidermis from the less susceptible (River Ume Älv) salmon that contained few of these cells (fig. 2a and b). The percentage occurrence of the cell types in the epidermis in the two groups of fish was compared quantitatively and showed a significantly higher percentage of CD3-positive cells in the highly susceptible fish (2.5% compared with 0.51% in the less susceptible fish (fig. 3)).
Immunohistochemical detection of CD3-positive cells (stained red) in salmon tail fin epidermis at 22 days post-infection. (a) Less susceptible River Ume Âlv salmon; (b) highly susceptible River Skjern salmon, note the higher density of stained cells compared to River Ume Âlv salmon epidermis.

Percentage of CD3-positive cells in tail fin epidermis from River Ume Älv (black column) and River Skjern (white). Significantly different densities (P = 0.004, t-test).
Discussion
The present work has confirmed that the River Skjern salmon is highly susceptible to infections with the Norwegian strain of G. salaris. This is in accordance with previous work on this and other strains of East Atlantic salmon (Bakke & Mackenzie, Reference Bakke and Mackenzie1993; Bakke et al., Reference Bakke, Harris and Cable2002; Dalgaard et al., Reference Dalgaard, Nielsen and Buchmann2003, Reference Dalgaard, Larsen, Jorndrup and Buchmann2004; Heinecke et al., Reference Heinecke, Martinussen and Buchmann2007; Kania et al., Reference Kania, Larsen, Ingerslev and Buchmann2007). Likewise, the low susceptibility of Baltic salmon strains to infection with this parasite was confirmed. However, the basic elements in fish skin responsible for the observed differences in susceptibility are still enigmatic. This is also the case with other parasite systems such as the ectoparasite Lepeophtheirus salmonis infecting salmon skin (Fast et al., Reference Fast, Muise, Easy, Ross and Johnson2006; Jones et al., Reference Jones, Fast and Johnson2008). During a series of previous investigations, a number of immune-relevant molecules have been in focus without providing a clear description of the events leading to resistance to G. salaris infection. Thus, authors have focused on lysozyme in fin tissue (Buchmann & Uldal, Reference Buchmann and Uldal1997), mucous cell densities and physiological properties (Buchmann & Uldal, Reference Buchmann and Uldal1997; Sterud et al., Reference Sterud, Harris and Bakke1998), mucus characteristics (Buchmann, Reference Buchmann1998b; Jørndrup & Buchmann, Reference Jørndrup and Buchmann2005), complement (Buchmann, Reference Buchmann1998a; Harris et al., Reference Harris, Soleng and Bakke1998), FIP2 molecules (Collins et al., Reference Collins, Olstad, Sterud, Jones, Noble, Mo and Cunningham2007a), a thymidylate kinase (Collins et al., Reference Collins, Olstad, Sterud, Jones, Noble, Mo and Cunningham2007b) and differential expression of cytokine genes (Kania et al., Reference Kania, Larsen, Ingerslev and Buchmann2007). Although these factors may be involved to some extent in resistance towards G. salaris, the exact mechanism of action is not yet properly described. The present investigation has elucidated the difference in the regulation of a number of central immune-relevant genes in fins from the two salmon types following infection. In addition, immunohistochemical studies have demonstrated clear differences in infiltration of CD3-positive cells in the epidermis of the two salmon strains during infection. The exact nature of the reaction of these salmon cells with this commercial antibody raised against the epsilon chain of human CD3 is unclear (Bakke-McKellep et al., Reference Bakke-McKellep, Frøystad, Lilleng, Dapra, Refstie, Krogdahl and Landsverk2007). Thus, the CD3 nature of these cells has been questioned (Liu et al., Reference Liu, Moore, Koppang and Hordvik2008). However, the antibody seems to identify a prominent fish cell type in the present work, and the different occurrence of these cells indicates a higher proliferation of epidermal cells in highly susceptible salmon compared with resistant salmon. Thus, the present work indicated that the susceptible salmon do respond to infection, but evidently with ineffective tools. In fact, the IL-1β response is much more pronounced in susceptible salmon compared with the resistant fish, but it does not appear to result in any effective anti-parasitic microhabitat of the skin. Proliferation of mucous cells and epithelial cells (nutritive elements for a monopisthocotylean monogenean such as G. salaris) results from IL-1β production and may in fact benefit the parasites. This is in accordance with studies conducted by Lindenstrøm et al. (Reference Lindenstrøm, Sigh, Dalgaard and Buchmann2006). On two occasions, IFN-γ (days 29 and 36) and IL-10 (days 29 and 43) were found to be moderately up-regulated. This expression profile may suggest that the highly susceptible fish respond with production of pro-inflammatory cytokines without involving effective anti-parasitic molecules. Activation of similar genes has also been observed in salmon infected with salmon louse (Fast et al., Reference Fast, Muise, Easy, Ross and Johnson2006; Jones et al., Reference Jones, Fast and Johnson2008) without eliciting an immediate reduction in the parasite burden. The gene expression in the less susceptible River Ume Älv salmon differed in many ways from this profile. The genes activated in fins from that strain encoded MHC II, IL-10, IFN-γ, IgM, TCR-α and SAA. These reactions were particularly evident during the later phase, where the infection was kept under control in Baltic salmon. In fact, the immune-regulating cytokine IL-10 was found up-regulated (up to tenfold) from day 22 and until the end of the experiment. Exactly this phase was characterized by a low worm burden. This peptide is considered to be immunoregulatory (anti-inflammatory), and production of this molecule often follows an up-regulation of IL-1β. It could keep the cytokine at a low level and potentially block mucous cell proliferation and thereby block nutrient production for the ectoparasites. IL-10 was also found up-regulated in susceptible fish, but at a lower level and probably in response to the IL-1β production. Previous experiments support the notion that part of the anti-parasitic epidermal response is related to starvation of parasites through a lack of excess mucus production and sloughing of epithelial cells. Thus, Dalgaard et al. (Reference Dalgaard, Nielsen and Buchmann2003) showed that less susceptible Baltic salmon responding to G. salaris showed a significantly lower mucous cell density in fins compared with highly susceptible salmon, which in all cases showed significantly higher mucous cell densities. This starvation strategy could be combined with the production of molecules affecting the parasites in a negative way. One of several possible candidates to take the role as an effective anti-parasitic molecule in Baltic salmon skin could be SAA, which is able to bind directly to pathogens (Shah et al., Reference Shah, Hari-Dass and Raynes2006). Likewise, cell markers such as MHC II and IgM may also reflect the possibility that certain reactive cells exert an anti-parasitic effect in the fish epidermis, but this point must be further investigated. The slight up-regulation of the IgM gene could be interpreted as an indication of antibody involvement in the response. However, Western blot analyses could not confirm that salmon produce IgM antibodies against G. salaris (Buchmann et al., Reference Buchmann, Madsen and Dalgaard2004). However, it cannot be excluded that a number of other factors, which were not explored in this investigation (other immunoglobulin types and antimicrobial peptides), may have additional negative effects on the parasites. The results suggest that epidermal responses against ectoparasites may be approached from both an ecological angle (parasites overgrazing the host surface and leaving the field depleted of nutrients) and an immunological angle (the grazing field left with noxious elements only). In other words, the resistant fish apply a ‘scorched-earth strategy’. In this context, it should be noted that a host response will not always lead to rejection of parasites, but will in some cases (in susceptible fish) re-establish the grazing field for the browsing ectoparasites. Thus, a host response reflected by proinflammatory cytokines is not necessarily beneficial in terms of parasite rejection and control.
Acknowledgements
This study was performed under the Danish Fish Immunology Research Network DAFINET (www.dafinet.dk) supported by the Danish Council of Strategic Research (grant 2101-08-0017). The authors are indebted to Dr Tor Atle Mo, Oslo, Norway, for providing the original G. salaris strain.