


Introduction
The development of assisted reproductive technologies represents an important advance in animal production improvement. However, when embryos are produced or manipulated in vitro, their developmental potential decreases significantly and impinges upon the production of a viable offspring. Regardless of the broad applications of in vitro embryo production techniques, it has been demonstrated that the efficiency of producing healthy offspring is lower compared with natural conception. The pregnancy rates resulting from the transfer of in vitro-derived embryos vary from 12 to 50% at 60 days of gestation depending on culture conditions (Peterson & Lee, Reference Peterson and Lee2003). For embryos produced by somatic cell nucleus transfer (SCNT), this scenario is even worse. The low efficiency of animal cloning (1–10%) of live births from 100 cloned embryos transferred to a surrogated mother (Solter, Reference Solter2000) is still one of the most complex challenges of this technique.
Bovine embryos that will be transferred to a surrogate mother are selected at the blastocysts stage using noninvasive methods such as their morphological features, in accordance with the 4th Edition Manual of the International Embryo Transfer Society (IETS; that can be accessed at http://www.iets.org/pubs_educational.asp). However, even when the selected embryos are morphologically similar, many of them are not able to implant or to maintain a normal pregnancy. It has been demonstrated that embryo morphology at the blastocyst stage does not reflect its developmental potential as many developmental crucial genes might be aberrantly expressed in embryos with otherwise adequate morphology (Niwa et al., Reference Niwa, Miyazaki, Nichols, Zevnik, Anastassiadis and Klewe-Nebenius2000; Boiani et al., Reference Boiani, Eckardt, Schöler and McLaughlin2002; Wrenzycki et al., Reference Wrenzycki, Herrmann, Lucas-Hahn, Korsawe, Lemme and Niemann2005; Rodríguez-Alvarez et al., Reference Rodríguez-Alvarez, Cox, Tovar, Einspanier and Castro2010a,Reference Rodríguez-Alvarez, Sharbati, Sharbati, Cox, Einspanier and Castrob, Reference Rodríguez-Alvarez, Manriquez, Velasquez and Castro2013). In this sense, the examination of the gene expression pattern in embryos with different developmental potentials at the preimplantation stage could be a useful parameter to evaluate embryo quality. Nevertheless, the analysis of gene expression in preimplantation embryos is an invasive procedure that most frequently implies the lysis of the embryo or a part of it. For that reason, very little information is known about the correlation of the molecular characteristic of blastocysts with its in vivo developmental capability.
Bovine embryo splitting has been used since the early 1980s to produce identical twins and increase the pregnancy rate per available embryo (Williams et al., Reference Williams, Elsden and Seidel1984; Voelkel et al., Reference Voelkel, Viker, Johnson, Hill, Humes and Godke1985; Williams & Moore, Reference Williams and Moore1988). In principle, blastocyst splitting might allow the production of similar demi-embryos and in this way; one can have a ‘mirror’ image of both in vitro and in vivo development of genetically identical demi-embryos. However, very little information is known about the effect of splitting on embryo development and competence. Indeed splitting could provoke a negative effect on embryo survival and it can be presumed that each demi-embryo might respond differently to the injury and could be reflected in a change in the gene expression profile. In this sense, even when embryos are genetically and morphologically identical at the moment of splitting, their developmental potential and molecular characteristics might change as a consequence of the intense manipulation and/or epigenetic differences due to the interaction with the environment (in vitro or in vivo).
This work was aimed: (1) to evaluate the effect of splitting grade I blastocysts on the morphological and gene expression homogeneity of both halves (demi-embryos) of the same embryo; (2) to assess their development capability in vitro; and (3) to determine the in vivo development up to the filamentous stage of split bovine embryos.
Materials and methods
All reagents and media except otherwise stated were from Sigma Chemical Co. (St. Louis, MO, USA).
Experimental design
Experiment 1. To determine the optimal splitting conditions and to ascertain the homogeneity of derived demi-embryos
In order to determine the experimental conditions yielding the highest embryo surviving rate after splitting, blastocyst were organized into nine different groups depending on their developmental stage and age before splitting: (1) day-7 early blastocyst; (2) day-7 expanded blastocyst; (3) day-7 hatched blastocyst; (4) day-8 early blastocyst; (5) day-8 expanded blastocyst; (6) day-8 hatched blastocyst; (7) day-9 early blastocyst; (8) day-9 expanded blastocyst; and (9) day-9 hatched blastocyst. The survival rate of both demi-embryos was analyzed 12 h after splitting; and it was correlated with the developmental stage of the original embryo before splitting. The group displaying the highest survival rate and better in vitro re-expansion of both demi-embryos was selected for further embryo splitting experiments. The homogeneity of both demi-embryos was assessed both morphologically and by RT-qPCR analysis of expression of a set of gene markers of pluripotency (OCT4, SOX2, NANOG), trophoblastic development (CDX2, TP1) and apoptosis (BAX). Each half of a given demi-embryo was randomly assigned to group 1 (G1) or group 2 (G2) for further analysis.
Experiment 2. To determine the in vitro developmental capability of split embryos
In this experiment, the developmental competence of morphologically similar halves of the same embryo to continue growing in vitro was assessed. For this, after splitting, couples of demi-embryos with similar morphology derived from a blastocyst were kept in culture until day 10 or 13 in a well in a four-well culture dish (Nunc, Roskilde, Denmark) in synthetic oviduct fluid (SOFaci) under the same conditions mentioned above. All dishes were placed on a bench rocker inside an incubator to prevent the attachment of the embryos to the bottom of the culture dish.
The diameter of the demi-embryos and their total cell number were analyzed at day 10 of development. Embryo diameter was measured using 5-Mpx Micrometrics digital camera software (Arquimed, Santiago de Chile, Chile). For cell counting, 20 demi-embryos derived from 10 blastocysts were fixed in 3% glutaraldehyde for 72 h at 4ºC. Fixed embryos were washed in phosphate-buffered saline (PBS) with 1% PVA and stained with propidium iodide (10 μg/ml) for cell counting under ×100 magnification. The remaining demi-embryos were kept in culture until day 13. Their diameter and morphological characteristics were recorded daily at exactly the same time. Pairs of demi-embryos were considered morphologically similar when their diameter differed in less than 20%.
Additionally, the homogeneity of both demi-embryos was assessed by RT-qPCR analysis of expression of the same gene markers as for the first experiment, plus the trophoblastic markers TKDP1 and EOMES. The inclusion of two extra trophoblastic genes is related to the fact that beyond day 7, bovine blastocysts display enhanced trophoblastic growth and development. Each half of a given demi-embryo was randomly assigned to group one (G1) or group two (G2) for further analysis.
Experiment 3. To determine the developmental capability of demi-embryos transferred to temporary recipient females
In this experiment, the effect of splitting on embryo development during the elongation period was evaluated by transferring day-8 split and non-split IVF-derived blastocysts to recipients and collecting them at day 17 of development. The number of collected embryos, embryo size and expression level of six genes (OCT4, SOX2, CDX2, TP1, TKDP1 and EOMES) were compared between both groups.
Embryo production
Bovine embryos were produced by in vitro fertilization (IVF). Cattle oocytes were matured in vitro (IVM) from ovaries collected in a local slaughterhouse following standard procedures described elsewhere (Rodríguez et al., Reference Rodríguez, Navarrete, Tovar, Cox and Castro2008). Briefly, cumulus–oocyte complexes (COCs) were in vitro matured in 500 μl of TCM199 Earle's salts, supplemented with follicle stimulating and luteinizing hormones (0.01 U/ml each), 17β-estradiol (1 μg/ml), epidermal growth factor (EGF; 10 ng/ml), and 10% fetal bovine serum (FBS) at 39°C in a 5% CO2 in an air atmosphere, in four-well dishes. After 21 h of IVM, matured oocytes were in vitro fertilized with thawed semen from a single bull of proven fertility. The motile fraction of the semen was obtained using a Percoll gradient (45% Percoll over 90% Percoll) and centrifugation at 1200 rpm for 25 min. The pellet was washed twice and finally resuspended in 1 ml of Tyrode's albumin lactate pyruvate (TALP-SP) (containing 2 mM sodium pyruvate, 50 μg/ml gentamycin and 3 mg/ml bovine serum albumin (BSA, Fraction V). Approximately, 1 × 10⁶ motile sperms/ml were added to the fertilization drop and incubated with 25 COCs for 24 h at 39°C in 5% CO2 in an air atmosphere. Fertilization was carried out in TALP medium supplemented with 2 mM sodium pyruvate, 50 μg/ml gentamycin, 0.01 mg/ml heparin sodium salt, and 6 mg/ml of BSA fraction V (essentially fatty acid free). After 24 h of IVF, the presumptive zygotes were mechanically denuded by 3 min vortexing in TCM-HEPES + 0.3 mg/ml of hyaluronidase and washed three times before culture. Embryos were cultured in 4-well dishes in sealed aluminium foil bags in 500 μl synthetic oviduct fluid (SOFaci) supplemented with 0.37 mM trisodium citrate, 2.77 mM myo-inositol, essential and non-essential amino acids (final concentration 1×), gentamycin (50 μg/ml), 3 mg/ml essentially fatty acid free BSA, 2% FBS and 10 ng/ml EGF in a balanced gas atmosphere consisting of 5% CO2, 5.5% O2 and 89.5% N2, 100% humidity at 39°C. At day 7 of culture, bags were opened; blastocysts were counted, and classified as grades I, II, or III in agreement with inner cell mass (ICM) and trophoblast quality according to (Gardner et al., Reference Gardner, Lane, Stevens and Schoolcraft2000). Day-0 of embryo development correspond to the day of IVF.
Embryo splitting
Only grade I bovine blastocyst were manually split under stereoscopic observation with a microblade (Ultra Sharp Splitting Blades; AB Technology, Pullman, WA, USA). Grade I blastocyst corresponds to those embryos with a visible blastocyst cavity, many closely aggregated cells forming a well developed ICM and a trophoblast formed by a very well defined layer of lengthened cells.
Embryo transfer and recovery at Day 17
Day-8 demi-embryos and controls (non-split, day-matched IVF derived embryos) were transferred non-surgically to synchronic recipient heifers according to conventional procedures published elsewhere (de Armas et al., Reference de Armas, Solano, Riego, Pupo, Aguilar, Ramos, Aguirre, de la Fuente and Castro1994). Estrus synchronization was performed using a controlled intravaginal drug release (CIDR) device (Eazy Breed, Pfizer Animal Health, New York, NY, USA) for 7 days and by administration of cloprostenol (Estrumate 0.1 mg im, Intervet, Boxmeer, The Netherlands) the day of device withdrawal. After 48 h, cows were treated with Buserelina (Conceptal 0.02 mg im, Intervet, Boxmeer, The Netherlands).
Ten days after embryo transfer, heifers were slaughtered in a local abattoir, their uteri collected, placed into individual zip lock bags with warm PBS and transported to the laboratory. Embryo collection was performed as previously standardized in our laboratory (Rodríguez-Alvarez et al., Reference Rodríguez-Alvarez, Cox, Tovar, Einspanier and Castro2010a). Uteri were flushed with 50 mL ice-cold Dulbecco PBS, supplemented with 6% BSA Fraction V in a caudal to cranial direction. Upon collection, embryos were classified depending on their length, and then individually frozen at –80°C until RNA extraction.
Gene expression analysis
RNA extraction and cDNA synthesis from blastocyst
Demi-embryos at blastocyst stage were treated individually with Cells-to-cDNA TM II kit (Ambion Co., Austin, TX, USA) lysis buffer according to manufacturer's instruction. Briefly, embryos were washed once in cold PBS and then 100 μl of lysis buffer were added and embryos were incubated for 10 min at 75°C. All samples were treated with DNase I (0.04 U/μl) for genomic DNA digestion. For cDNA conversion, 10 μl of total RNA was used in a 20-μl final reaction containing 5 μM random primers, 10 mM each dNTP, 2 μl first strand buffer (10×), 10 U of RNase inhibitor, and 200 U/ml M-MuLV (Ambion Co., Austin, TX, USA). Cycling parameters were: 70°C for 3 min, 42°C for 60 min, and 92°C for 10 min. The produced cDNAs were kept frozen at −20°C until use in polymerase chain reaction (PCR) experiments.
RNA extraction and cDNA synthesis from elongated embryos
Total RNA from day-17 embryos was extracted using the E.Z.N.A.® Total RNA Kit I (Omega Biotek, Santiago, Chile). Total RNA was quantified in 2-μl volumes (Epoch; Biotek, Bad Friedrichshall, Germany) and the quality was assessed using the Agilent 2200 TapeStation system (RNA Nanochip; Agilent, São Paulo, Brazil). One μg of purified RNA was treated with 1 U of RNase-free DNase I (Invitrogen, Carlsbad, CA, USA) in a 10-μl reaction for 30 min at 37°C. The enzyme was heat inactivated (65°C for 10 min) in the presence of 25 mM EDTA (1 μl). The mRNA was converted to cDNA in accordance with the manufacturer's instructions in a commercial cDNA-kit (Bioline, Darmstadt, Germany). In brief, the total volume of the DNase I treatment (11 μl) was used in a 200-μl final reaction containing 30 ng/μl random primers, 10 mM each dNTP, 4 μl first strand buffer (5×), 200 U/ml M-MuLV and DEPC-treated water. Cycling parameters were: 25°C for 10 min, 42°C for 60 min, and 70°C for 10 min. The cDNAs produced were kept frozen at −20°C until use in PCR experiments.
qRT-PCR
Gene expression analysis was performed by real-time qPCR using the standard curve method. Standard curves for each gene were prepared using PCR products excised and eluted from agarose gels using a gel extraction kit (Omega Biotek, Santiago, Chile) and quantified by Epoch. Serial 10-fold dilutions of PCR products were prepared; the first point of the curve corresponded to 1 ng of amplified DNA. Eight points were included in each standard curve, and 2 μl aliquots were used in duplicates for each point of the curve. For qPCR, samples were loaded as duplicates (technical replicates). The primers used and PCR conditions for each gene are listed in Table 1. The Crossing Point (CP) and the amplification efficiency were calculated by the built-in software. In all qPCRs, ACTB was used as an internal control, based on our previous experience using this gene as a housekeeping gene.
Oligonucleotide composition and PCR conditions for gene expression analysis

Statistical analysis
To analyse the effect of embryo age and blastocyst stage on the survival rate of demi-embryos after splitting, the data were organized and grades were assigned according to the number of halves that survived, as follows: zero, none of the demi-embryos survived; one, only one demi-embryo survived; and two, both demi-embryos survived. Data were analyzed using the Kruskal–Wallis method including both criteria of embryo classification (blastocyst stage and age).
Gene expression levels between demi-embryos at the blastocyst stage and at day 13, embryo diameter and total cell number were analyzed using a t-test for dependent samples. Gene expression analysis in elongated day-17 embryos was conducted using a t-test for independent samples.
Results
Experiment 1. To determine the optimal splitting conditions and to ascertain the homogeneity of derived demi-embryos
In this experiment, 247 blastocysts were split and the survival rate of each group scored (Table 2). Independently of the day of development (days 7 and 8) none of the early blastocysts in a given day generated two viable demi-embryos. Early blastocysts at day 9 were considered as non-competent and were not included in this experiment. Expanded blastocysts produced demi-embryos when split albeit at low rates; however, hatched blastocyst yielded the highest survival rate of both demi-embryos. The highest survival rate of both demi-embryos was obtained after the splitting of hatched blastocysts at day 8 or 9 of development. Based on the data gathered, day-8 hatched blastocysts were selected to generate demi-embryos for the next experiments. This decision was based in the fact that the highest survival rate of both demi-embryos is obtained by splitting day-8 and day-9 blastocysts; however, day-8 blastocysts are more suitable for embryo transfer.
Survival rate of demi-embryos after blastocyst splitting
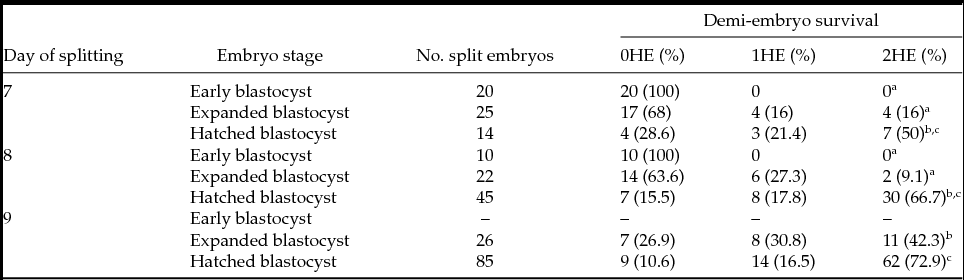
Abbreviations: 0HE: None of the demi-embryos survived after splitting; 1HE: Only one of the demi-embryos survived after splitting; 2HE: Both demi-embryos survived after splitting.
Different superscripts within a column indicate a significant difference with P < 0.05.
Out of all demi-embryos generated from hatched blastocysts at days 8 and 9 (groups 6 and 9 in Materials and methods), more than 90% retained a well defined ICM and almost 70% of the pairs of demi-embryos (from 92 pairs of demi-embryos mentioned in Table 2) had a similar size with a diameter difference of less than 20% (Fig. 1). In addition to morphology, the homogeneity of gene expression between both demi-embryos was assessed. For that process, 12 h after splitting demi-embryos derived from individual blastocysts were assigned randomly to G1 or G2. Thirteen demi-embryos were analyzed in each group. All samples for all genes yielded a specific amplicon within the quantification range of the standard curve. The efficiency of the qPCR (including standard curves and samples) was in the range of 90–110% with a correlation coefficient of 0.9. No significant differences of the expression level were obtained for any of the analyzed genes (Fig. 2). As partial conclusion of this experiment, the best developmental point for embryo splitting and the actual homogeneity at the gene expression level of both demi-embryos, at least for the genes analyzed, were determined.
Examples of demi-embryo morphology 12 h after splitting. (A–C) Represent demi-embryo survival after splitting. (D) Both demi-embryos are morphologically similar with a difference in embryo diameter less than 20%. (E) Demi-embryos are morphologically different with a difference in embryo diameter exceeding 20%. (A) None of the embryos survived; (B) one demi-embryo survived; and (C) both demi-embryos survived.

Analysis of the homogeneity of gene expression among demi-embryos. Twelve hours after splitting demi-embryos derived from a blastocyst were assigned randomly to groups 1 or 2 (G1 and G2). The expression level of each gene was normalized to the expression of ACTB measured in the same RNA extraction and cDNA preparation.

Experiment 2. To determine the in vitro developmental capability of split embryos
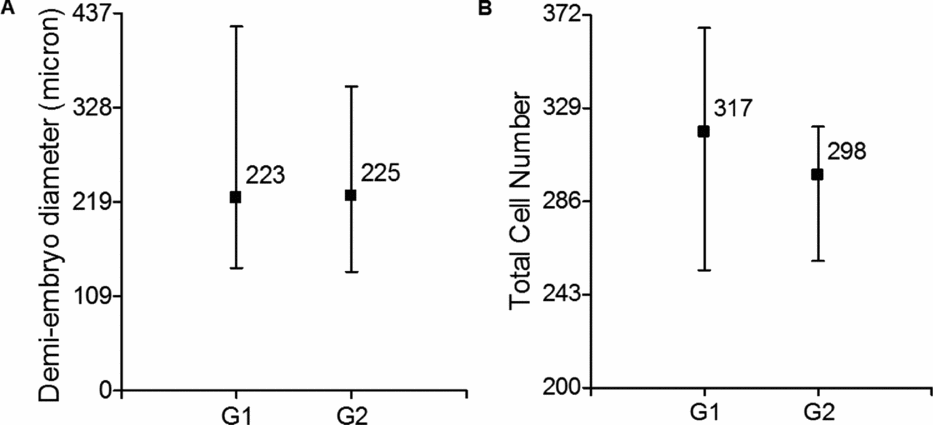
Demi-embryos with similar morphology and derived from day-8 hatched blastocysts were kept in culture until day 10 of development. All embryos survived the extended culture period as measured by the lack of obvious cell degeneration. Both demi-embryos retained a normal and similar morphology. No significant differences in the diameter or total cell number were observed between demi-embryos at day 10 of in vitro development (Fig. 3).
(A) Demi-embryo size at day 10. (B) Total cell number of day 10 demi-embryos. Y-axis indicates the minimum and maximum value of each variable (parameter). Values within the graph indicate means per group. Demi-embryos derived from a blastocyst were assigned randomly to groups 1 or 2 (G1 and G2). Twenty-six couples of demi-embryos were measured and 10 couples were used for cell counting.
Sixty demi-embryos (30 couples) were kept in culture until day 13 of embryo development. Of these, eight couples were excluded from the homogeneity analysis because at least one of the corresponding demi-embryo attached to the culture dish or died (collapsed) (Table 3). In the remaining 22 couples of demi-embryos studied, significant differences on the mean of demi-embryo diameter were not found (Fig. 4 D). Fourteen (63.6%) had a similar size with a difference in embryo diameter of less than 20% (Fig. 4 A, B) while the rest had a difference in embryo diameter that exceeded 20% (Fig. 4 C).
In vitro development of bovine demi-embryos from day 10 to day 13

Abbreviations: HE: Demi-embryos.
Assessment of the homogeneity of demi-embryos at day 13 of development. (A, B) Representative image of demi-embryos with similar size (diameter difference of 4% (A) and 13% (B)). (C) Representative image of demi-embryos with different size (39%). (D) Mean of the diameter of demi-embryos; Y-axis indicates the minimum and maximum value of each variable (parameter). Values within the graph indicate means per group. Demi-embryos derived from a blastocyst were assigned randomly to groups 1 or 2 (G1 and G2).

At day 13, 24 demi-embryos were collected individually for gene expression analysis. Demi-embryos derived from the same blastocyst were assigned randomly to groups G1 or G2. In this experiment, seven genes were randomly selected for gene expression analysis (OCT4, SOX2, BAX, CDX2, TP1, TKDP1 and EOMES). Two demi-embryos derived from different blastocyst did not yield an amplicon within the quantification range of the standard curve when normalised to the housekeeping gene; these demi-embryos and their counterparts were excluded from the analysis. EOMES was not detected in any of the demi-embryos and Sox2 was expressed in two pairs of demi-embryos only; the other genes were expressed across all samples with statistically significant differences between G1 and G2 (Fig. 5) except for the gene BAX.
Analysis of the homogeneity of gene expression among demi-embryos at day 13 of development. Demi-embryos derived from the same blastocyst were assigned randomly to groups 1 or 2 (G1 and G2). The expression level of each gene was normalized to the expression of ACTB measured in the same RNA extraction and cDNA preparation. A,BDifferent letters within a graph indicate a significant difference at P < 0.05.

Experiment 3. To determine the developmental capability of demi-embryos transferred to temporary recipient females
In this last experiment, the effect of splitting at the blastocyst stage on in vivo development until day 17 was analyzed. For this experiment, collected elongated embryos derived from split blastocysts were compared with time-matched collected control embryos (derived from non-split IVF-derived blastocysts). The efficiency of embryo recovery and the mean embryo size are summarized in Table 4. Six and nine elongated embryos were recovered from split and control groups respectively. Neither the recovery rate, nor the mean length of the elongated embryos was significantly different between the two treatments. However, when embryos were classified depending on their size, more than 50% of embryos from the control group had a length that surpassed 100 mm, while only 33% of the split embryos reached that size (Table 4). Selection of a cutoff of 100 mm is based on our previous experience in evaluating gene expression and survival of elongated bovine embryos (Rodríguez-Alvarez et al., Reference Rodríguez-Alvarez, Cox, Tovar, Einspanier and Castro2010a; and unpublished observations).
In vivo embryo development until day 17

SD, standard deviation.
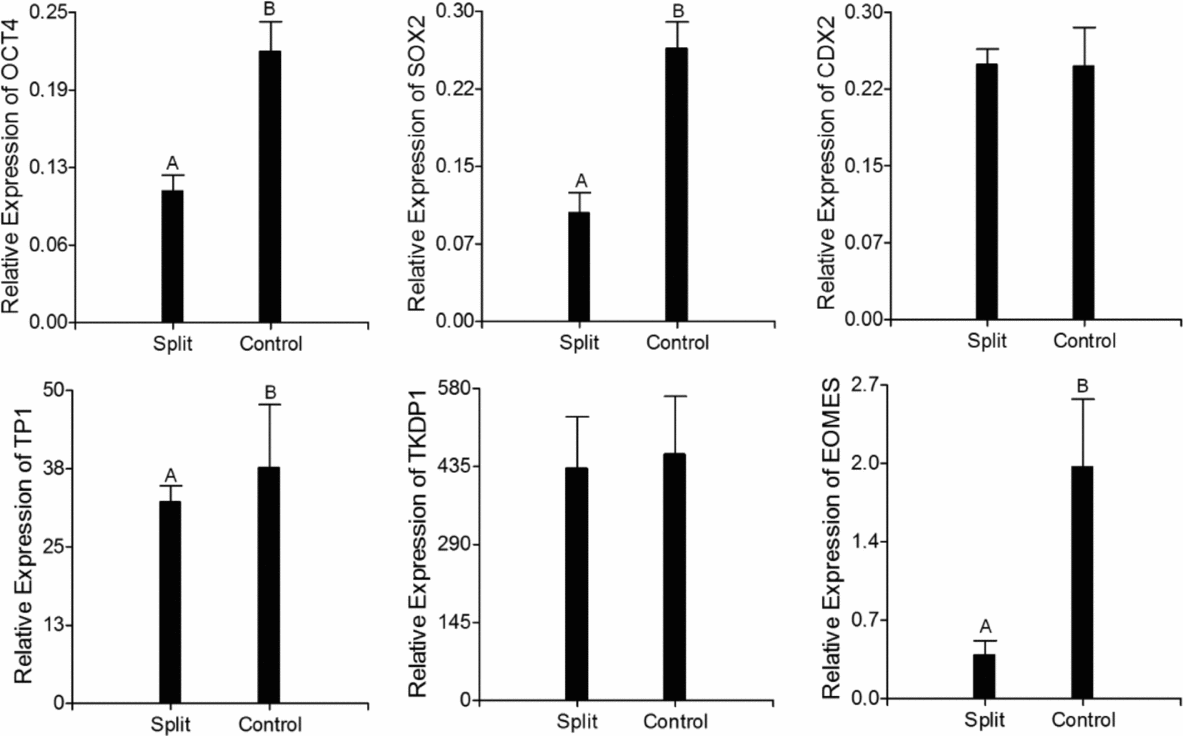
In this experiment, we compared the expression level of six genes, two pluripotency markers (OCT4 and SOX2) and four trophoblastic markers (CDX2, EOMES, TP1 and TKDP1), between both groups (split and control elongated embryos). For this analysis, only embryos with length greater than 10 mm were used. All genes were expressed across the samples and filled within the quantification range of the standard curve with and efficiency between 90–110% and a correlation coefficient of 0.9. Pluripotency markers as well as TP1 and EOMES were down-regulated in the split embryos (P < 0.05; Fig. 6), while no statistical differences were observed in the expression levels of CDX2 and TKDP1.
Gene expression analysis in elongated day-17 bovine embryos recovered after the transfer of split and non-split blastocysts to temporary recipients. The expression level of each gene was normalized to the expression of ACTB measured in the same RNA preparation. A,BDifferent letters within a graph indicate a significant difference at P < 0.05.
Discussion
Embryo splitting has been used to increase the number of available embryos and thus to improve the numbers of viable offspring in different species (Picard et al., Reference Picard, King and Betteridge1985; Heyman et al., Reference Heyman, Vignon, Chesné, Le Bourhis, Marchal and Renard1998; Schramm & Paprocki, Reference Schramm and Paprocki2004; Illmensee et al., Reference Illmensee, Levanduski, Vidali, Husami and Goudas2010; Tang et al., Reference Tang, Tsai and Kuo2012). However, not all splitting-derived embryos will produce a successful pregnancy (Williams et al., Reference Williams, Elsden and Seidel1984; Seike et al., Reference Seike, Teranishi, Yamada, Takakura, Nagao and Kanagawa1989; Schramm & Paprocki, Reference Schramm and Paprocki2004; Tang et al., Reference Tang, Tsai and Kuo2012). Embryo splitting at different stages might impinge upon the developmental potential of each derived embryo due to the manipulation itself.
In this study, we first analyzed the survival rate of both demi-embryos after splitting blastocysts of different ages (days 7, 8 or 9) and different stages (early, expanded or hatched). From this experiment, we determined that hatched blastocysts, independently of the day of development, are less susceptible to splitting and generating the highest rate of survival for both demi-embryos. The hatched blastocyst is a more robust embryo that has been naturally selected as not all early or expanded blastocysts will have the competence to hatch and develop further. This result is in agreement with previous reports suggesting that embryos with a high cell number and in advanced stages will better withstand a blastomeric biopsy or splitting (Vajta et al., Reference Vajta, Holm, Greve and Callesen1997; Abolfazl et al., Reference Abolfazl, Sara, Hassan, Ebrahim, Banafsheh and Amin2010). In our experience, the absence of the zona pellucida simplifies manual splitting; the hatched embryo is less ‘slippery’ and attaches only slightly to the bottom of the dish, facilitating the positioning and splitting of the ICM. A previous report by Skrzyszowska et al. (Reference Skrzyszowska, Smorag and Katska1997) showed that splitting of hatched blastocysts reduced cell death and increased demi-embryo survival.
In a recent study in mice, it was demonstrated that embryo splitting at an early stage (4-cell stage) increased the number of blastocysts but not the percentage of good quality (grade I) blastocysts (Tang et al., Reference Tang, Tsai and Kuo2012). In this report, the authors confirmed a previous hypothesis suggesting that the blastomeres from an embryo have different developmental potentials.
In bovine, blastomeric biopsy has been used for embryo sexing and genetic diagnosis (El-Sayed et al., Reference El-Sayed, Hoelker, Rings, Salilew, Jennen, Tholen, Sirard, Schellander and Tesfaye2006; Zoheir & Allam, Reference Zoheir and Allam2010). As in humans, the embryo stage at the time of biopsy affects the potentially negative consequences of this manipulation on embryonic development (Vajta et al., Reference Vajta, Holm, Greve and Callesen1997; Abolfazl et al., Reference Abolfazl, Sara, Hassan, Ebrahim, Banafsheh and Amin2010). It has been reported that in bovine, the best stage for blastomeric removal is at day 4 of development, allowing a high development rate to the blastocyst stage and to survival after vitrification (Vajta et al., Reference Vajta, Holm, Greve and Callesen1997; Abolfazl et al., Reference Abolfazl, Sara, Hassan, Ebrahim, Banafsheh and Amin2010). However, these authors suggested that embryos with more cells at advanced stages have a better chance to develop after splitting and the sizes of the samples may be larger and facilitate sample processing.
On the other hand, in bovine, the blastocyst is the most suitable stage for morphological assessment and prediction of embryo quality and competence. Moreover, the first cell differentiation occurs at the blastocyst stage, generating the ICM and the trophoblast (TB), and that leads to the secretion of the first signals for pregnancy recognition such as interferon-tau (IFN-τ) (Viebahn, Reference Viebahn1999; Degrelle et al., Reference Degrelle, Campion, Cabau, Piumi, Reinaud, Richard, Renard and Hue2005; Roberts et al., Reference Roberts, Chen, Ezashi and Walker2008). Thus, biopsy of blastocysts appears as a tempting possibility to study gene expression profiles and predict their further development (Hoelker et al., Reference Hoelker, Schmoll, Schneider, Rings, Gilles, Tesfaye, Jennen, Tholen, Griese and Schellander2006). Nevertheless in the process of making a blastomeric biopsy, only partial information can be recruited in terms of gene expression, as the operator should focus on cell aspiration in either ICM or TB, but not in both. Conversely this can be easily achieved if halves instead of biopsies are obtained from single blastocysts, via embryo splitting.
In our work, most pairs of demi-embryos re-expand normally after splitting, retained a similar morphology (presence of ICM and adequate diameter) and displayed similar gene expression patterns. This result proves that during the first 12 h after splitting there are not significant changes in the demi-embryos derived from a single blastocyst and, at this point, they can be considered as homogenous or genetically and morphologically similar embryos with the same developmental competence. This finding is in agreement with the finding of Albihn et al. (Reference Albihn, Rodriguez-Martinez and Gustafsson1990). However, 12 h after splitting, most demi-embryos are smaller in diameter than the original embryos (data not shown). Nevertheless, embryo diameter at the blastocyst stage does not correlate with the number of TE cells, ICM cells or total cells neither with developmental characteristics after embryo transfer to recipients (Hoelker et al., Reference Hoelker, Schmoll, Schneider, Rings, Gilles, Tesfaye, Jennen, Tholen, Griese and Schellander2006).
In a second experiment, we evaluated the developmental potential and homogeneity up to day 13 of both demi-embryos derived from a hatched blastocyst. For this, pairs of morphologically similar demi-embryos were kept in culture and evaluated at days 10 and 13 of development. The advantage of the long-term culture of pairs of demi-embryos lies in the possibility of extended and repeated observation during the entire experiment. Other earlier groups (Voelkel et al., Reference Voelkel, Viker, Johnson, Hill, Humes and Godke1985; Machado et al., Reference Machado, Ferreira, Pivato, Fidelis, Spricigo, Paulini, Lucci, Franco and Dode2013) reported the extended in vitro culture as a tool to evaluate the developmental potential of bovine embryos.
Immediately after splitting, the majority of demi-embryos had visible degenerated trophoblastic cells; no statistical differences were observed in embryo diameter or total cell number at day 10. At day 11, demi-embryos from the same pair started to show independent growth and morphology; in several cases, one of them collapsed or reduced growth speed and ended up as a smaller embryo compared with its counterpart. This fact was confirmed at day 13 when less than 65% of the pairs of demi-embryos retained a similar size with a difference in diameter of less than 20%. At the end of the evaluated culture period, however, there was a general improvement in embryo quality, manifested at day 13, when most of the embryos displayed a very compact trophoblast with a more defined and smooth surface. In humans, removal of one blastomere at the 6- to 8-cell stage revealed that although embryo biopsy did not affect the cleavage rate, it did retarded the development of the embryo temporarily; however, these embryos recovered and hatched from the zona pellucida at the same time as non-biopsied controls, albeit with a significant smaller size (Kirkegaard et al., Reference Kirkegaard, Hindkjaer and Ingerslev2012).
Additionally, from the five genes that were detected and quantified, four of them were differentially expressed in groups 1 and 2; this suggests that at day 13, demi-embryos derived from the same blastocyst do not conserve the homogeneity in gene expression profile.
We found EOMES not expressed in our experiments, although it is expected to be present at this embryonic stage (Degrelle et al., Reference Degrelle, Campion, Cabau, Piumi, Reinaud, Richard, Renard and Hue2005). This gene is a transcription factor that participates in the differentiation of the trophoblast (Russ et al., Reference Russ, Wattler, Colledge, Aparicio, Carlton, Pearce, Barton, Surani, Ryan, Nehls, Wilson and Evans2000; Degrelle et al., Reference Degrelle, Campion, Cabau, Piumi, Reinaud, Richard, Renard and Hue2005). Absence of EOMES expression is most likely a consequence of the in vitro culture rather than of the splitting procedure. In a recent report the expression of a set of genes in day-14 bovine embryos produced in vivo, in vitro and transferred at day 7 to cattle recipient or cultured in a post-hatching development (PHD) system was compared. These authors found that embryos from the PHD system, showed a higher expression of PLAC8, SOD2, and SLC2A3 genes compared with embryos that developed in vivo for at least a few days (Machado et al., Reference Machado, Ferreira, Pivato, Fidelis, Spricigo, Paulini, Lucci, Franco and Dode2013). In our study, split embryos transferred to cattle recipients expressed EOMES at day 17 of development. Similarly to EOMES, SOX2 was not expressed in almost all the studied samples, but it was expressed and quantified in all embryos elongated in vivo. These results demonstrate than in fact the stress of the in vitro conditions will impinge on the developmental competence of the embryos. It is reasonable to expect an effect of prolonged embryo culture in vitro on the developmental capability and gene expression profiles of the embryos, nevertheless the absence of adequate models for in vitro elongation in ruminant species prompted us to test an intermediate system in which embryos can be kept for extended periods of culture while keeping them alive. It was out of the scope of this part of our investigation to compare gene expression and developmental potential of split versus intact embryos, instead we focused on the comparison between each half of the same embryo.
In the third experiment, we evaluated the effect of blastocyst splitting on the embryo competence by comparing embryo length and gene expression on day-17 embryos produced by transferring split and non-split blastocysts to a bovine recipient. The per cent recovery was less for split embryos than in the control group, but other results in the literature using this procedure are very inconsistent and embryo recovery rate should not be considered as a parameter to assess embryo quality (Bertolini et al., Reference Bertolini, Beam, Shim, Bertolini, Moyer, Famula and Anderson2002; Alexopoulos & French, Reference Alexopoulos and French2009; Rodríguez-Alvarez et al., Reference Rodríguez-Alvarez, Cox, Tovar, Einspanier and Castro2010a; Machado et al., Reference Machado, Ferreira, Pivato, Fidelis, Spricigo, Paulini, Lucci, Franco and Dode2013). Both groups (split and controls) had a similar mean size at day 17 and, in both groups, embryos with different sizes were recovered. This result is in agreement with previous studies describing high variability in the developmental stage and size between embryos collected on the same day (Bertolini et al., Reference Bertolini, Beam, Shim, Bertolini, Moyer, Famula and Anderson2002; Maddox-Hyttel et al., Reference Maddox-Hyttel, Alexopoulos, Vajta, Lewis, Rogers, Cann, Callesen, Tveden-Nyborg and Trounson2003; Clemente et al., Reference Clemente, de la Fuente, Fair, Al Naib, Gutierrez-Adan, Roche, Rizos and Lonergan2009; Rodríguez-Alvarez et al., Reference Rodríguez-Alvarez, Cox, Tovar, Einspanier and Castro2010a; Machado et al., Reference Machado, Ferreira, Pivato, Fidelis, Spricigo, Paulini, Lucci, Franco and Dode2013). However, in the present study, most elongate embryos derived from a split blastocyst had length less than 100 mm; whether this would affect future implantation is not clear at this stage, but potentially it might reflect a negative effect of the splitting on proper embryo development. In addition, both pluripotency markers (OCT4 and SOX2) and two trophoblastic markers (EOMES and TP1) were down-regulated in the split embryos. It seems that OCT4 is not only responsible for maintaining the pluripotency of the embryonic cells. This gene is also expressed in the TB of bovine embryos at the filamentous stage, suggesting a contribution to the maintenance of an undifferentiated trophoblast compatible with the active cell proliferation during elongation (Degrelle et al., Reference Degrelle, Campion, Cabau, Piumi, Reinaud, Richard, Renard and Hue2005). The down-regulation of OCT4 in the split embryos might point to an early differentiation of the trophoblast contributing to a reduction in cell proliferation and, consequently, to a shorter length of these embryos. The down-regulation of EOMES might contribute as well to the low proliferation of the trophoblastic cells in the split embryos.
TP1 (IFN-τ) is the major protein produced by the trophectoderm of bovine embryos and its role is the establishment of pregnancy by inhibiting luteolysis (Roberts et al., Reference Roberts, Leaman and Cross1992; Bazer et al., Reference Bazer, Spencer and Ott1997). The reduction in the secretion of IFN-τ has been associated with a lower pregnancy rate after transfer of low competent embryos, such as those derived by SCNT and embryo splitting (ES) (Stojkovic et al., Reference Stojkovic, Büttner, Zakhartchenko, Riedl, Reichenbach, Wenigerkind, Brem and Wolf1999). Stojkovic et al. (Reference Stojkovic, Büttner, Zakhartchenko, Riedl, Reichenbach, Wenigerkind, Brem and Wolf1999) found a positive correlation between trophoblastic area and the secretion of IFN-τ in embryos derived by IVF and in vivo (r = 0.60 and r = 0.68 respectively) but not in SCNT and ES-derived embryos. Similar to this, we found a positive correlation between the expression level at the mRNA level of IFN-τ and embryo length in non-split day-17 embryos (r = 0.88; p = 0.02) but not in split embryos (r = 0.2; p = 0.7). This phenomenon indicates an obvious deregulation of gene expression in split embryos that causes a reduced viability and competence of these embryos.
In conclusion, we showed that splitting of blastocysts at day 8 yields reasonably homogenous demi-embryos in terms of developmental capability and gene expression, but the initiation of filamentous stage seems to be affected by the splitting procedure as judged by the morphometric and gene expression data gathered. It would be of great interest to perform large-scale gene expression assays, using microarrays to characterize aberrant expression of key developmental genes as a consequence of splitting in depth, as well as allowing pregnancies to proceed further to evaluate the actual effect of ES on pregnancy rate and ultimately on calving. Nevertheless, the model that we set up here should provide valuable information aimed to develop more accurate procedures of splitting, or corrective measures in order to make it a commercially interesting technology.
Acknowledgements
This work was supported by grant: FONDECYT No. 11100082 from CONICYT (Ministry of Education) Chile.
Conflict of interest statement
Authors declare that there is no conflict of interest of any kind.



