1. Introduction
Traditional statistical analysis remains the dominant methodology for analysing financial systems, and by way of illustration, in the 2017 editions of a top-rated financial journal, of the 62 papers published, 55 included traditional statistical methods. But the financial system can be shown to be a complex adaptive system (CAS) which means the system is continually changing and the outcome of the system’s reactions to internal or external disruptions cannot be predicted from a reductionist analysis. This emergence phenomenon of the financial system has been recognised for some time with consequent questioning of the appropriate tools for analysis. We would argue that traditional statistical approaches have limited application for modelling the ambiguity risks in the financial systems as defined by Ganegoda & Evans (Reference Ganegoda and Evans2014). Danielsson (2008) and Danielsson et al. (Reference Danielsson, James, Valenzuela and Zer2016) both observed that traditional statistical models were fragile as to their assumptions and mechanisms for understanding financial systems, as well as inconsistent due to the endogenous uncertainty inherent in the financial systems. It seems that understanding financial systems under such complexity requires a solution that can provide a holistic picture of the system. We are of the view that cladistics analysis is capable of providing such a holistic view of the relationships occurring in the financial systems. Cladistics analysis is a method to classify events in a CAS into related sets. This method has been applied to different areas, and whilst initially developed for biological applications, it has now been extended to the social sciences. In the social sciences, the methodology has been used to analyse management systems (Mitleton-Kelly, Reference Mitleton-Kelly2003), product development (McCarthy et al., Reference McCarthy, Tsinopoulos, Allen and Rose-Anderssen2006), cultural inheritance in social systems (Matthews et al., Reference Matthews, Edmonds, Wildman and Nunn2013), operational risk in banks (Li et al., Reference Li, Allan and Evans2017a ), world economic risks (Evans et al., Reference Evans, Allan and Cantle2017) and credit risks (Shi et al., Reference Shi, Allan, Evans and Yun2018a ). In these applications outside of biology, there has been an assumption that cladistics analysis was appropriate as the systems being analysed were CAS. Whilst a system being a CAS is essential to justify the adoption of cladistics analysis, other criteria apply and also the exact methodology to be applied will vary depending on the particular characteristics of the CAS. In this paper we will discuss the justification for adopting cladistics analysis for financial events, the different algorithms that are applicable to particular sets of financial events, and provide some insights into the value of cladistics analysis of financial events.
2. Similarities of Biological and Financial Systems
The most important similarity between biological and financial systems is that they are both CAS. CAS and their attributes have been widely discussed by John Henry Holland (Reference Holland1995), Arthur, Durlauf & Lane (Reference Arthur, Durlauf and Lane1997), Cilliers (Reference Cilliers1998), Mitleton-Kelly (Reference Mitleton-Kelly2003), Mitchell (Reference Mitchell2009) and Holland (Reference Holland2014). Whilst there is not a commonly accepted definition of a CAS, it is generally accepted there are four basic attributes to identify a CAS, namely, there are numerous components, there is no central control, there are interactions amongst the components, and there is emergence of the system as a result of interactions. The major financial institutions were shown by Schweitzer et al. (Reference Schweitzer, Fagiolo, Sornette, Vega-Redondo, Vespignani and White2009) to be highly connected with loops existing between the financial institutions, indicating that financial institutions are strongly inter-connected. Schweitzer et al. (Reference Schweitzer, Fagiolo, Sornette, Vega-Redondo, Vespignani and White2009) argued that such interdependence may result in instability of the network which is a signal of emergence of a system. The financial industry also has no central control as was recognised as early as Adam Smith (Reference Smith1776) when he talked about “an invisible hand” operating in the markets. Similarly, in the financial industry, there is no global control for the trading activities of participants, and regulators are concerned only with specific geographic areas as shown by Evans & Li (Reference Evans and Li2018a ) who demonstrated that the global banking system was a federation of systems (FOS)Footnote 1 . It is relatively easy to observe the emergent property of a CAS in the financial industry as it is impossible to predict the market change by observing one or two financial institutions. The interactions of all the financial institutions create the emergent property with the activities of agents in the financial industry being influenced by other agents, resulting in coevolution (ul-Haq, Reference ul-Haq2005; Song & Thakor, Reference Song and Thakor2010). Song & Thakor (Reference Song and Thakor2010) found that co-evolution in banks was generated by the effect of including securitisation of other banks’ assets in bank equity capital. Evans & Li (Reference Evans and Li2018a ) argued that the extent of the interdependence of the global banking system was so high as to require a change in the regulation of banks from an FOS to an SOS basis. The above discussion leads to the conclusion that the global financial system presents the essential characteristics of a CAS, that is, numerous agents, interactions among agents, no central control and emergence. Allan et al. (Reference Allan, Yin and Cantle2010) demonstrated the parallels of evolution in financial risks and biology in that financial risks have unique characteristics similar to DNA in biology. Allan et al. (Reference Allan, Cantle, Godfrey and Yin2012) investigated financial risk evolution using Darwinian criteria and found financial risk evolution satisfied all the criteria, namely variation, competition, inheritance, accumulation of modifications and adaptation. The conceptual parallels between biological evolution and financial events can be summarised as:
1. Characteristics: in biological evolution, the characteristics are phenotype, that is, there are observable characteristics and molecular sequence changes can affect the phenotype (Griffiths et al., Reference Griffiths, Wessler, Lewontin, Gelbart, Suzuki and Miller2005). For financial events, the characteristics are determined from the descriptions and records of the events and the characteristics are an abstraction and summarisation of these descriptions rather than the records themselves.
2. Evidence: the evidence of biological evolution includes observation of fossils and current species. The evidence of evolution of financial events is similarly based on historical records and descriptions of the characteristics of events and descriptions of the characteristics of current events.
3. Random variation and selection: in biological evolution, the variation is caused by some environmental determinants or happenstance, hence selection occurs from natural selection or genetic drift (Lande, Reference Lande1976). For financial events the environment (e.g. innovation, regulation and transactions) is the main source of variation with risk management or controls (or the lack of controls) being the mechanism that determines what new combinations of characteristics will emerge.
4. Inheritance: Inheritance exists for financial events through the occurrence of events with the same combinations of characteristics as historical events.
Given the justification of financial systems as a CAS and these conceptual parallels of biological evolution and emergence of financial events, we can draw the conclusion that it is feasible to apply cladistics analysis in studies related to financial events.
3. Cladistics Analysis
In applying cladistics analysis, it is important to consider the format of the data, as this will affect the algorithm selection, the encoding methods that transform the data to meet the needs of the particular analysis, and the interpretation of the resultant phylogenetic tree. The investigation of evolution in biology has used two different data types, namely, molecular data and morphological data. Morphological data records the form, structure and structural features of species, including appearance (e.g. colour) and internal structure (e.g. bones). Molecular data analyses DNA and proteins to gain information on evolutionary relationships. There is debate as to whether to adopt molecular-based analysis or morphological-based analysis, but Wiens (Reference Wiens2000) pointed out the most common cause of incongruence was due to under sampling of characters and taxa. Hillis (Reference Hillis1995) argued that a combination of molecular and morphological data would yield a better estimation of the true evolution. Wiens (Reference Wiens2000) argued that the data used could be molecular or morphological, or a combination of these two, so as long as the selection can be justified and the results are properly interpreted. Encoding in cladistics analysis refers to the transformation of the characteristics into a format that can be used by the various algorithms available. Pleijel (Reference Pleijel1995) delineated four different encoding methods for cladistics analysis which essentially relate to whether or not the presence of a characteristic needs to be encoded as well as the absence of the characteristic. The different encoding methods are:
1. Linked multi-states which requires the absence and the presence for each characteristic to be encoded but there are fixed characteristic combinations permissible;
2. Independent multi-states which requires the absence or presence of each characteristic to be encoded, but there are no fixed combinations of characteristics;
3. Independent binary states which only requires either the absence or the presence of the characteristic to be encoded but where all characteristics need to be encoded;
4. Binary states for all characteristics where only the presence or absence of characteristic is encoded and not all characteristics are required to exist.
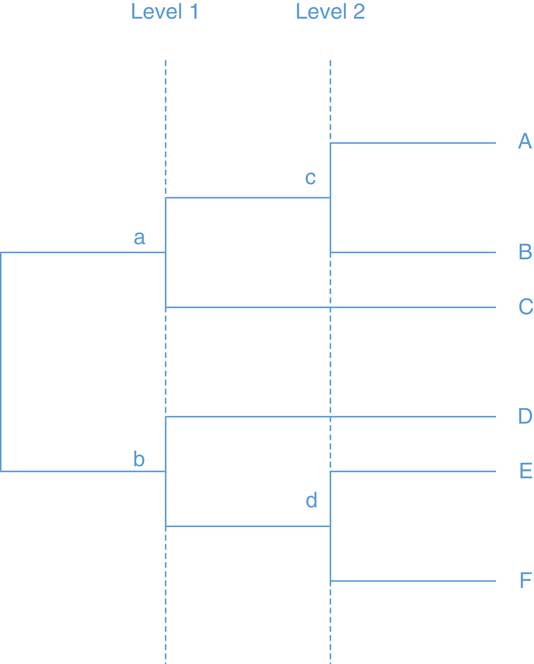
A classic way to illustrate the outcome of a cladistics analysis is by estimating phylogenetic trees. In biology, a phylogenetic tree (or cladogram) is a graph that presents the inferred evolutionary relationships among different species. A phylogenetic tree can be transformed into various shapes (e.g. diagonal-up, rectangular-right, rectangular-up, diagonal-down and circle, as discussed by Baum & Smith (Reference Baum and Smith2013)), but these shapes are just different ways of showing the same inferred evolution. The rectangular-right tree is visually easy to understand and an example is illustrated in Figure 1. A phylogenetic tree diagram consists of leaves, branches and nodes. The leaves, for example, A, B, C and D in Figure 1, represent different species (organisms, genes) in an evolutionary context. A rotation of branches under a node will not change the relationships. For instance, denoting the leaves under node a in Figure 1 as ((A, B), C) if it is rotated as ((B, A), C) or (C, (A, B)), it is still the same tree.
An example of a tree.

There are two different approaches for inferring phylogenetic trees, namely, distance-based methods and character-state based. Distance-based methods usually construct a phylogenetic tree based on a distance matrix of pairwise genetic distances (Felsenstein, Reference Felsenstein1988). The main distance-based methods include cluster analysis such as UPGMA (unweighted pair group method using arithmetic averages, Sokal & Michener (Reference Sokal and Michener1958)) and WPGMA (weighted-pair group method with arithmetic means, Sokal & Michener (Reference Sokal and Michener1958)) which assume a consistent evolutionary rate, minimum evolution (Kidd & Sgaramella-Zonta, Reference Kidd and Sgaramella-Zonta1971; Rzhetsky & Nei, Reference Rzhetsky and Nei1993) and minimises the total distance and neighbour-joining (Saitou & Nei, Reference Saitou and Nei1987; Studier & Keppler, Reference Studier and Keppler1988). Character-state-based approaches, or sequence-based methods rely on the state of the character, and all possible trees are evaluated to generate the one that optimises the evolution. The main character-state-based methods include maximum likelihood methods (Felsenstein, Reference Felsenstein1981), which includes Bayesian methods, and parsimony methods (Camin & Sokal, Reference Camin and Sokal1965; Kluge & Farris, Reference Kluge and Farris1969; Fitch, Reference Fitch1971). Bayesian methods and maximum likelihood methods are both statistical inference methods. The parameters of Bayesian methods are variables with distributions whilst the parameters of maximum likelihood methods are unknown constants. Bayesian inference relies on prior probabilities (Rannala & Yang, Reference Rannala and Yang1996; Yang & Rannala, Reference Yang and Rannala1997). Both maximum parsimony and maximum likelihood methods are character-based methods, and they rely on different phylogenetic characteristics, for example, genetic, morphological and molecular attributes to construct the trees. Character-state-based methods are often considered more powerful than distance-based methods (Rastogi, Mendiratta, & Rastogi, Reference Rastogi, Mendiratta and Rastogi2008), as they use raw data while distance-based methods transform raw data into a distance matrix which introduces information loss. These two methods of constructing the trees are based on different philosophies. The main assumption of parsimony is simplicity (Farris, Reference Farris1983), which results in the minimum number of homoplasies (i.e. a character that different species share is not inherited from a common ancestor). Farris (Reference Farris1983) first made the justification that the minimisation of ad hoc hypothesis of homoplasy maximises the explanatory power. Sober (Reference Sober1975) considered simplicity as a matter of how much extra information has to be obtained to enable the theory to answer the research question, while the less information is needed, the more informative is the theory. Some others (Queiroz & Poe, Reference Queiroz and Poe2001; Kluge, Reference Kluge2006; Wiley & Lieberman, Reference Wiley and Lieberman2011) attribute parsimony to “Ockham’s razor,” which states that simpler hypotheses are preferred over complex ones. The alternative methodology, maximum likelihood, is a statistical concept based on the probability of given data. There is debate around the philosophy of phylogenetic inference (Popper, Reference Popper1959; Popper, Reference Popper1983; Popper, Reference Popper2002; Helfenbein & DeSalle, Reference Helfenbein and DeSalle2005). Popper changed the term “degree of conformation” to “degree of corroboration” (Popper, Reference Popper2002) and argued that hypotheses should survive from the most severe tests. Popper (Reference Popper2002) saw truth as eternal while corroboration as temporal and further gave a formula for the degree of corroboration:
 ${\rm{C}}\left( {h,e,b} \right) = {{p\left( {e,hb} \right) - p\left( {e,b} \right)} \over {p\left( {e,hb} \right) - p\left( {eh,b} \right) + p(e,b)}}$
There are four terms to be examined: probability (p), background knowledge (b), empirical evidence (e) and hypothesis (h). The logical probability “of a statement is complementary to its degree of falsifiability” (Popper, Reference Popper2002), and “the support given by e to h becomes significant only when
 $p\left( {e,hb} \right) - p\left( {e,b} \right){\mkern 1mu} \gg {\mkern 1mu} 1{\mkern 1mu} /{\mkern 1mu} 2$
” (Popper, Reference Popper1983). For hypothesis with high content, p(eh, b) is close to 0 (K. Popper, Reference Popper2002). For a given (e) and (b), p(e, b) is constant and therefore the trees with highest p(e, hb) will be the tree with the strongest corroboration. In the context of cladistics analysis, background knowledge (b) is the assumptions inherent in the method, empirical evidence (e) is the data, and hypothesis (h) is the hypothesis of relationships (Queiroz, Reference Queiroz2004). Carpenter (Reference Carpenter1992), Siddall & Kluge (Reference Siddall and Kluge1997), Carpenter, Goloboff, & Farris (Reference Carpenter, Goloboff and Farris1998) and Farris, Kluge, & Carpenter (Reference Farris, Kluge and Carpenter2001) argued that the parsimony methodology corresponds to the philosophy of Karl Popper, and it is a better method compared to the principle of likelihood, whilst Queiroz (Reference Queiroz1988), Faith & Cranston (Reference Faith and Cranston1991), Queiroz & Poe (Reference Queiroz and Poe2001), Queiroz (Reference Queiroz2004) and Queiroz (Reference Queiroz2014) doubted the argument and argued the equally compatible, or even superiority of likelihood with Popperian corroboration. Farris (Reference Farris1973), Felsenstein (Reference Felsenstein1973) and Goldman (Reference Goldman1990) argued that parsimony can be expressed under a likelihood framework because C(h, e, b) is straightforward in a likelihood framework. As well as the philosophical debate, there has also been debate at the practical level of the alternative methodologies. Wright & Hillis (Reference Wright and Hillis2014) and Puttick et al. (Reference Puttick, O’Reilly, Tanner, Fleming, Clark, Holloway and Donoghue2017) claimed that Bayesian analysis outperforms parsimony methods for discrete morphological data but O’Reilly et al. (Reference O’Reilly, Puttick, Parry, Tanner, Tarver, Fleming and Donoghue2016) wrote “only minor differences are seen in the accuracy of phylogenetic topology reconstruction between the Bayesian implementation … and parsimony methods”. Schrago, Aguiar, & Mello (Reference Schrago, Aguiar and Mello2018) used empirical data to compare Bayesian inference and maximum parsimony, and found more trees at the 95% confidence level for Bayesian inference compared to a maximum parsimony method and concluded Bayesian inference was less precise than maximum parsimony. Brown et al. (Reference Brown, Parins-Fukuchi, Stull, Vargas and Smith2017) and Goloboff et al. (Reference Goloboff, Galvis and Arias2018) also recommended caution for the model being applied to morphological data as the methods applied by Puttick et al. (Reference Puttick, O’Reilly, Tanner, Fleming, Clark, Holloway and Donoghue2017) and O’Reilly et al. (Reference O’Reilly, Puttick, Pisani and Donoghue2017) might, as pointed out by Goloboff et al. (Reference Goloboff, Galvis and Arias2018), cause long branch attraction for parsimony methods (Felsenstein, Reference Felsenstein1978). Hence, in practice, parsimony methods are at least not worse than, maximum likelihood methods (Puttick et al., Reference Puttick, O’Reilly, Tanner, Fleming, Clark, Holloway and Donoghue2017) and it is the most widely applied method for morphological data (Wright & Hillis, Reference Wright and Hillis2014; Puttick et al., Reference Puttick, O’Reilly, Tanner, Fleming, Clark, Holloway and Donoghue2017). Another consideration is what is known as long branch attraction. When the evolutionary rate is extremely unbalanced, there will be a long branch attraction which leads to inconsistency of tree estimation (Felsenstein, Reference Felsenstein1978). With two possible character states, each with a possibility of P and Q to change, when P
2 ≤ Q(1−Q), there might be a long branch attraction problem. For small Q, the situation is approximated by
 ${P}\leq \sqrt Q $
(Felsenstein, Reference Felsenstein1978). If there is a significant difference in the evolution rate, modified parsimony methods that reduce the impact of the evolutionary rate (Lake, Reference Lake1987; Willson, Reference Willson1999) or maximum likelihood methods, which are less sensitive to long branch attraction, should be considered. The final consideration is to recognise the necessity to align the research method and the research objective. There are several algorithms for constructing a cladistics tree using the parsimony criterion. Camin & Sokal (Reference Camin and Sokal1965) introduced the first algorithm to apply parsimony in constructing a cladogram. Later, Kluge & Farris (Reference Kluge and Farris1969) presented the Wagner parsimony algorithm for constructing a cladogram and generating the most parsimonious tree. Fitch (Reference Fitch1971) and Farris (Reference Farris1973) introduced other methods for tree construction. These algorithms have different assumptions, with the main differences being:
1. Camin-Sokal parsimony assumes evolution is irreversible, that is, a derived character state cannot return to its ancestral state.
2. Wagner parsimony assumes evolution is reversible, and the rates of change in either direction is roughly the same. It also assumes ordered characters, that is, a change from state 3 to state 1 must pass through state 2.
3. Fitch parsimony assumes evolution is reversible with approximately the same change rate in each direction, and it considers all characters as unordered, that is, a change from state 3 to state 1 does not have to go through state 2.
4. Dollo parsimony (Dollo, Reference Dollo1893) assumes the transition from the ancestral state is very rare, but there is no restriction on transitions from derived state to ancestral state.
4. Applying Cladistics Analysis to the Financial System
The application of cladistics analysis to the financial systems is then not straightforward and it is necessary to ensure the research method and the research objective are aligned. One of the issues that arises is that for biological molecular data there are only four nucleobases, namely adenine (A), cytosine (C), guanine (G), thymine (T) as the fundamental genetic code for DNA, and A, G, C, uracil (U) for RNA but it is difficult to identify comparable basic characteristics for financial events. The financial event characteristics are usually derived from descriptions of the events and are then estimations of underlying basic characteristics and are not constant across different financial events in the same way that the nucleobase characteristics are constant in biology. For instance, the bank operational risk studies (Li et al., Reference Li, Allan and Evans2017a , Reference Li, Allan and Evans2017b ) estimated the major drivers of operational risk events across different regions by transforming the descriptions of the events to some characteristics but other financial risk studies (Evans et al., Reference Evans, Allan and Cantle2017; Shi et al., Reference Shi, Allan, Evans and Yun2018a ) used very different characteristics to that of Li et al. (Reference Li, Allan and Evans2017a , Reference Li, Allan and Evans2017b ) as the research objectives were to analyse WEF global risks and credit risk. Morphological data which considers characteristics would then seem a better choice for analysis of financial events and since likelihood methods (as well as Bayesian methods) are model based, which is hard to generate for financial events, parsimony is a reasonable basis to adopt (Goloboff et al., Reference Goloboff, Torres and Arias2017). For financial event characteristic encoding, there are four main objectives:
1. The encoding should reflect the attributes under investigation. It is important to note that, unlike the application in biology, the encoding of financial events is not an objective process, and the selection of characteristics and the identification of different states must be chosen so as to correctly represent the information contained in the source data and match the purpose of the study.
2. The encoding should help reduce the total number of events. As the financial data may have millions of events, it is vital to reduce the number of events to a practical level. One way to limit the number of unique events is to apply binary encoding to the source data.
3. The encoding should reflect the underlying assumption in the algorithm being applied, for example, if the Camin-Sokal algorithm is applied, then the cause of events should be set constantly as state 1.
4. Continuous characteristics should be transformed into discrete data for cladistics analysis. There are several methods to transform continuous data into discrete data, for example, simple gap-coding (Mickevich & Johnson, Reference Mickevich and Johnson1976), segment coding (Colless, Reference Colless1980) and generalised gap-coding (Archie, Reference Archie1985). These methods create gaps to produce discrete codes for continuous data (Kitching et al., Reference Kitching, Forey, Humphries and Williams1998).
Based on these objectives, we would argue that for financial events, encoding method 3 as outlined in section 3 would be appropriate as using binary encoding for the presence and absence of a characteristic results in categorical data, which reduces the states (compared to encoding methods 1 and 2) and the number of characteristics (compared to encoding method 4). However, this encoding method, as discussed before, will require careful selection of the characteristics to present the attributes of the financial events. Another issue worth mentioning is the information loss when transforming continuous characteristics. Wiens (Reference Wiens2001) proposed a method for transforming continuous characteristics based on gap-weighting (Thiele, Reference Thiele1993), which leads to less information loss than gap-coding (Mickevich & Johnson, Reference Mickevich and Johnson1976). The interpretation of the phylogenetic trees for financial events is also quite different to that for biological application which focuses more on the structure of the leaves (A, B, C, D, E, F) in Figure 1, to provide classification of species but in financial event studies, they represent the financial events that occurred. Nodes, for example, a, b, c and d in Figure 1, correspond to lineage-splitting events, and in financial event studies, they are the characteristics of events. The branches, that is, the connections between nodes, also have a different meaning for financial event studies where these branches specify relationships rather than an evolutionary path, as there is no time line involved and financial event analysis is an unrooted tree. Given the hierarchical structure of the phylogenetic trees for financial events the left most characteristics can be referred to as level 1 characteristics, for example, nodes a and b in Figure 1. The second characteristics along the path are denoted as level 2 characteristics, for example, nodes c and d in Figure 1, and so on. The level 1 characteristics for financial events can be thought of as the most systemic characteristics as they apply to the most events and therefore are of most interest in controlling the occurrence of the events as controlling these characteristics will have the most impact on financial losses. There are also other issues to consider, including the rate of change of the combination of characteristics that result in a new financial event as this will not be a constant as demonstrated in Li et al. (Reference Li, Shi, Allan and Evans2018) where the rate of change for credit defaults and capital markets was shown to significantly increase as a tipping point was approached but operational risk events did not show a similar rate of change over the same time period. In determining the appropriate algorithm for financial event studies, since Dollo parsimony includes the unrealistic assumption for financial events that transition from an ancestral state is very rare and Fitch parsimony is a generalised Wagner methodology, we recommend either Fitch parsimony or Camin-Sokal parsimony. If the number of characteristics is small and all the states are irreversible, Camin-Sokal parsimony is recommended, as it allows a simple and intuitive way to transform data. In the bank operational risk studies, Li et al. (Reference Li, Allan and Evans2017b ) used Camin-Sokal method to construct the trees. However, if the characteristics are in multiple states, or the number of events and characteristics are large, Fitch parsimony will be more efficient.
5. Empirical Illustrations
To illustrate the value of cladistics analysis relative to traditional statistical analysis we have included a brief comparative analysis for credit risks, operational risk events and motor vehicle insurance claims.
5.1. Credit risks
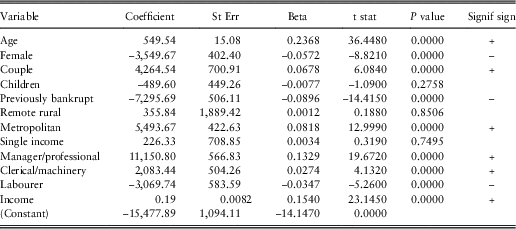
Ali et al. (Reference Ali, Anderson, O’Brien and Ramsay2016) used a multi-factor regression methodology to assess the relevance of characteristics of bankrupt individuals and Table 1 shows the statistical results of their analysis.
Relationship between unsecured debt and multiple demographic and personal attributes occurring in combination (OLS regression results).

Note 1: OLS regression diagnostics: Multiple R 0.3805.
Note 2: Adjusted R 2 0.1448; F-stat 317.55; signif p = 0.0000; d.f. 12 and 22,504 (residual).
The statistically significant causes were identified as age, couple (i.e. couples are more likely to go bankrupt than single people), metropolitan, (i.e. people living in cities are more likely to go bankrupt than people living outside of cities), clerical/machinery (i.e. people engaged in clerical jobs or jobs associated with machinery are more likely to go bankrupt) and income. Shi et al. (Reference Shi, Evans and Li2018b ) used cladistics analysis on data from the same source as Ali et al. (Reference Ali, Anderson, O’Brien and Ramsay2016) and was able to provide much richer insights into bankruptcies using the Carmin-Sokal algorithm. The consistent systemic characteristics identified by the cladistics analysis were age, gross income, spouse income, no real assets and major city, which shows differences to the results for Ali et al. (Reference Ali, Anderson, O’Brien and Ramsay2016) and suggests that bankruptcies occur predominately within the pre-retirement population and importantly, are driven by what Shi et al. (Reference Shi, Evans and Li2018b ) defined as socio-economic issues rather than characteristics controllable by the individual. The cladistics analysis also was able to identify some emerging characteristics that existed at a lower level than the systemic characteristics, namely, motor vehicle ownership, superannuation and insurance, credit card liabilities, primary income source and gender that may emerge as a systemic characteristic, that is, further socio-economic characteristics related to asset ownership and liabilities may emerge as systemic characteristics. Further analysis considering the macro-economic factors of the change in GDP, change in interest rates and the change in unemployment rates indicated that the change in interest rates and the change in the unemployment rate were very significant drivers of individual bankruptcies and rank with the micro-economic factors of age and gross income. The use of cladistics then was able to identify that both micro-economic and macro-economic factors were systemic factors in influencing bankruptcy, and that there were emerging characteristics that needed to be watched, which is not possible with regression type analysis. The cladistics analysis identifies the factors/characteristics that are the most common in affecting bankruptcies, which is a very different concept to regression analysis which is focused on finding weights for various factors such that in aggregate, the outcome of the equation is as close as possible to the observed values and is an “on average” estimate.
5.2. Operational risk events
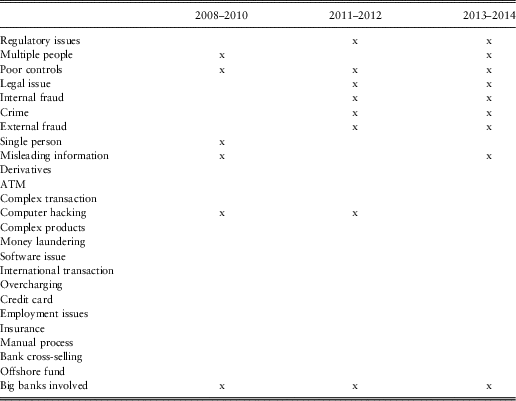
Another interesting example of where cladistics analysis can yield richer insights into financial events is analysis of operational risk events. Chernobai et al. (Reference Chernobai, Jarion and Yu2011) used regression analysis to identify that most operational losses in US banks over the period 1980–2005 could be traced to a breakdown of internal control, and that the banks with greater operational risk events tended to be younger and more complex, have higher credit risk, more anti-takeover provisions and chief executive officers (CEOs) with higher stock option holdings and bonuses relative to salary than other banks. This analysis highlights one of the issues involved with statistical analysis in that it requires factors that can be quantified and that in itself brings issues of relevancy and reliability of the outcomes. A comparable cladistics analysis using the Carmin-Sokal algorithm of US bank operational risk events over the period 2008–2014 by Li et al. (Reference Li, Allan and Evans2017a ) identified the systemic drivers were regulatory issues, multiple people involved, poor controls, legal issue, internal fraud, crime, external fraud, misleading information, computer hacking and “big banks involved” which is significantly different to Chernobai et al. (Reference Chernobai, Jarion and Yu2011). The different results in this instance are primarily due to the ability of cladistics analysis to work with characteristics rather than just statistical data. The Li et al. (Reference Li, Allan and Evans2017a ) results are of value to both banks and regulators in terms of trying to manage operational risk events as the cladistics analysis over time was able to also show stability of the systemic drivers, giving management and regulators greater confidence to concentrate on these characteristics alone to reduce operational risk events. Appendix A includes a more detailed explanation of how the cladistics analysis was applied to US operational risk events and is extracted from Li et al. (Reference Li, Allan and Evans2017a ).
5.3. Motor vehicle insurance claims
Whilst Boucher & Denuit (Reference Boucher and Denuit2006) were primarily concerned with establishing the effects of alternative methodologies for Poisson regression when analysing motor vehicle claims, their analysis showed that categorising young drivers as a homogenous group from a risk perspective was not appropriate and that individual characteristics should be considered. When applied to financial events, and subject to aligning the choice of characteristics to both the research outcome and the algorithm being applied, cladistics analysis will show systemic characteristics and could be applied to analyse the issue being raised by Boucher & Denuit (Reference Boucher and Denuit2006). Whilst not specifically addressing the issue raised by Boucher & Denuit (Reference Boucher and Denuit2006); Evans & Li (Reference Evans and Li2018b ) used cladistics analysis with the Fitch algorithm and encoding to transform the continuous characteristics into a binary format to determine the systemic characteristics of over 200,000 motor vehicle claims and concluded that whereas the policies had been underwritten with 16 rating factors, there were only 3 systemic characteristics, and importantly, there were another 3 emerging systemic characteristics. Cladistics analysis could be easily used to research further the systemic characteristics of the younger drivers identified in Boucher & Denuit (Reference Boucher and Denuit2006) subject to data availability.
6. Conclusion
Given the financial systems are CAS which exhibit emergence through interactions of agents in the financial systems, and move through transition phases, then traditional statistical analysis will only be reliable where the predictive time horizon is very short, and over longer periods should be expected to have a high failure rate due to emergence of the financial system. Cladistics analysis offers an additional basis of analysis for financial systems and will show the systemic drivers of events and the emergence of new systemic characteristic combinations or stability if a temporal analysis is undertaken. For a richer analysis of financial systems, a cladistics analysis should be undertaken to compliment traditional statistical analysis.
Appendix A
An application of cladistics analysis to US bank operational risks Footnote 2
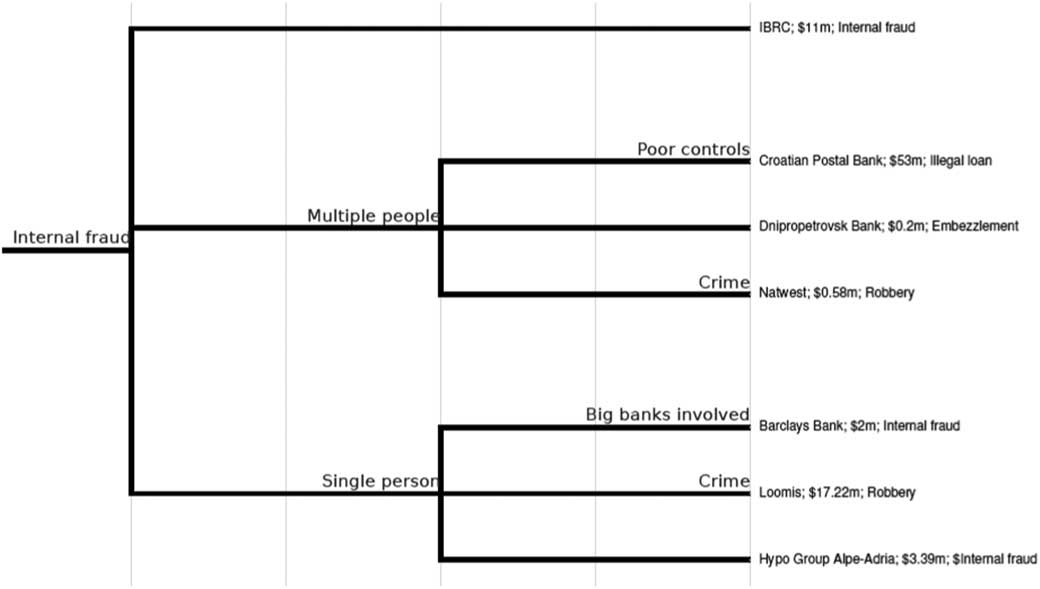
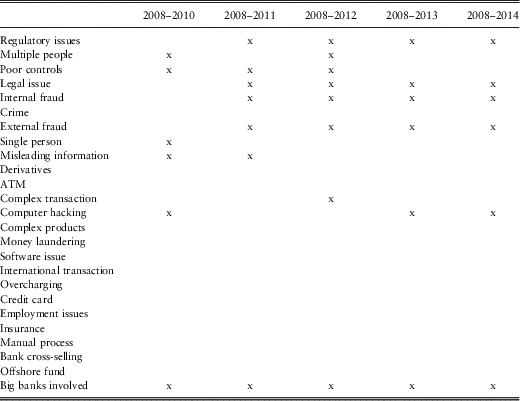
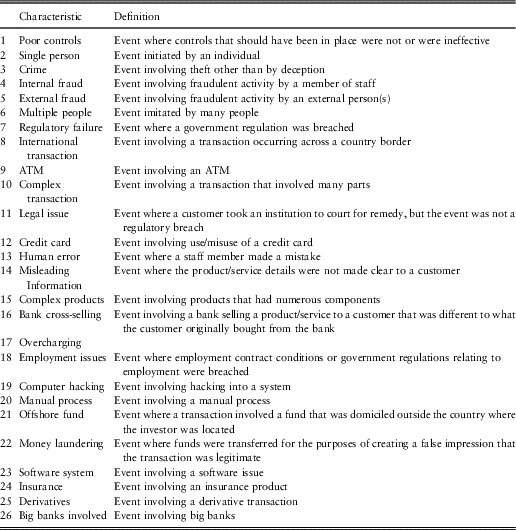
We extracted data from the ORIC InternationalFootnote 3 database of operational risk events for US banks from 2008 to the middle of 2014 and after filtering and cleaning the data, the US data contained 1371 unique risk events. We derived from the data a set of characteristics as shown in Appendix B Footnote 4 to use in the analysis. Several software programs are able to perform cladistics analysis using the maximum parsimony algorithm, and in this study, we used software from Systemic ConsultFootnote 5 . Alternative software is available in R. Figure A1 presents an example of the output of the cladistics analysis. This tree is read from left to right. The left most characteristic, that is, “Internal fraud”, can be thought of as the “level 1” characteristic and occurs for a group of risk events. These level 1 characteristics are important, as whilst all the characteristics leading to a risk event must be linked for that risk event to occur, if an institution can break the chain of linking characteristics, then the risk event won’t occur. Given the level 1 characteristics are those characteristics that are common to several risk events, then it is logical to concentrate on managing these systemic characteristics to mitigate risk events occurring. The level 2 characteristics, that is, “Multiple people” and “Single person” are not as systemic as the level 1 characteristic, and the level 3 characteristics in this figure, that is, “Poor controls”, “Crime” and “Big banks involved” are the un-systemic characteristic for each event. One characteristic can appear in different places and at different levels, that is, in this tree, “Crime” appears at level 3 for different events. The value of applying cladistics analysis to financial events is the ability to derive the level 1 characteristics and establish their stability, as that is a necessary prerequisite to their being an efficient target for risk mitigation. Tables A1 and A2 show the level 1 characteristics we derived for the US banks for both cumulative and independent periods.
An example of cladistics tree for US Bank Operational Risks.

Level 1 characteristics for cumulative periods for US banks.

Level 1 characteristics for independent periods for US banks.

Appendix B: Characteristics used in the US bank operational risk analysis
Characteristics used in the US bank operational risk analysis