
1. Introduction
The Richtmyer–Meshkov instability (RMI), triggered by shock acceleration at perturbed material interfaces, arises from baroclinic vorticity generated by misaligned pressure and density gradients (Richtmyer Reference Richtmyer1960; Meshkov Reference Meshkov1969). This instability governs fluid mixing in systems ranging from astrophysical phenomena like supernova remnants (Kuranz, Park & Huntington Reference Kuranz2018) to engineering applications such as scramjet combustion (Urzay Reference Urzay2018) and inertial confinement fusion (ICF) (Kritcher et al. Reference Kritcher2022; Zylstra et al. Reference Zylstra2022), and several reviews have concluded the progress of the RMI development (Brouillette Reference Brouillette2002; Ranjan, Oakley & Bonazza Reference Ranjan, Oakley and Bonazza2011; Zhou Reference Zhou2017a ,Reference Zhou b ; Zhou et al. Reference Zhou2021, Reference Zhou, Sadler and Hurricane2025). While RMI enhancement is critical for fuel–air mixing in propulsion systems, its suppression remains imperative for improving the efficiency of ICF, where interfacial mixing degrades hot-spot compression (Spears et al. Reference Spears2014; Betti & Hurricane Reference Betti and Hurricane2016).
For a single-shocked interface, the perturbation evolution depends on interface type: light–heavy interfaces (the shock passes through the interface from a light fluid to a heavy fluid) exhibit sustained amplitude growth after shock compression (Richtmyer Reference Richtmyer1960), whereas heavy–light interfaces (the shock passes through the interface from a heavy fluid to a light fluid) undergo phase inversion prior to growth. In both cases, intrinsic instability progression remains challenging to suppress. Vorticity dynamics dominates the behaviour of post-shock interface perturbation, motivating strategies to modulate RMI through second wave impacts that alter vorticity deposition. Mikaelian (Reference Mikaelian1985) pioneered this approach, demonstrating that a second shock impact could classify RMI evolution into thirteen distinct regimes. Among these regimes, growth stagnation, the complete cessation of amplitude development, represents a promising pathway for controlling interfacial mixing in shock-driven systems.
In previous work, second wave impacts have proven effective in suppressing RMI growth at single interfaces. For light–heavy configurations with single-mode perturbations, growth stagnation has been achieved through appropriate reflected shocks in both numerical studies (Mikaelian Reference Mikaelian2010) and shock-tube experiments (Chen et al. Reference Chen, Xing, Wang, Zhai and Luo2023b ). Conversely, stabilising RMI at heavy–light interfaces requires successive same-direction shocks, which has been validated through numerical simulations (Charakhch’yan Reference Charakhch’yan2000, Reference Charakhch’yan2001), and recent high-energy density physics experiments (Merritt et al. Reference Merritt2023; Schill, Armstrong & Nguyen Reference Schill2024) and shock-tube experiments (Zhai et al. Reference Zhai, Chen, Xing, Li, Cao, Wang and Luo2025). Notably, reflected rarefaction waves offer an alternative control strategy by imparting accelerations aligned with the initial shock direction, enabling suppression of heavy–light interface perturbations in shock-tube systems (Chen et al. Reference Chen, Xing, Wang, Zhai and Luo2023a ). These results collectively establish second wave interactions as a robust methodology for single-interface RMI modulation.
In real-world scenarios, RMI typically occurs in multi-interface systems, and prior research has focused on a single fluid layer bounded by two interfaces, typically generated via the gas curtain technique (Jacobs et al. Reference Jacobs, Klein, Jenkins and Benjamin1993), the soap-film technique (Liang & Luo Reference Liang and Luo2023b ) or the oscillating technique (Schalles et al. Reference Schalles, Louie, Peabody, Sadler, Zhou and Jacobs2024). Unlike single interfaces, a shocked fluid layer exhibits a unique dynamics due to wave reverberation and interface coupling. Theoretical frameworks have quantified how these coupled phenomena govern layer evolution (Mikaelian Reference Mikaelian1985; Jacobs et al. Reference Jacobs, Jenkins, Klein and Benjamin1995; Chen et al. Reference Chen, Wang, Zhai and Luo2024b ). In numerical simulations, the phase effect (Liang Reference Liang2022), nonlinear effect (Chen et al. Reference Chen, Wang, Zhai and Luo2024a ) and geometric configuration effect (West et al. Reference West, Sadler, Powell and Zhou2024) on the RMI growth of a fluid layer have recently been investigated. Efforts to control the RMI growth of a layer have achieved partial success. Mikaelian (Reference Mikaelian1996) numerically demonstrated growth stagnation at the upstream interface of a heavy layer, while recent works attenuated downstream interface perturbations through upstream interface shape optimisation and layer-width adjustment (Sterbentz et al. Reference Sterbentz, Jekel, White, Aubry, Lorenzana and Belof2022; Chen et al. Reference Chen, Wang, Zhai and Luo2024b ). Numerical simulations also suggested selective growth stagnation at either the upstream or downstream interface in a heavy layer (Cong et al. Reference Cong, Guo, Zhou, Cheng and Si2024) and sequential heavy–light interface configurations (Liang & Luo Reference Liang and Luo2023a ). Recently, Mikaelian (Reference Mikaelian2025) theoretically proposed quantitative approaches that suppress the RMI at a layer through the interface-coupling effect. However, these strategies necessitate stringent initial conditions such as specific amplitude ratios, severely constraining their practical utility in real-world systems.
In ICF, capsules, laser-driven shocks, induce perturbation growth at three critical interfaces: the ablation front (light–heavy interface) (Qiao & Lan Reference Qiao and Lan2021), the interface between ablator and deuterium–tritium (DT) ice (heavy–light interface) (Amendt Reference Amendt2021) and the DT ice–gas fuel interface (heavy–light interface) (Lobatchev & Betti Reference Lobatchev and Betti2000), as shown in figures 1(a)–1(b). These interfaces collectively form a dual-layer structure, comprising one light–heavy and two sequential heavy–light interfaces. The evolution of the shocked dual layer exhibits significantly greater complexity than single-layer systems, with existing studies remaining limited in scope. While prior work has quantified the interface-coupling effects for a dual layer in both linear (Liang & Luo Reference Liang and Luo2021) and nonlinear regimes (Liu et al. Reference Liu, Li, Yu, Fu, Wang, Wang and Ye2018b ), these analyses assumed idealised vacuum conditions, neglecting external fluid interactions with the layer. Crucially, the coupled dynamics of wave reverberation and interface coupling in a dual-layer system remains uncharacterised, particularly for systems with realistic boundary constraints. This knowledge gap obstructs the development of predictive control frameworks, motivating the present study.
This work addresses gaps by investigating a shock-accelerated dual-layer system comprising a flat light–heavy interface followed by two heavy–light interfaces, as shown in figure 1(c), designed to emulate RMI at the three classical interfaces of an ICF capsule. Recognising the dominant role of the inner DT ice–gas interface roughness in ignition performance (Bodner et al. Reference Bodner1998), we construct a prototypical dual-layer system with a flat light–heavy interface, an unperturbed upstream heavy–light interface and a single-mode downstream heavy–light interface. A theoretical framework is developed to resolve both the effects of wave reverberation and interface coupling on perturbation growth at the heavy–light interfaces. According to the model, the possibilities of the perturbation growth at the two heavy–light interfaces are analysed, and then shock-tube experiments and numerical simulations are conducted for validation.
Schematic diagrams of the classical ICF target consisting of ablator, DT ice fuel and DT gas fuel (a) before the ignition, (b) during the ignition and (c) the dual-layer system considered in this work.

2. Theoretical analysis
2.1. Derivation of the model
Dual-layer systems exhibit substantially enhanced complexity in wave–interface inter- actions compared with single-layer configurations, with the interplay of the coupled interface dynamics and reverberating waves posing substantial challenges for quantitative analysis (Mikaelian Reference Mikaelian1985). To isolate these effects, our model simplifies the system by maintaining flat geometries for both the light–heavy interface (AI) which is the first shock-impacted interface, and the upstream heavy–light interface (UI). This geometric design choice effectively suppresses perturbation growth at AI while eliminating its interaction with UI, thereby allowing focused analysis on the UI and downstream heavy-light interface (DI). Despite these simplifications, the presence of AI introduces additional wave-reverberation pathways within the dual-layer structure. Consequently, the perturbation evolution at DI remains inherently more complex relative to single-layer systems, as reverberation waves from AI persistently modulate the vorticity distribution at the interface. This controlled reduction of variables provides a foundational framework for resolving dual-layer instability mechanisms while preserving key physical drivers of multi-interface coupling.
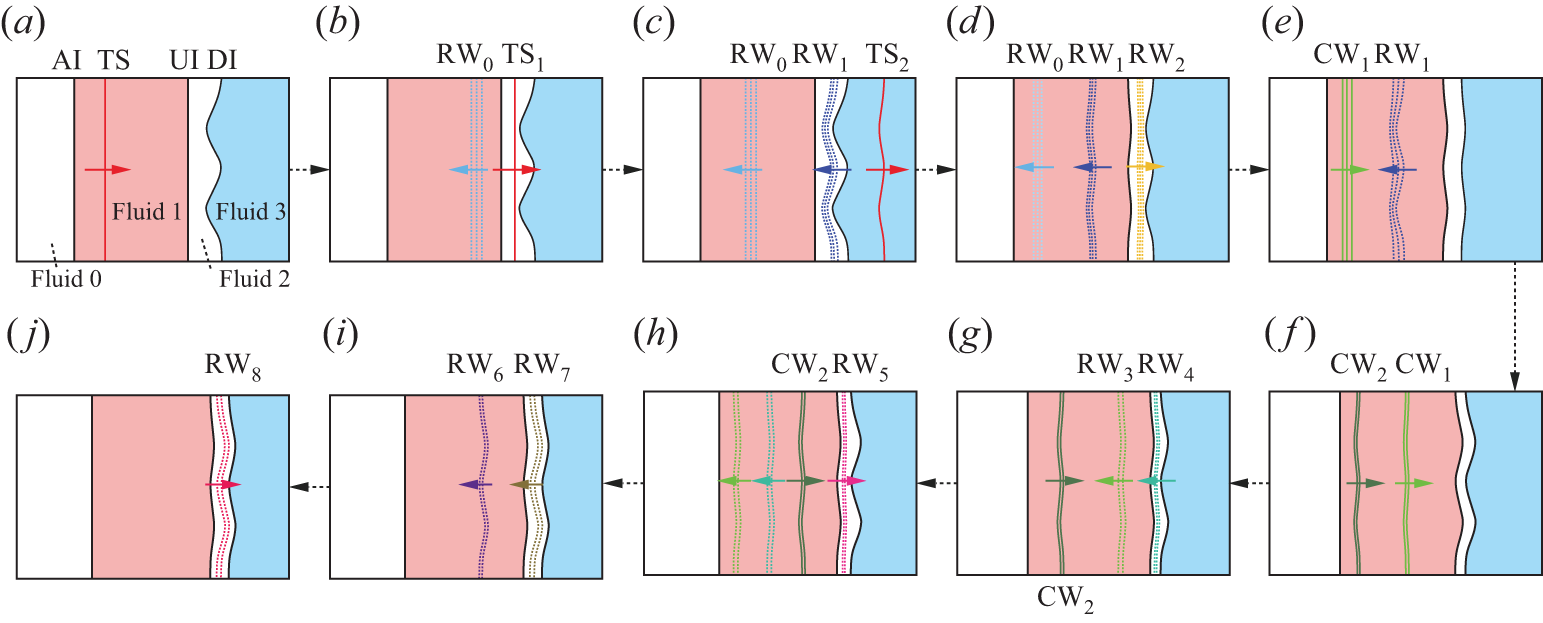
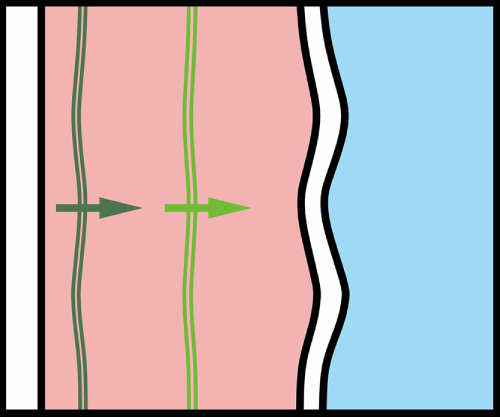
Schematic diagrams of a shock accelerating a fluid dual-layer which contains a AI and two successive heavy-light interfaces. (a) The incident shock has passed through the first AI, generating the transmitted shock (TS), which is about to impact the upstream UI; (b) the rarefaction waves (RW
 $_0$
) moving towards AI are generated by TS interacting with UI and the second transmitted shock (TS
 $_1$
) moves to DI; (c) after TS
 $_1$
passes through DI, the third transmitted shock (TS
 $_2$
) is generated and the rarefaction waves RW
 $_1$
moving to UI are reflected; (d) after the RW
 $_1$
pass through UI, rarefaction waves RW
 $_2$
are reflected to move to DI and the RW
 $_1$
move to AI following RW
 $_0$
; (e) RW
 $_0$
has struck AI, the reflected compression waves CW
 $_1$
are formed, while the RW
 $_1$
have not reached AI and are about to collide with CW
 $_1$
; (f) after the RW
 $_1$
interact with AI, the compression waves CW
 $_2$
are generated and move to UI following CW
 $_1$
; (g) the CW
 $_1$
, respectively, accelerate UI and DI, which create rarefaction waves RW
 $_3$
and RW
 $_4$
from UI and DI; (h) the RW
 $_4$
interact with UI, forming the RW
 $_5$
moving downwards, and the CW
 $_2$
is about to impact UI; (i) and (j) rarefaction waves RW
 $_6$
(RW
 $_7$
) are generated by CW
 $_2$
impacting UI (DI) and rarefaction waves RW
 $_8$
are reflected by the interaction between RW
 $_7$
and UI. The left-most white area is the region of fluid 0, the pink area between AI and UI represents the region of heaviest fluid 1, the white area sandwiched between UI and DI is the region of fluid 2 with the medium density and the right-most blue area is the region of fluid 3 with the lowest density.

As shown in figure 2(a), the stratified configuration comprises four distinct fluid domains: the first white area at the upstream side of AI is fluid 0 region, the pink area between AI and UI represents the region of fluid 1 with the highest density, the white area sandwiched between UI and DI is the region of fluid 2 with the medium density and the right-most blue area is the region of fluid 3 with the lowest density. In the present work, the fluid 1 is SF
 $_6$
, both the fluids 0 and 2 are air and the fluid 3 is helium. We define
 $L_0$
and
 $W_0$
as the initial distance between UI and AI, i.e. the width of the pink SF
 $_6$
region (fluid 1 region), and the initial distance between UI and DI, i.e. the width of the second white region (fluid 2 region) sandwiched between SF
 $_6$
and helium, respectively. After the shock interacts with the dual layer (the shock passing through AI is defined as the transmitted shock, TS, here), the flat AI and TS move to UI and DI, as presented in figure 2(a). In figure 2(b), the unperturbed rarefaction waves (RW
 $_0$
) and the second flat transmitted shock (TS
 $_1$
) are generated after TS interacts with UI. In this work, the initial time is defined as the moment when TS
 $_1$
impacts DI. Following the interaction of TS
 $_1$
with DI, the perturbed rarefaction waves (RW
 $_1$
) and the third transmitted shock (TS
 $_2$
) are formed, as shown in figure 2(c). After the RW
 $_1$
pass through the unperturbed UI, UI is stretched and reflected rarefaction waves (RW
 $_2$
) are generated and travel to DI, as shown in figure 2(d). During the wave–interface interactions, the amplitudes of the waves and interfaces will be altered, as described in detail in Appendix A.
After the RW
 $_1$
leave UI and RW
 $_2$
pass through DI, interface coupling begins to affect UI and DI, respectively. To quantify the interface coupling between UI and DI, the LL-model proposed by Liang & Luo (Reference Liang and Luo2022) is modified based on the different accelerations of UI and DI, and can be expressed as
 \begin{equation} \begin{aligned} &\dot {a}_{11}[\rho _1+\rho _2\tanh (kW/2)]+\dot {a}_{21}[\rho _3+\rho _2\tanh (kW/2)]\\[6pt] &=k(\rho _2-\rho _1)(a_{1+}\Delta u_1+a_{{1R}}^+\Delta u_{{R1}})+k(\rho _3-\rho _2)(a_{20}\Delta u_2+a_{{2R}}^+\Delta u_{{R2}}), \end{aligned} \end{equation}
 \begin{equation} \begin{aligned} &\dot {a}_{11}[\rho _1+\rho _2\coth (kW/2)]-\dot {a}_{21}[\rho _3+\rho _2\coth (kW/2)]\\[6pt] &=k(\rho _2-\rho _1)(a_{1+}\Delta u_1+a_{{1R}}^+\Delta u_{{R1}})-k(\rho _3-\rho _2)(a_{20}\Delta u_2+a_{{2R}}^+\Delta u_{{R2}}). \end{aligned} \end{equation}
Here,
 $\dot {a}_{11}$
is the amplitude growth of UI after the RW
 $_1$
acceleration and
 $\dot {a}_{21}$
is the amplitude growth of DI after the RW
 $_2$
acceleration;
 $k$
is the perturbation wavenumber;
 $a_{1+}$
is the amplitude of UI just after being impacted by TS and
 $a_{20}$
is the average amplitude of the shocked and unshocked DI;
 $a_{{1R}}^+$
and
 $a_{{2R}}^+$
are the amplitudes of UI just being accelerated by the RW
 $_1$
and of DI just being impacted by the RW
 $_2$
, respectively;
 $\rho _1$
,
 $\rho _2$
and
 $\rho _3$
are the densities of fluid 1, fluid 2 and fluid 3, respectively, after the interaction of the RW
 $_2$
with DI;
 $W$
is the distance between UI and DI after TS
 $_1$
collides with DI;
 $\Delta u_1$
(
 $\Delta u_{{R1}}$
) is the jump velocity of UI induced by TS (RW
 $_1$
); and
 $\Delta u_2$
(
 $\Delta u_{{R2}}$
) is the jump velocity of DI induced by TS
 $_1$
(RW
 $_2$
). The derivations of the modified LL-model and the related parameters are provided in Appendix A. According to (2.1)–(2.2),
 $\dot {a}_{11}$
and
 $\dot {a}_{21}$
can be predicted until other reverberating waves inside the dual layer affect the perturbation growth. Notably, the modified LL-model, which considers a three-fluid system, is employed to evaluate the interface coupling between UI and DI. In this work, the first shock-impacted AI and UI are initialised as flat, and a sufficiently large separation distance is imposed between AI and UI. This geometric configuration suppresses perturbation growth at AI and decouples AI–UI interactions, thereby isolating the interface-coupling mechanism between UI and DI. By eliminating extraneous dynamics, the study focuses exclusively on UI–DI coupling.
Due to the presence of AI, the compression waves CW
 $_1$
and CW
 $_2$
are generated, respectively, after the RW
 $_0$
and RW
 $_1$
interact with AI, and move successively towards UI, as shown in figures 2(e)–2(f). After the CW
 $_1$
accelerate UI and DI, the rarefaction waves RW
 $_3$
(RW
 $_4$
) moving upstream are generated in fluid 1 (2), as presented in figure 2(g). The RW
 $_4$
accelerate UI before the CW
 $_2$
arrive at UI in this work, generating the rarefaction waves RW
 $_5$
which move downstream to stretch DI, as shown in figure 2(h). Subsequently, the rarefaction waves RW
 $_6$
and RW
 $_7$
are formed after the CW
 $_2$
accelerate UI and DI, respectively, as sketched in figure 2(i). Finally, the RW
 $_7$
interact with UI and the rarefaction waves RW
 $_8$
moving to DI are reflected, as presented in figure 2(j). After the RW
 $_8$
stretch DI, additional reverberating waves affecting the perturbation growth at either UI or DI are ignored in this work.
Compared with TS
 $_1$
and the RW
 $_1$
, the reverberating waves in figures 2
(f)–2(j) are much weaker and thus are not considered to induce a rarefaction or compression effect on the shape of either UI or DI. Moreover, since the distance between UI and DI is short in this work, the duration from the CW
 $_1$
accelerating UI to the RW
 $_8$
interacting with DI is short, and the processes described in figures 2(f)–2(j) are considered instantaneous. In other words, from the CW
 $_1$
arriving to the RW
 $_7$
(RW
 $_8$
) leaving, the amplitude variation of UI (DI) can be ignored. Therefore, after defining
 $\Delta u_{\textrm {1C}}$
(
 $\Delta u_{\textrm {2C}}$
) as the sum of the jump velocities of UI accelerated by the CW
 $_1$
, RW
 $_4$
, CW
 $_2$
, RW
 $_7$
(jump velocities of DI accelerated by the CW
 $_1$
, RW
 $_5$
, CW
 $_2$
, RW
 $_8$
), based on (2.1)–(2.2), the perturbation growth rates at UI (
 $\dot {a}_{\textrm {1C}}$
) and DI (
 $\dot {a}_{\textrm {2C}}$
) induced by the reverberating waves in figures 2(f)–2(i) can be calculated by
 \begin{equation} \begin{aligned} &\dot {a}_{\textrm {1C}}[\rho _{\textrm {1C}}+\rho _{\textrm {2C}}\tanh (kW_{\textrm {C}}/2)]+\dot {a}_{\textrm {2C}}[\rho _{\textrm {3C}}+\rho _{\textrm {2C}}\tanh (kW_{\textrm {C}}/2)]\\[6pt] &=k(\rho _{\textrm {2C}}-\rho _{\textrm {1C}})a_{\textrm {1C}}\Delta u_{\textrm {1C}}+k(\rho _{\textrm {3C}}-\rho _{\textrm {2C}})a_{\textrm {2C}}\Delta u_{\textrm {2C}}, \end{aligned} \end{equation}
 \begin{equation} \begin{aligned} &\dot {a}_{\textrm {1C}}[\rho _{\textrm {1C}}+\rho _{\textrm {2C}}\coth (kW_{\textrm {C}}/2)]-\dot {a}_{\textrm {2C}}[\rho _{\textrm {3C}}+\rho _{\textrm {2C}}\coth (kW_{\textrm {C}}/2)]\\[6pt] &=k(\rho _{\textrm {2C}}-\rho _{\textrm {1C}})a_{\textrm {1C}}\Delta u_{\textrm {1C}}-k(\rho _{\textrm {3C}}-\rho _{\textrm {2C}})a_{\textrm {2C}}\Delta u_{\textrm {2C}}. \end{aligned} \end{equation}
Here,
 $\rho _{\textrm {1C}}$
,
 $\rho _{\textrm {2C}}$
and
 $\rho _{\textrm {3C}}$
are the densities of fluid 1, fluid 2 and fluid 3 after the RW
 $_8$
interact with DI;
 $W_{\textrm {C}}$
is the distance between UI and DI after the CW
 $_1$
accelerate DI; and
 $a_{\textrm {1C}}$
and
 $a_{\textrm {2C}}$
are the amplitudes of UI and DI, respectively, just prior to the CW
 $_1$
acceleration. The expressions of
 $W_{\textrm {C}}$
,
 $a_{\textrm {1C}}$
and
 $a_{\textrm {2C}}$
are deduced in Appendix A. Combining (2.1)–(2.2) with (2.3)–(2.4), the amplitude growth rates of UI and DI after the RW
 $_8$
pass through DI can be predicted as
 \begin{equation} \begin{cases} \dot {a}_{1}=\dot {a}_{11}+\dot {a}_{\textrm {1C}}, \\[3pt] \dot {a}_{2}=\dot {a}_{21}+\dot {a}_{\textrm {2C}}. \end{cases} \end{equation}
We emphasise that the wave–interface interactions in figure 2 represent a continuous physical process spanning panels (a) to ( j). While the incident shock initially traverses the dual-layer interface, reverberating waves persistently interact with all three interfaces. To enable systematic analysis, we strategically dissect this continuum into two sequential phases, i.e. from figures 2(a) to 2(e) and from panels ( f) to (j). According to (2.5), the relationship between
 $\dot {a}_{11}$
and
 $\dot {a}_{\textrm {1C}}$
(
 $\dot {a}_{21}$
and
 $\dot {a}_{\textrm {2C}}$
) determines the amplitude growth of UI (DI) of the shocked dual layer.
2.2. Possibility analysis
In previous works (Merritt et al. Reference Merritt2023; Zhai et al. Reference Zhai, Chen, Xing, Li, Cao, Wang and Luo2025), it was demonstrated that, accelerated by two co-propagating shocks, the perturbation growth of a heavy-light interface can be manipulated and even freeze out can be achieved by choosing a suitable time interval between two successive shock impacts. In this work, as detailed in § 2, UI undergoes sequential acceleration by a primary shock and the following co-propagating compression waves (CW
 $_1$
and CW
 $_2$
), and DI is also accelerated by the co-directional CW
 $_1$
and CW
 $_2$
. Since the accelerations of both UI and DI induced by the primary shock and subsequent compression waves resemble those caused by two co-propagating shocks, this configuration enables manipulation of perturbation growth at both heavy-light interfaces. Distinct perturbation growth behaviours at UI and DI can be achieved by modulating the time interval between shock and compression wave impacts through adjustments to
 $L_0$
. Note that changing
 $L_0$
is equivalent to changing the shock-to-shock timing in laser experiments (Merritt et al. Reference Merritt2023) and shock-tube experiments (Zhai et al. Reference Zhai, Chen, Xing, Li, Cao, Wang and Luo2025).
Besides the dominant successive compression waves, the reverberating rarefaction waves between UI and DI, which result from the interactions of CW
 $_1$
and CW
 $_2$
with UI and DI, can also change the perturbation growth. Systematic adjustment of wave–interface timing (via initial layer spacing
 $L_0$
) theoretically permits nine perturbation growth regimes, analogous to a double-shocked heavy layer dynamics (Chen et al. Reference Chen, Li, Wang, Zhai and Luo2025). However, in the first sub-process, the single-mode DI, accelerated by TS
 $_1$
and RW
 $_2$
, exhibits a greater amplitude growth rate compared with UI which is driven solely by RW
 $_1$
. This asymmetry of UI and DI precludes the realisation of four regimes (where the direction modulation of DI amplitude growth occurs prior to UI growth state reversal), thereby reducing the viable scenarios to five, as shown in figure 3. In addition, after the RW
 $_1$
stretch UI, the amplitude of UI has an opposite phase to that of the initial DI. Because DI will experience a phase inversion, the amplitudes at UI and DI will finally develop with the same phase prior to the compression waves’ arrival. Under constant
 $W_0$
, as
 $L_0$
increases, the five distinct possibilities of perturbation growth at UI and DI are illustrated in figure 3, which actually shows schematically the temporal evolution of UI and DI amplitudes. For convenient discussion, the initial amplitude of DI (
 $a_{2-}$
) is assumed positive and thus
 $\dot {a}_{11}\lt 0$
and
 $\dot {a}_{21}\lt 0$
.
Schematics of the temporal evolution of UI and DI amplitudes, representing the distinct manipulation possibilities of the instability for a shocked dual layer with a AI and two successive heavy-light interfaces.

Possibility I: when
 $L_0$
is insufficient, the temporal separation between the TS
 $_1$
and CW
 $_1$
impacts at the two heavy-light interfaces becomes critically short. Under this condition, the perturbation growth rate of UI accelerated by the CW
 $_1$
, RW
 $_4$
, CW
 $_2$
and RW
 $_7$
is smaller than that accelerated by the RW
 $_1$
in magnitude (
 $\dot {a}_{\textrm {1C}}\lt -\dot {a}_{11}$
), and the perturbation growth rate of DI accelerated by the CW
 $_1$
, RW
 $_5$
, CW
 $_2$
and RW
 $_8$
is smaller than that accelerated by the RW
 $_2$
and TS
 $_1$
in magnitude (
 $\dot {a}_{\textrm {2C}}\lt -\dot {a}_{21}$
). As a result, the perturbation growth at both UI and DI cannot be reversed by the reverberating waves in the second sub-process, and the amplitudes of both UI and DI grow with the opposite phase to
 $a_{2-}$
(
 $\dot {a}_{1}\lt 0$
and
 $\dot {a}_{2}\lt 0$
).
Possibility II: as
 $L_0$
increases, the time interval between TS
 $_1$
and CW
 $_1$
interacting with the two heavy-light interfaces is prolonged, and the UI will obtain a larger amplitude when it is impacted by the compression waves. There is a special
 $L_0$
at which the perturbation growth rate of UI accelerated by the reverberating waves in the second sub-process equals the amplitude growth rate of UI just prior to CW
 $_1$
arriving. Consequently, the perturbation growth at UI is frozen after the RW
 $_7$
pass through UI (
 $\dot {a}_{\textrm {1C}}=-\dot {a}_{11}$
, i.e.
 $\dot {a}_{1}=0$
). Before the compression waves arrive, as mentioned, the growth rate of the perturbation at DI is much more significant than that at UI and more difficult to cancel. As a result, when
 $L_0$
satisfies the conditions of freezing the UI amplitude growth, the perturbation at DI still evolves with the opposite phase to
 $a_{2-}$
(
 $\dot {a}_{2}\lt 0$
).
Possibility III: when
 $L_0$
is further raised, the effect of reverberating waves in the second sub-process can reverse the UI amplitude evolution, i.e. there is a phase reversal for the perturbation at UI after it is accelerated by the CW
 $_1$
, RW
 $_4$
, CW
 $_2$
and RW
 $_7$
, and the UI amplitude grows with the same phase as
 $a_{2-}$
(
 $\dot {a}_{1}\gt 0$
). However,
 $L_0$
is still not large enough to freeze DI amplitude growth, and the perturbation at DI performs similarly to that of possibility II (
 $\dot {a}_{2}\lt 0$
). As a result, the perturbations at UI and DI grow in opposite directions.
Possibility IV: when
 $L_0$
reaches another special value that is large enough, the perturbation growth at DI can be frozen. In this situation, because the perturbation growth at UI is much slower than that at DI before the CW
 $_1$
arrive, the perturbation growth of UI is reversed by the CW
 $_1$
, RW
 $_4$
, CW
 $_2$
and RW
 $_7$
. The perturbation growth at UI is similar to that of possibility III (
 $\dot {a}_{1}\gt 0$
), but growth stagnation is achieved at DI after the RW
 $_8$
impact DI (
 $\dot {a}_{2}=0$
, i.e.
 $\dot {a}_{\textrm {2C}}=-\dot {a}_{21}$
).
Possibility V: if
 $L_0$
exceeds the special value in possibility IV, the perturbation growth at DI is reversed by the CW
 $_1$
, RW
 $_5$
, CW
 $_2$
and RW
 $_8$
. In this situation, the amplitude variations of both UI and DI are reversed after the reverberating waves considered in figure 2(f–j) interact with the two interfaces, and both the perturbations at UI and DI evolve with the same phase as
 $a_{2-}$
(
 $\dot {a}_{1}\gt 0$
and
 $\dot {a}_{2}\gt 0$
).
3. Experimental and numerical methods
3.1. Experimental methods
The experimental configuration employs an advanced soap-film technique (Liu et al. Reference Liu, Li, Yu, Fu, Wang, Wang and Ye2018a
; Chen et al. Reference Chen, Wang, Zhai and Luo2024b
) to establish precisely defined discontinuous interfaces in the dual-layer system, complemented by superhydrophobic–oleophobic surface confinement (Li et al. Reference Li, Cao, Wang, Zhai and Luo2023). As presented in figure 4(a), four transparent devices (A–D), with a width of 140 mm and a height of 6 mm, are first manufactured using acrylic plates. Two flat soap-film interfaces are formed at both sides of device B, and a single-mode soap-film interface is created at the upstream side of device D. Then SF
 $_6$
is pumped into device B to replace air, and helium is pumped into device D from its end. Thus, a dual-layer, with an unperturbed air–SF
 $_6$
interface (AI), a flat SF
 $_6$
air interface (UI) and a single-mode air–helium interface (DI), is created in the shock tube.
(a) Schematic of the interface formations by the soap-film technique, and (b) the sketch of the computational domain for a flat shock interacting with a dual layer with a flat AI, an undisturbed UI, and a disturbed DI.
 $L_0$
(
 $W_0$
), the initial distance between AI and UI (UI and DI); IS, the incident shock.

The experiments are conducted in a horizontal shock tube (Liu et al. Reference Liu, Li, Yu, Fu, Wang, Wang and Ye2018a
; Chen et al. Reference Chen, Wang, Zhai and Luo2024b
). The Mach number of the incident shock when it interacts with AI is 1.26. The perturbation wavelength (
 $\lambda$
) is fixed as
 $40$
mm, and the initial amplitude of DI satisfies the small amplitude assumption (
 $ka_{2-}=0.1$
). Schlieren photography combined with a high-speed camera (FASTCAM SA-Z, Photron Ltd) is used to record the post-shock flow field in our experiments. The frame rate of the camera is 50 400 frames per second, and the exposure time is 0.35
 $\unicode {x03BC}$
s. The spatial resolution of the schlieren image is 0.27
 $\pm$
0.01 mm pixel
 $^{-1}$
. The ambient pressure and temperature are 101.3
 $\pm$
0.1 kPa and 297.9
 $\pm$
1 K, respectively. The boundary layer effect was discussed by Liu et al. (Reference Liu, Liang, Ding, Liu and Luo2018a
), and can be ignored.
3.2. One-dimensional experiment for determining the volume fractions
To determine the volume fractions of air, SF
 $_6$
and helium in different regions of the dual-layer configuration, a one-dimensional (1-D) experiment of a shock wave interacting with a dual layer with three unperturbed interfaces is first performed. The experimental schlieren images showing the development of an undisturbed dual layer with
 $L_0=70\,{\textrm{mm}}$
and
 $W_0=20\,{\textrm{mm}}$
after shock impact are presented in figure 5(a). The initial time is defined as the moment when TS
 $_1$
meets DI in experiments and computations hereafter. When UI is accelerated by the first transmitted shock TS, a transmitted shock TS
 $_1$
is generated in air and moves to DI (−19
 $\unicode {x03BC}$
s). After TS
 $_1$
interacts with DI, the rarefaction waves RW
 $_0$
formed by TS reflecting from UI and the RW
 $_1$
generated by TS
 $_1$
reflecting from DI are both observed in experimental images (82
 $\unicode {x03BC}$
s). The transmitted shock TS
 $_2$
moving in helium and other reverberating waves described in figure 2 cannot be captured in experiments due to the low density of helium and the weak intensities of these waves. At 182
 $\unicode {x03BC}$
s, the shocked AI can be captured and the three interfaces of the dual layer all remain almost flat in experiments. After AI passes through the initial positions of UI and DI, small perturbations also arise at AI. However, both UI and DI remain unperturbed, which indicates that the interface coupling induced by AI can be ignored (662–1022
 $\unicode {x03BC}$
s). As time elapses, DI becomes obscure due to the molecular mixing of air with helium (1022
 $\unicode {x03BC}$
s).
(a) Schlieren images of an undisturbed dual layer accelerated by the incident shock, and (b) the trajectories of the interfaces and waves. Symbols and lines indicate experimental and theoretical results, respectively. The numbers in (a) denote the time in
 $\unicode {x03BC}$
s. The abbreviations have the same meaning as those in figure 2.

The trajectories of waves and interfaces extracted from the experimental high-speed diagnostics and predicted by 1-D theory are compared in figure 5(b). Quantitative agreement between experimental measurements and theoretical predictions emerges when the accelerations induced by the reverberating waves mentioned in figure 2 are quantified for the motions of UI and DI. This validation confirms that other reflected waves absent in figure 2 contribute negligibly to the interfacial dynamics, and their effects are thereby ignored in the modelling frameworks. From the comparison between experimental results and prediction of 1-D theory, the volume fractions of specific gases can be obtained. In this work, the volume fraction of air (helium) in fluid 0 is 99.5
 $\%$
(0.5
 $\%$
), the volume fraction of SF
 $_6$
(air) in fluid 1 is 90.1
 $\%$
(9.9
 $\%$
), the volume fraction of air (helium) in fluid 2 is 98.0
 $\%$
(2.0
 $\%$
) and the volume fraction of helium (air) in fluid 3 is 83.3
 $\%$
(16.7
 $\%$
). Note that, in all experimental trials, we maintain constant injection rates and durations for both helium and SF
 $_6$
to achieve comparable volume fractions within the test section. For the layer with variable width (
 $L_0$
) between AI and UI, the SF
 $_6$
injection parameters are calibrated to approach almost 100 % concentration when
 $L_0$
is maximised. However, due to sequential gas charging (SF
 $_6$
first followed by helium) and associated diffusion during the helium injection phase, the SF
 $_6$
concentration in fluid 2 inevitably decreases below saturation levels prior to shock wave arrival. The velocities required for the theoretical calculations in § 2 are calculated by 1-D theory and are provided in table 1. The specific times in this work can be calculated by combining the velocities in table 1 with
 $L_0$
and
 $W_0$
. Due to the same experimental methods being used for different cases, the parameters given in table 1 are considered as the initial parameters in the following disturbed cases for both the experiments and numerical simulations.
Theoretical parameters in undisturbed case:
 $v_1^{{TS}}$
and
 $v_2^{{TS}}$
are the velocities of the TS
 $_1$
and TS
 $_2$
;
 $\Delta u_1$
(
 $\Delta u_2$
),
 $\Delta u_{{R1}}$
(
 $\Delta u_{{R2}}$
) and
 $\Delta u_{\textrm {1C}}$
(
 $\Delta u_{\textrm {2C}}$
) are the jump velocities of UI (DI) induced by TS (TS
 $_1$
), the RW
 $_1$
(RW
 $_2$
) and reverberating waves after the CW
 $_1$
, respectively;
 $c_1$
and
 $c_2$
are the sound speeds of fluid 2 before and after being accelerated by the RW
 $_1$
, respectively;
 $c_3$
(
 $c_4$
) are the sound speeds of fluid 2 near UI (DI) after being accelerated by the RW
 $_1$
(RW
 $_2$
);
 $u_{\textrm {C1}}$
is the velocity of UI being accelerated by the CW
 $_1$
but not being accelerated by the RW
 $_4$
;
 $\gamma _{20}$
is the adiabatic exponent of the fluid 2;
 $\rho _{2-}$
(
 $\rho _{3-}$
) and
 $\rho _{2+}$
(
 $\rho _{3+}$
) are the densities of fluid 2 (3) near DI before and after being accelerated by TS
 $_1$
.
 $\rho _1$
(
 $\rho _{\textrm {1C}}$
),
 $\rho _2$
(
 $\rho _{\textrm {2C}}$
) and
 $\rho _3$
(
 $\rho _{\textrm {3C}}$
) are the densities of fluid 1, 2 and 3, respectively, after DI impacted by the RW
 $_2$
(after the RW
 $_8$
impacting DI). The units of velocity and density are m s
 $^{-1}$
and kg m
 $^{-3}$
, respectively.

3.3. Numerical scheme and set-up
Numerical simulations are performed to capture more details of a shock interacting with a dual layer and to explore the effects of the initial conditions. The compressible two-dimensional (2-D) multi-component non-reactive Euler equations are adopted to describe the flow. The governing equations in conservative form are expressed as
 \begin{equation} \frac {\partial \rho }{\partial t}+\nabla \cdot (\rho \boldsymbol{u})=0, \end{equation}
 \begin{equation} \frac {\partial \rho \boldsymbol{u}}{\partial t}+\nabla \cdot (\rho \boldsymbol{u} \otimes \boldsymbol{u}+p \boldsymbol{\delta })=0, \end{equation}
 \begin{equation} \frac {\partial \rho E}{\partial t}+\nabla \cdot [(\rho E+p)\boldsymbol{u}]=0, \end{equation}
 \begin{equation} \frac {\partial \rho Y_l}{\partial t}+\nabla \cdot (\rho Y_l \boldsymbol{u})=0 \quad (l=1, \ldots , N-1), \end{equation}
where
 $\rho$
,
 $\boldsymbol{u}=[u,v]^t$
,
 $p$
,
 $E$
and
 $Y_l$
stand for the density, velocity vector, pressure, total energy per unit mass of the mixture and mass fraction of species
 $l$
, respectively;
 $\otimes$
and
 $\boldsymbol{\delta }$
are the tensor product the Kronecker delta, respectively. The equation of state is expressed as
 \begin{equation} E=\frac {p}{\rho (\gamma -1)}+\frac {1}{2}\boldsymbol{u}\cdot \boldsymbol{u}, \end{equation}
where
 $\gamma$
refers to the specific heat ratio of the mixture and is calculated by
 \begin{equation} \gamma = \displaystyle\frac {\sum \displaystyle\frac {Y_l\gamma _l}{M_l(\gamma _l-1)}}{\sum \displaystyle\frac {Y_l}{M_l(\gamma _l-1)}}, \end{equation}
with
 $\gamma _l$
and
 $M_l$
being the specific heat ratio and molar mass of species
 $l$
, respectively. In this work, four species, N
 $_2$
, O
 $_2$
, helium and SF
 $_6$
, are considered. In the simulations,
 $\gamma _1= 1.4005$
,
 $M_1=28.0134$
g mol
 $^{-1}$
are adopted for N
 $_2$
,
 $\gamma _2=1.3956$
,
 $M_2=31.9988$
g mol
 $^{-1}$
for O
 $_2$
,
 $\gamma _3=1.6667$
,
 $M_3=4.0026$
g mol
 $^{-1}$
for helium and
 $\gamma _4=1.094$
,
 $M_4= 146.055$
g mol
 $^{-1}$
for SF
 $_6$
. Air is considered as the mixture of N
 $_2$
with volume fraction of 79
 $\%$
and O
 $_2$
with volume fraction of 21
 $\%$
.
In the simulations, the numerical scheme high-order weighted essentially non- oscillatory (WENO) and double flux (HOWD) (Ding et al. Reference Ding, Si, Chen, Zhai, Lu and Luo2017) is employed. The fifth-order WENO construction (Jiang & Shu Reference Jiang and Shu1996) is combined with the multi-component double-flux algorithm (Abgrall & Karni Reference Abgrall and Karni2001; Billet & Abgrall Reference Billet and Abgrall2003) to capture material interfaces and wave patterns with high resolution and high-order accuracy. The third-order total variation diminishing Runge–Kutta scheme is used for time advancing. The HOWD has demonstrated accuracy and reliability for simulating a shock wave interacting with gas interfaces (Ding et al. Reference Ding, Si, Chen, Zhai, Lu and Luo2017; Cao et al. Reference Cao, Li, Wang, Zhai and Luo2024; Li et al. Reference Li, Chen, Zhai and Luo2024), and for more details about the scheme the reader can refer to the work of Ding et al. (Reference Ding, Si, Chen, Zhai, Lu and Luo2017). The validity of the numerical methods will also be verified later through experiments.
The initial configuration for the 2-D numerical simulations, faithfully replicating the experimental geometry, is shown in figure 4(b). The inlet and outlet boundary conditions are enforced at the left and right boundaries, respectively, whereas periodic boundary conditions are imposed at the upper and lower boundaries. The widths of the computational domain in the
 $x$
and
 $y$
directions are 300 and 40 mm (the perturbation wavelength), respectively. The intensity of the IS, ambient pressure and temperature are set according to the experimental values in § 3.1. The volume fractions of specific gases in the domains of the numerical flow are enforced as the 1-D experimental result in § 3.2.
3.4. Code validation
One shock-tube experiment with the initial parameters of
 $ka_{1+}=0$
(
 $ka_{2-}=0.1$
),
 $W_0=10\,{\textrm{mm}}$
and
 $L_0=57.2\,{\textrm{mm}}$
is conducted to verify the numerical methods. The rationale behind this parameter selection will be systematically elucidated in the subsequent section. In this case, growth stagnation of the perturbation at DI is expected by the theory proposed in § 2. Comparison of the perturbation developments at UI and DI between experiment and computation is provided in figure 6. After UI and DI are both accelerated by the shock waves, their amplitudes begin to vary and the shocked AI remains flat in the observation region (201
 $\unicode {x03BC}$
s). Because only the perturbation developments at UI and DI are considered in this work, the moving AI are removed in the following schlieren images. From 381 to 581
 $\unicode {x03BC}$
s, the perturbation amplitude at DI grows significantly. However, after 581
 $\unicode {x03BC}$
s, the perturbation amplitude of DI is almost unchanged. The results show that growth stagnation of the amplitude at DI is realised. The morphologies of both UI and DI in the numerical simulation are consistent with their experimental counterparts, which qualitatively validates the numerical methods. Moreover, the density contours from the computation are given in figure 6 to clearly demonstrate the reverberating waves in the shocked dual layer. In numerical simulation, the RW
 $_0$
and RW
 $_1$
moving towards AI can be observed (201
 $\unicode {x03BC}$
s), and then the CW
 $_1$
(CW
 $_2$
) are formed by the RW
 $_0$
(RW
 $_1$
) reflecting from AI (381
 $\unicode {x03BC}$
s). When UI and DI are both accelerated by the CW
 $_1$
and CW
 $_2$
, only the reflected rarefaction waves RW
 $_4$
can be observed (581
 $\unicode {x03BC}$
s). In the late stage, there are no obvious reverberating waves in the flow field (821
 $\unicode {x03BC}$
s). We emphasise two experimental constraints: first, the small amplitude variation of UI cannot be precisely captured due to the limited spatial resolution of the schlieren image (approximately 0.27 mm); second, the progressive contrast loss of DI during the evolution, attributable to the molecular mixing, makes it difficult to observe DI clearly at the late stages. As a result, only one experiment in this work is conducted to realise the growth stagnation of perturbation at DI, and simultaneously to verify the numerical methods. In the following, extensive numerical simulations will be performed to validate the model.
Comparison between the experimental schlieren (top) and numerical schlieren (middle) images, and density contour images (bottom) from the computation for case 10-57.2. Numbers in the top panels denote time in
 $\unicode {x03BC}$
s.

Comparison of the amplitude variation of UI and DI for case 10-57.2 between experimental and the numerical results. Code validation is also conducted here based on four kinds of mesh sizes. Symbols (Lines) represent experimental (numerical) results.

The temporal amplitudes of UI and DI are extracted from the experimental images for code validation and grid convergence evaluation, as shown in figure 7. In the simulations, the nodes with a volume fraction of SF
 $_6$
45
 $\%$
are chosen as AI and UI, and the nodes with a volume fraction of helium 41.7
 $\%$
are chosen as DI. These threshold values are determined by averaging the value fractions of the specific gases at both sides of the interface. Four different initial mesh sizes of 0.40, 0.20, 0.10 and 0.05 mm are examined in numerical simulations. As shown in figure 7, the interface amplitudes converge and agree well with the experimental results when the mesh size is reduced to 0.10 and 0.05 mm. To save the computational cost but ensure accuracy, the initial mesh size of 0.10 mm is adopted in this work.
4. Result and discussion
According to the theoretical models in § 2 and the 1-D parameters in § 3, the relationships between
 $W_0$
and
 $L_0$
under conditions
 $\lambda =40\,{\textrm{mm}}$
,
 $a_{1+}=0\,{\textrm{mm}}$
and
 $ka_{2-}=0.1$
, are established to realise perturbation growth stagnation at either UI or DI, as visualised in figure 8. These two lines are defined as the freeze lines in this work, and freezing perturbation can be realised at either UI or DI when the (
 $W_0$
,
 $L_0$
) coordinate locates at these two characteristic curves. There are no intersection points between the two freeze lines, which indicates that the concurrent perturbation growth stagnation at both UI and DI is theoretically unattainable. These two curves distinguish the five different manipulation possibilities of the perturbation growth at UI and DI, as demonstrated in figure 3. To verify the model, numerical simulations are carried out extensively to realise different manipulation possibilities. According to figure 8, five cases with the same
 $W_0$
but different
 $L_0$
are first chosen to realise different possibilities at UI and DI. Subsequently, six additional cases with independent
 $W_0$
–
 $L_0$
combinations are designed to validate the model’s predictive capability for achieving growth stagnation at a shocked dual layer. In the following, the numerical cases are named
 $W_0$
–
 $L_0$
, as shown in figure 8.
Distribution of the manipulation possibilities of the perturbation growth at UI and DI in (
 $W_0$
,
 $L_0$
) domain. Triangle and square points represent the experiment and computations designed specifically, respectively. The roman numerals I–V refer to the five manipulation possibilities, as schematically shown in figure 3, and the perturbation growth stagnation is achieved at UI (II) and DI (IV), respectively.

4.1. Perturbation growths for successive interfaces with the same
 $W_0$
but different
$L_0$


The numerical simulations are carried out to validate the predictive ability of the model (2.5) in determining the different possibilities of the perturbation growth at both UI and DI. The numerical schlieren images of the shocked dual layers in five cases sharing identical
 $W_0=10\,{\textrm{mm}}$
but varying
 $L_0$
are shown in figure 9. These five cases correspond to the five different possibilities described in figure 8. The baseline case (labelled 10) establishes a reference configuration without AI and maintains the other parameters equivalent to the cases named 10-
 $L_0$
. The amplitude growth rate of the perturbation at DI exhibits great diversity among different cases, which qualitatively demonstrates that the perturbation of a shocked dual layer can be manipulated simply by changing the distance between the interfaces. Although the perturbation amplitude of UI is comparatively small, the slight trend that the UI amplitude grows in the opposite phase to the DI amplitude as
 $L_0$
increases can be observed.
Schlieren images of the shock-induced dual-layer evolution for different numerical cases with the same
 $W_0=10\,{\textrm{mm}}$
but different
 $L_0$
. Numbers in the lower left corner of the schlieren images denote time in
 $\unicode {x03BC}$
s. The symbols have the same meaning as those in figure 6.

Figure 10 illustrates the temporal evolution of DI and UI amplitudes, comparing numerical results with analytical predictions from model (2.5). Following the definition established in § 2, the initial DI amplitude (
 $a_{2-}$
) is defined as positive and thereby the initial perturbation growth phase is negative. After the CW
 $_1$
impact, as
 $L_0$
increases, the phase of perturbation at UI experiences a transition from negative to positive. Specifically, for case 10-26.6, growth stagnation is realised at UI. After the CW
 $_2$
impact, the reduced amplitude growth rates of DI in cases 10-16, 10-26.6, and 10-42 are compared with the counterpart in baseline case 10, and the amplitude of DI in these three cases develops more slowly as
 $L_0$
increases. Notably, case 10-57.2 exhibits near-stagnant DI amplitude variation, whereas case 10-72 demonstrates slight DI amplitude reduction. To sum up, different manipulation possibilities illustrated in figure 3 can be achieved by fixing
 $W_0$
but varying
 $L_0$
. Note that the UI is initially flat in these cases, the effect of the initial UI amplitude on the perturbation growth of DI is discussed in Appendix B.
Comparison of the amplitudes of UI (a) and DI (b) obtained from numerical and theoretical results in cases with fixed
 $W_0=10\,{\textrm{mm}}$
. Here, the initial time is the moment when the transmitted shock TS
 $_1$
interacts with DI.

The lines in figure 10 represent the theoretical predictions of the perturbation amplitude by models (2.1)–(2.5) after the reverberating waves impact the two interfaces. An exception occurs in case 10-72, where the pre-CW
 $_1$
DI amplitude violates the small amplitude hypothesis (
 $ka_{\textrm {2C}}=-0.53$
). Therefore, for case 10-72, the amplitude growth rate of DI (
 $\dot {a}_{2}$
) in the model (2.5) needs to be revised as
 \begin{equation} \dot {a}_{2}=\dot {a}_{21}+R\cdot \dot {a}_{\textrm {2C}}, \end{equation}
where
 $R=1/(1+(ka_{\textrm {2C}}/3)^{(4/3)})$
is the reduction factor proposed by Dimonte & Ramaprabhu (Reference Dimonte and Ramaprabhu2010). In figure 10, the amplitude variations of UI and DI for all cases generally coincide well with the predictions by the model in the early stage of the evolution of the interfaces impacted by the CW
 $_1$
. This agreement validates the predictive capacity of model (2.5) under linear growth conditions. The gradually emerging deviation between the predictions and numerical simulations in figure 10(b) is caused by the nonlinear growth of the DI amplitude, since model (2.5) only considers the linear growth of the DI and UI amplitudes.
4.2. Growth stagnation of successive interfaces with different distances
In this subsection, numerical simulations are carried out to validate the model (2.5) in predicting the growth stagnation conditions at either UI or DI. According to figure 8, we extend the investigation beyond the previously analysed cases 10-26.6 and 1057.2 to incorporate four configurations: two configurations (cases 5-60 and 15-56) targeting DI amplitude stagnation and two configurations (cases 5-28.9 and 15-23.4) for the realisation of growth stagnation at UI. The numerical schlieren images for these four cases are shown in figure 11. Qualitatively, from the last two images in cases 5-60 and 15-56, the amplitude variation of DI almost stagnates, and in cases 5-28.9 and 15-23.4, the amplitude change of UI cannot be clearly observed, but the DI amplitude grows significantly.
Numerical schlieren images of the shock-accelerated dual-layer evolution for different cases designed to realise individual stagnation of amplitude at UI or DI. Numbers in the lower left corner of the schlieren images denote time in
 $\unicode {x03BC}$
s. The symbols have the same meaning as those in figure 9.

Numerical verification of the model (2.5) in predicting the growth stagnation conditions at UI (a) and at DI (b).

Time variations of UI and DI amplitudes are given in figure 12, together with the numerical results from case 10 for comparison. The quantitative data reveal that the amplitude growth stagnation is realised at either UI or DI under the given initial conditions. The lines in figure 12 represent the linear growth of the interface amplitude predicted by (2.5), which coincide well with the numerical results. To sum up, the model (2.5) can well predict the conditions of growth stagnation at either DI or UI when the dual layer has different
 $L_0$
and
 $W_0$
.
5. Conclusions
The modulation of perturbation growth at successive heavy-light interfaces in a shock-accelerated dual layer holds critical importance for mitigating hydrodynamic instabilities in ICF. Unlike single-layer systems, dual-layer configurations introduce a complex reverberating wave dynamics that significantly influences interface evolution. This work systematically investigates these interactions, revealing that reflected compression waves, propagating co-directionally with the incident shock, enable the targeted manipulation of perturbation growth at the two successive heavy-light interfaces. Then, we develop an analytical model integrating both wave-reverberation and interface-coupling effects to quantify linear growth rates at the two interfaces. For configurations with only an initially perturbed downstream interface, the model identifies five distinct perturbation growth regimes. Crucially, these regimes can be selectively controlled by changing the initial distances between the interfaces of the layer, offering flexibility in instability manipulation for a dual-layer relevant to classical ICF capsule.
The model further quantifies the parametric thresholds required for growth stagnation at either an upstream or downstream heavy-light interface. To validate these theoretical predictions, both shock-tube experiments and numerical simulations are carried out. The results show that the five different manipulation possibilities of the perturbation growth are all realised under the initial parameter conditions designed by the model. Specifically, growth stagnation of the perturbation at the upstream or downstream heavy-light interface is also realised for different initial conditions designed based on the model.
These findings advance the mechanistic understanding of hydrodynamic instability control in shock-accelerated multi-interface systems, with direct implications for ICF capsule optimisation. While this study resolves a single-mode perturbation dynamics, future investigations will address the modulation of multi-mode perturbations in shocked multi-interface systems.
Funding
This work was supported by the National Natural Science Foundation of China (Nos. 12388101, 12372281, 12102425 and 123B2034), the Strategic Priority Research Program of Chinese Academy of Sciences (No. XDB0620201) and Youth Innovation Promotion Association CAS.
Declaration of interests
The authors report no conflict of interest.
Appendix A. Derivations of the model and parameters
In this appendix, the detailed derivations of (2.1)–(2.5) and the relevant parameters are presented. After the incident shock interacts with AI, TS is generated and moves to UI, as shown in figure 2(a). Then the flat UI is accelerated and TS
 $_1$
is generated in fluid 3, as shown in figure 2(b). The perturbation at DI is first compressed by TS
 $_1$
, and its amplitude can be expressed as
 \begin{equation} a_{2+}=a_{2-} \big(1-\Delta u_2/v^{{TS}}_1 \big), \end{equation}
where
 $a_{2-}$
(
 $a_{2+}$
) is the DI amplitude before (after) it is accelerated by TS
 $_1$
;
 $\Delta u_2$
and
 $v^{{TS}}_1$
are the jump velocity of DI induced by TS
 $_1$
and velocity of TS
 $_1$
, respectively. After DI is accelerated by TS
 $_1$
, the perturbed rarefaction waves RW
 $_1$
are reflected, as shown in figure 2(c). When the RW
 $_1$
form, their amplitudes are
 \begin{equation} \begin{cases} a_{{{Rf1}}}^0=a_{2-} \left(1+(c_1-\Delta u_1)/v^{{{TS}}}_1 \right),\\[8pt] a_{{{Rt1}}}^0=a_{2-}\left(1+(c_2-\Delta u_2)/v^{{{TS}}}_1\right),\\[8pt] a_{{{R1}}}^0= \big(a_{{Rf1}}^0+a_{{Rt1}}^{0} \big)/2. \end{cases} \end{equation}
Here,
 $a_{{{Rf1}}}^0$
,
 $a_{{{Rt1}}}^0$
and
 $a_{{{R1}}}^0$
are the initial amplitude of the RW
 $_1$
head, the initial amplitude of the RW
 $_1$
tail and the average amplitude of the RW
 $_1$
, respectively;
 $c_1$
(
 $c_2$
) is the sound speed of the fluid 2 between UI and the RW
 $_1$
head (between DI and the RW
 $_1$
tail); and
 $\Delta u_1$
is the jump velocity of UI induced by TS. According to the work of Velikovich & Phillips (Reference Velikovich and Phillips1996), as the RW
 $_1$
move, the amplitude of the RW
 $_1$
head remains as
 $a_{{{Rf1}}}^0$
, but the amplitude of the RW
 $_1$
tail varies. When the RW
 $_1$
interact with UI, the amplitude of the RW
 $_1$
tail can be expressed as
 \begin{equation} \begin{cases} a_{{{Rt1}}}^-=a_{{\textrm {Rt1}}}^0+ka_{{{Rt1}}}^0c_1U_{{R1}},\\[8pt] U_{{R1}}=\sqrt {(\gamma _{20}+1)(1-c_2/c_1)(\gamma _{20}-1)}, \end{cases} \end{equation}
where
 $U_{{R1}}$
is a parameter for calculating the amplitude growth rate of the RW
 $_1$
tail,
 $\gamma _{20}$
is the adiabatic exponent of the fluid 2 and
 $k$
is perturbation wavelength. Accordingly, the average amplitude of the RW
 $_1$
arriving at UI is
 $a_{{{R1}}}^-=(a_{{{Rf1}}}^0+a_{{{Rt1}}}^-)/2$
.
After the RW
 $_1$
pass through the flat UI, rarefaction waves RW
 $_2$
are generated and travel to DI, as shown in figure 2(d). We define the time of the RW
 $_1$
impacting UI as
 $t_1$
, which can be calculated as
 $t_1=W_0(1-\Delta u_1/v_1^{{TS}})/c_1$
, where
 $W_0$
is the initial distance between UI and DI before IS interacts with the dual layer. At
 $t=t_1$
, the RW
 $_1$
stretch the UI and introduce the perturbation to the initially flat UI. According the model proposed by Chen et al. (Reference Chen, Wang, Zhai and Luo2023a
, Reference Chen, Wang, Zhai and Luo2024b
), the UI amplitude after it is just impacted by the RW
 $_1$
can be expressed as
 \begin{equation} a_{{1R}}^+=-a_{{{R1}}}^-\frac {\Delta u_{{R1}}}{c_1+c_2+\Delta u_1-\Delta u_2}. \end{equation}
After the RW
 $_1$
leave UI, interface coupling begins to affect UI and the perturbation growth at UI will be quantified later. When the RW
 $_2$
are just generated, their amplitudes can be expressed as
 \begin{equation} \begin{cases} a_{{\textit{Rf}\,2}}^0=-a_{{\textit{Rf }1}}^0 \displaystyle\frac {c_2+\Delta u_2-\Delta u_1}{c_1},\\[12pt] a_{{\textit{Rt}2}}^0=-a_{{\textit {Rt}1}}^- \displaystyle\frac {c_3+\Delta u_{{R1}}}{c_2},\\[12pt] a_{{{R2}}}^0= \big(a_{\textit{Rf }2}^0+a_{\textit{Rt}2}^0 \big)/2, \end{cases} \end{equation}
where
 $a_{{{Rf2}}}^0$
,
 $a_{{{Rt2}}}^0$
and
 $a_{{{R2}}}^0$
are the initial amplitude of the RW
 $_2$
head, amplitude of the RW
 $_2$
tail and average amplitude of the RW
 $_2$
, respectively;
 $c_3$
is the sound speed of fluid 2 between the RW
 $_2$
tail and UI; and
 $\Delta u_{{R1}}$
is the jump velocity of the UI induced by the RW
 $_1$
. Because the RW
 $_2$
intensity is weak and the duration of the RW
 $_2$
moving in fluid 2 is short, the RW
 $_2$
amplitudes are assumed to be constant before they encounter the DI.
Before the RW
 $_2$
encounter with DI, the amplitude of DI varies from
 $a_{2+}$
in (A1), and needs to be determined. Note that there is a start-up process of the perturbation at the shocked DI (Li et al. Reference Li, Chen, Zhai and Luo2024), and the start-up time
 $\tau$
can be expressed as
 \begin{equation} \tau = \frac {1}{k} \left(\frac {2-2A_{2+}}{\Delta u_2+c_2+c_1-\Delta u_1}+\frac {1+A_{2+}}{v^{{\textit{TS}}}_2-\Delta u_2} \right), \end{equation}
where
 $v^{{\textit{TS}}}_2$
is the velocity of TS
 $_2$
;
 $A_{2+}=({\rho _{3+}-\rho _{2+}}/{\rho _{3+}+\rho _{2+}})$
is the Atwood number of the DI after being impacted by TS
 $_1$
; and
 $\rho _{2+}$
and
 $\rho _{3+}$
are the densities of fluids 2 and 3 in the vicinity of DI after being impacted by TS
 $_1$
, respectively. In this work, the moment when the RW
 $_2$
arrives at DI is defined as
 $t_2$
, which can be expressed as
 $t_2=t_1+W_0(1-\Delta u_1/v_1^{{TS}})[1+(\Delta u_2-\Delta u_1)/c_1]/c_2$
. If
 $t_2\leqslant \tau$
, when the RW
 $_2$
interact with DI, the amplitude of DI (
 $a_{{2R}}^-$
) can be quantified as
 \begin{equation} \begin{cases} a_{{2R}}^-=\int _{0}^{t_2}\dot {a}_{20}{\textrm {d}}t,\\[8pt] \dot {a}_{20}= \displaystyle\frac {2\dot {a}_2^{\textrm {l}}}{(1-A_{2+})\coth [k(\Delta u_2+c_2+c_1-\Delta u_1)t/2]+(1+A_{2+})\coth [k(v^{{{TS}}}_2-\Delta u_2)t]}, \end{cases} \end{equation}
where
 $\dot {a}_2^{\textrm {l}}=k\Delta u_2(a_{2+}A_{2+}+a_{2-}A_{2-})/2$
is the linear growth rate of DI amplitude (
 $a_2$
) induced by TS
 $_1$
, and is predicted by the VMG model (Vandenboomgaerde, Mügler & Gauthier Reference Vandenboomgaerde, Mügler and Gauthier1998),
 $A_{2-}=({\rho _{3-}-\rho _{2-}})/({\rho _{3-}+\rho _{2-}})$
is the Atwood number of DI before being impacted by TS
 $_1$
,
 $\rho _{2-}$
and
 $\rho _{3-}$
being the densities of the fluids 2 and 3 in the vicinity of DI before being impacted by TS
 $_1$
, respectively. When
 $t_2\gt \tau$
,
 $a_{{2R}}^-$
can be expressed
 \begin{equation} \begin{cases} a_{{2R}}^-=\int _{0}^{\tau }\dot {a}_{20}{\textrm {d}}t+(t_2-\tau )\dot {a}_2^{\textrm {l}},\\[8pt] \dot {a}_{20}= \displaystyle\frac {2\dot {a}_2^{\textrm {l}}}{(1-A_{2+})\coth [k(\Delta u_2+c_2+c_1-\Delta u_1)t/2]+(1+A_{2+})\coth [k(v^{{{TS}}}_2-\Delta u_2)t]}. \end{cases} \end{equation}
After the RW
 $_2$
pass by the interface, DI is stretched and its amplitude can be quantified as
 \begin{equation} a_{{2R}}^{+} = a_{{2R}}^{-} + (a_{{2R}}^{-} - a_{{{R2}}}^0) \displaystyle\frac {\Delta u_{{R2}}}{c_2+c_3+\Delta u_1+\Delta u_{{R1}}-\Delta u_2}. \end{equation}
Schematic showing the configuration analysed using linear stability theory for the system of three different fluids, where
 $\rho _1$
,
 $\rho _2$
and
 $\rho _3$
are the densities of the three fluids, and
 $\phi _1$
,
 $\phi _2$
and
 $\phi _3$
are the velocity potentials;
 $a_1$
and
 $a_2$
are initial interface amplitudes;
 $g_1$
and
 $g_2$
are the accelerations of the two interfaces and
 $W$
is the initial distance between the two interfaces.

The perturbation growth at UI will be affected by interface coupling after the RW
 $_1$
pass through UI, and the perturbation growth at DI will be affected by interface coupling after the RW
 $_2$
pass through DI. Considering three different incompressible and irrotational fluids separated by two interfaces with a distance
 $W$
, as shown in figure 13, Liang & Luo (Reference Liang and Luo2022) proposed the LL-model to quantify the interface coupling between the two interfaces. The equations governing the growth of infinitesimal disturbances at the interfaces as the boundaries of the layer are
 \begin{equation} \nabla ^2\phi =0, \end{equation}
where
 $\phi$
is the velocity potential of the fluid, and the kinematic and pressure conditions at the interfaces are
 \begin{equation} \frac {{\partial } \eta }{{\partial } {t}}-\frac {{\partial } \phi }{{\partial }{y}}=0, \end{equation}
 \begin{equation} \rho \frac {{\partial } \phi }{{\partial }{t}}-\rho g\eta +p=p_0. \end{equation}
Here,
 $p$
is the pressure,
 $g$
is the acceleration,
 $\eta$
is the perturbation shape and
 $p_0$
is a constant, which equals the pressure at the interface in the rest state. The system contains two successive interfaces with perturbations
 $\eta _1$
and
 $\eta _2$
separating fluids of densities
 $\rho _1$
,
 $\rho _2$
and
 $\rho _3$
, and velocity potentials
 $\phi _1$
,
 $\phi _2$
and
 $\phi _3$
, as sketched in figure 13. The periodic perturbations set at the interfaces are of the form
 \begin{equation} \begin{cases} \eta _1=a_1(t)\cos (kx),\\[2pt] \eta _2=a_2(t)\cos (kx), \end{cases} \end{equation}
where
 $a_1(t)$
and
 $a_2(t)$
are the amplitudes of the first interface and the second interface, respectively. The following velocity potentials are required in the three fluids:
 \begin{equation} \begin{cases} \phi _1=b_1(t)e^{-k(y-W/2)}\cos (kx), \\[8pt] \phi _2=- \left[\displaystyle\frac {b_1+b_2}{2}\displaystyle\frac {\sinh (ky)}{\cosh (kW/2)}+\displaystyle\frac {b_1-b_2}{2}\displaystyle\frac {\cosh (ky)}{\sinh (kW/2)} \right]\cos (kx), \\[12pt] \phi _3=-b_2(t)e^{k(y+W/2)}\cos (kx), \end{cases} \end{equation}
where
 $b_1$
and
 $b_2$
are the functions of time in the velocity potentials. Substituting (A13) and (A14) into (A10)–(A12), a pair of ordinary differential equations, i.e. the LL-model (Liang & Luo Reference Liang and Luo2022), is yielded for
 $a_1$
and
 $a_2$
,
 \begin{equation} \begin{cases} \displaystyle\frac {{\textrm {d}}^{2}a_1}{{\textrm {d}}t^{2}}[\rho _1+\rho _2\tanh (kW/2)]+ \displaystyle\frac {{\textrm {d}}^{2}a_2}{{\textrm {d}}t^{2}}[\rho _3+\rho _2\tanh (kW/2)]=kg[(\rho _2-\rho _1)a_1 \\[8pt] \quad+(\rho _3-\rho _2)a_2], \\[8pt] \displaystyle\frac {{\textrm {d}}^{2}a_1}{{\textrm {d}}t^{2}}[\rho _1+\rho _2\coth (kW/2)]- \displaystyle\frac {{\textrm {d}}^{2}a_2}{{\textrm {d}}t^{2}}[\rho _3+\rho _2\coth (kW/2)]=kg[(\rho _2-\rho _1)a_1 \\[8pt] \quad -(\rho _3-\rho _2)a_2], \end{cases} \end{equation}
In the previous work (Liang & Luo Reference Liang and Luo2022, Reference Liang and Luo2023a
), the accelerations
 $g$
of two successive interfaces were considered the same to quantify the interface coupling. However, as mentioned in our previous work (Chen et al. Reference Chen, Wang, Zhai and Luo2024b
), the accelerations of the two interfaces are different and thus
 $g_1$
and
 $g_2$
are used to represent the different accelerations of the first and second interfaces, respectively. Based on
 $g_1$
and
 $g_2$
, (A13) and (A14) are substituted into (A10)–(A12) again, and then the LL-model can be rewritten as
 \begin{equation} \begin{cases} \begin{aligned} &\frac {{\textrm {d}}^{2}a_1}{{\textrm {d}}t^{2}}[\rho _1+\rho _2\tanh (kW/2)]+\frac {{\textrm {d}}^{2}a_2}{{\textrm {d}}t^{2}}[\rho _3+\rho _2\tanh (kW/2)]\\[6pt] &=k[(\rho _2-\rho _1)a_1g_1+(\rho _3-\rho _2)a_2g_2], \\[6pt] &\frac {{\textrm {d}}^{2}a_1}{{\textrm {d}}t^{2}}[\rho _1+\rho _2\coth (kW/2)]-\frac {{\textrm {d}}^{2}a_2}{{\textrm {d}}t^{2}}[\rho _3+\rho _2\coth (kW/2)]\\[6pt] &=k[(\rho _2-\rho _1)a_1g_1-(\rho _3-\rho _2)a_2g_2]. \end{aligned} \end{cases} \end{equation}
For UI that has already been accelerated by the RW
 $_1$
and DI that has been impacted by the RW
 $_2$
, as shown in figures 2(a)–2(d), there are four acceleration processes needed to be considered: the jump velocities of UI induced by TS and the RW
 $_1$
(
 $\Delta u_1$
and
 $\Delta u_{{R1}}$
), and the jump velocity of DI induced by TS
 $_1$
and the RW
 $_2$
(
 $\Delta u_2$
and
 $\Delta u_{{R2}}$
). Due to the very short duration of the waves interacting with the interfaces, the Dirac
 $\delta$
-function is generally used to model the shock interacting with a gas layer (Jacobs et al. Reference Jacobs, Jenkins, Klein and Benjamin1995; Liang & Luo Reference Liang and Luo2023a
; Chen et al. Reference Chen, Wang, Zhai and Luo2024b
). Accordingly, the accelerations
 $g_1$
and
 $g_2$
can be expressed as
 \begin{equation} \begin{cases} g_1=\Delta u_1\delta (t+t_0)+\Delta u_{{R1}}\delta (t-t_1), \\[8pt] g_2=\Delta u_2\delta t+\Delta u_{{R2}}\delta (t-t_2), \end{cases} \end{equation}
where
 $t_0=W_0/v_1^{{TS}}$
is the time difference between TS accelerating UI and TS
 $_1$
impacting DI. Substituting (A17) into (A16) and integrating the equations, a new model for predicting the linear growth rates of the perturbations at UI hit by the RW
 $_1$
(
 $\dot {a}_{11}$
) and DI stretched by the RW
 $_2$
(
 $\dot {a}_{21}$
) is established
 \begin{equation} \begin{aligned} &\dot {a}_{11}[\rho _1+\rho _2\tanh (kW/2)]+\dot {a}_{21}[\rho _3+\rho _2\tanh (kW/2)]\\[8pt] & \quad=k(\rho _2-\rho _1)(a_{1+}\Delta u_1+a_{{1R}}^+\Delta u_{{R1}})+k(\rho _3-\rho _2)(a_{20}\Delta u_2+a_{{2R}}^+\Delta u_{{R2}}), \end{aligned} \end{equation}
 \begin{equation} \begin{aligned} &\dot {a}_{11}[\rho _1+\rho _2\coth (kW/2)]-\dot {a}_{21}[\rho _3+\rho _2\coth (kW/2)]\\[8pt] & \quad =k(\rho _2-\rho _1)(a_{1+}\Delta u_1+a_{{1R}}^+\Delta u_{{R1}})-k(\rho _3-\rho _2)(a_{20}\Delta u_2+a_{{2R}}^+\Delta u_{{R2}}). \end{aligned} \end{equation}
Equations (A18) and (A19), i.e. (2.1) and (2.2) in § 2, constitute the modified LL-model. According to the impulsive model (Richtmyer Reference Richtmyer1960) and the MB model (Meyer & Blewett Reference Meyer and Blewett1972),
 $a_{1+}$
is the amplitude of UI just after being impacted by TS and
 $a_{20}=(a_{2-}+a_{2+})/2$
is the average amplitude of the shocked and unshocked DI in (A18)–(A19). The parameters
 $a_{{1R}}^+$
and
 $a_{{2R}}^+$
, which have been expressed in (A4) and (A9), are the amplitudes of UI just being accelerated by the RW
 $_1$
and of DI just being impacted by the RW
 $_2$
, respectively. Here, for the shocked system,
 $\rho _1$
,
 $\rho _2$
and
 $\rho _3$
are calculated as the densities of fluid 1, fluid 2 and fluid 3, respectively, after the interaction of the RW
 $_2$
with DI;
 $W$
is the distance between UI and DI after TS
 $_1$
collides with DI, and can be expressed as
 $W=W_0(1-\Delta u_1/v_1^{{TS}})$
.
After RW
 $_2$
interact with DI, the two compression waves (CW
 $_1$
and CW
 $_2$
) reflected from AI move downstream and impact UI and DI, as shown in figures 2(e)–2(f). As discussed in § 2, based on the modified-LL model, the perturbation growth rates at UI and DI induced by CW
 $_1$
, CW
 $_2$
and the subsequent reverberating waves can be calculated by
 \begin{equation} \begin{aligned} &\dot {a}_{\textrm {1C}}[\rho _{\textrm {1C}}+\rho _{\textrm {2C}}\tanh (kW_{\textrm {C}}/2)]+\dot {a}_{\textrm {2C}}[\rho _{\textrm {3C}}+\rho _{\textrm {2C}}\tanh (kW_{\textrm {C}}/2)]\\[8pt] & \quad=k(\rho _{\textrm {2C}}-\rho _{\textrm {1C}})a_{\textrm {1C}}\Delta u_{\textrm {1C}}+k(\rho _{\textrm {3C}}-\rho _{\textrm {2C}})a_{\textrm {2C}}\Delta u_{\textrm {2C}}, \end{aligned} \end{equation}
 \begin{equation} \begin{aligned} &\dot {a}_{\textrm {1C}}[\rho _{\textrm {1C}}+\rho _{\textrm {2C}}\coth (kW_{\textrm {C}}/2)]-\dot {a}_{\textrm {2C}}[\rho _{\textrm {3C}}+\rho _{\textrm {2C}}\coth (kW_{\textrm {C}}/2)]\\[8pt] & \quad=k(\rho _{\textrm {2C}}-\rho _{\textrm {1C}})a_{\textrm {1C}}\Delta u_{\textrm {1C}}-k(\rho _{\textrm {3C}}-\rho _{\textrm {2C}})a_{\textrm {2C}}\Delta u_{\textrm {2C}}. \end{aligned} \end{equation}
Here,
 $\Delta u_{\textrm {1C}}$
and
 $\Delta u_{\textrm {2C}}$
are the sum of jump velocities of UI and DI accelerated by the reverberating waves in figures 2(f)–2(j), respectively;
 $\rho _{\textrm {1C}}$
,
 $\rho _{\textrm {2C}}$
and
 $\rho _{\textrm {3C}}$
are the densities of fluid 1, fluid 2 and fluid 3 after the RW
 $_8$
interact with DI;
 $W_{\textrm {C}}$
is the distance between UI and DI after the CW
 $_1$
accelerate DI, calculated as
 $W_{\textrm {C}}=W[1+(\Delta u_2-\Delta u_1)/c_1][1+(\Delta u_2-\Delta u_1-\Delta u_{{R1}})/c_2][1-(u_{\textrm {C1}}-\Delta u_2-\Delta u_{{R2}})/c_4]$
, where
 $u_{\textrm {C1}}$
is the velocity of UI after being impacted by the CW
 $_1$
and
 $c_4$
is the sound speed of the fluid 2 after the RW
 $_2$
passes through DI. After defining
 $t_{\textrm {C1}}$
and
 $t_{\textrm {C2}}$
as the times of UI and DI being accelerated by CW
 $_1$
, respectively, the amplitudes of UI and DI just prior to the CW
 $_1$
acceleration can be obtained as
 \begin{equation} \begin{cases} a_{\textrm {1C}}=a_{{1R}}^++\dot {a}_{11}(t_{\textrm {C1}}-t_1), \\[8pt] a_{\textrm {2C}}=a_{{2R}}^++\dot {a}_{21}(t_{\textrm {C2}}-t_2). \end{cases} \end{equation}
According to (A1)–(A22), (2.5) can be theoretically calculated.
Appendix B. Effect of UI amplitude on the perturbation growth at DI
While prior cases in this work assume an unperturbed upstream UI, the influence of UI amplitude on the perturbation evolution of the downstream DI remains unexamined. To address this gap, we conduct two additional numerical simulations with initial scaled UI amplitudes
 $ka_{1-}=0.1$
and
 $ka_{1-}=-0.1$
, probing their role in modulating amplitude evolution at DI. These cases retain the DI’s initial scaled amplitude
 $ka_{2-}=0.1$
(identical to previous configurations) and replicate all other parameters from case 10-57.2, where DI amplitude stagnation was observed. A comparative analysis of amplitude evolution across perturbed UI cases and the baseline (case 10-57.2) is presented in figure 14.
Comparison of the amplitudes of UI (a) and DI (b) obtained from the cases with
 $ka_{1-}=-0.1$
,
 $ka_{1-}=0$
and
 $ka_{1-}=0.1$
. Symbols (lines) represent numerical (theoretical) results.

Theoretically, the shocked UI amplitude
 $a_{1+}=a_{1-}(1-\Delta u_1/v_0^{{TS}})$
, where
 $v_0^{{TS}}$
is the TS velocity, and the amplitude TS
 $_1$
is derived by the model proposed by Ishizaki & Nishihara (Reference Ishizaki and Nishihara1997). By integrating models in Appendix A, we can predict the amplitude evolution of UI and DI when UI is initially perturbed. These theoretical predictions, represented by solid lines in figure 14, are validated against numerical results, denoted by symbols. Figure 14(a) reveals that, prior to the compression waves’ arrival, the UI amplitude growth is amplified for perturbed cases (
 $ka_{1-}=\pm 0.1$
) compared with the unperturbed baseline (
 $ka_{1-}=0$
). Notably, for
 $ka_{1-}=0.1$
(
 $ka_{1-}=-0.1$
), the amplitude evolves into the negative (positive) phase, which is similar to the behaviour of a shocked single UI. After the compression waves interact with DI, the UI growth reverses direction in all cases, with theoretical predictions aligning closely with numerical simulations.
As shown in figure 14(b), prior to the compression waves’ interaction, the DI amplitude grows negatively at comparable rate across all
 $ka_{1-}$
cases. After compression waves interact with DI, however, the DI’s evolution diverges. For
 $ka_{1-}=0.1$
, the amplitude reverses direction, while for
 $ka_{1-}=-0.1$
, growth persists in the negative direction but at a diminished rate. From figures 14(a) and 14(b), after compression waves perturb both interfaces, UI and DI amplitudes evolve synchronously in the same direction. This coupling suggests that initial UI perturbations significantly influence the DI’s evolution, potentially disrupting the amplitude ‘freeze out’ achievable with an initially flat UI. While theoretical predictions align with the UI evolution, discrepancies arise for DI when
 $ka_{1-}=\pm 0.1$
. These deviations likely stem from the model’s current omission of disturbed gas flow effects behind the perturbed transmitted shock on DI evolution, a mechanism requiring further investigation.