Introduction
Amnestic mild cognitive impairment (aMCI) is generally accepted to include prodromal Alzheimer's disease (AD), as studies suggest that the majority of MCI patients progress to AD (Petersen et al., Reference Petersen2001; Reference Petersen2010). Neuroimaging markers of MCI are clinically important to characterize such patients for early diagnosis and treatment. Single-volume proton magnetic resonance spectroscopy (1H MRS) is a non-invasive, convenient and rapid magnetic resonance imaging (MRI) technique that is sensitive to biologically relevant chemical changes in the brain. Prior studies have shown that levels of the neuronal integrity markers N-acetylaspartate (NAA) and NAA/Cr, as assessed by 1H MRS, are lower in AD patients compared to healthy elderly individuals, and that decreased NAA/Cr levels can predict future conversion from MCI to AD (Chao et al., Reference Chao2005; Metastasio et al., Reference Metastasio2006). Previous studies have investigated 1H MRS imaging of specific regions of the brain in patients with AD (Godbolt et al., Reference Godbolt2006; Jessen et al., Reference Jessen2009). In one study, decreased NAA levels were found in the cortical gray matter of individuals with AD, relative to control subjects (Adalsteinsson et al., Reference Adalsteinsson, Sullivan, Kleinhans, Spielman and Pfefferbaum2000). Another study showed that a reduced NAA/Cr ratio in the medial temporal lobe was correlated with low MMSE scores (Jessen et al., Reference Jessen2001).
Measurements of NAA/Cr and mI/Cr ratios, as determined by 1H MRS analysis, correlate with neuropsychological measures of cognitive function in patients with AD (Huang et al., Reference Huang2001). There is a region-specific association between neuropsychological performance and 1H MRS metabolite changes, depending on the cognitive domain being studied. For example, 1H MRS metabolite changes in patients with AD correlate with loss of verbal memory in the left medial temporal lobe and with language impairment and visuoconstructional abilities in the left parietotemporal cortex (Chantal et al., Reference Chantal, Braun, Bouchard, Labelle and Boulanger2004). The association between 1H MRS measurements and neuropsychological performance suggests that 1H MRS may be a sensitive clinical marker for disease progression in AD. Since patients with AD show higher levels of mI and lower levels of NAA than cognitively normal elderly individuals, the ratio of NAA/mI is the most diagnostically accurate 1H MRS measurement used to differentiate between patients with AD and normal subjects. In prior studies, NAA/mI ratios have distinguished clinically diagnosed AD patients from normal elderly individuals with a sensitivity of 57–90% and a specificity of 73–95% for different cohorts, using distinct 1H MRS acquisition parameters in specific regions of the brain (Kantarci et al., Reference Kantarci2002; Martinez-Bisbal et al., Reference Martinez-Bisbal, Arana, Marti-Bonmati, Mollá and Celda2004; Fernandez et al., Reference Fernandez2005; Zhu et al., Reference Zhu2006). Since definitive diagnosis of AD requires histopathological confirmation, the diagnostic value of NAA/mI should ideally be correlated with AD pathology.
Patients with AD and MCI show degeneration of brain tissue, especially in the PCG and the hippocampus.The hippocampus is an important structure within the medial temporal lobe. It typically demonstrates marked pathological changes with AD and has exhibited reductions in NAA in postmortem studies of AD brains. In addition, posterior cingulate hypometabolism is a severe metabolic lesion that has been observed in early stage AD (Nestor et al., Reference Nestor, Fryer, Smielewski and Hodges2003). Although posterior cingulate hypometabolism was originally interpreted as being a remote consequence of medial temporal lobe degeneration, recent volumetric MRI work has revealed that this area is also atrophic in incipient AD (Choo et al., Reference Choo2010; Pengas et al., Reference Pengas, Hodges, Watson and Nestor2010).
Finding a valid brain imaging biomarker before the AD stage is imperative for early intervention, and metabolic markers in the posterior cingulate gyri (PCG) and hippocampus are promising candidates. The current study used 1H MRS to investigate potential biomarkers of neuronal damage in AD and aMCI patients, as well as in normal control patients. Specifically, we assessed levels of N-acetylaspartate (NAA), choline compounds (Cho), myo-inositol (mI), and creatine (Cr) in the PCG and left and right hippocampi.
Methods
Participants and recruitment
We recruited 47 patients with AD, 32 patients with aMCI from the tertiary hospital of Shanghai Mental Health Center, Shanghai Jiao Tong University School of Medicine (Alzheimer's Disease and Related Disorders Center, ADRDC) and 56 cognitively normal elderly subjects from the Fenglin community of Shanghai Xu Hui district. Patients enrolled in the hospital via self-referral or referral from family or physician. The study was approved by the Institution's Ethical Committee and informed consent was obtained from all subjects and/or their legal guardians.
Probable AD was diagnosed according to the Diagnostic and Statistical Manual for Mental Disorders, 4th edition (DSM-IV) criteria and the National Institute of Neurological and Communicative Disorders and Stroke/Alzheimer's Disease and Related Disorder's Association (NINCDS/ADRDA) criteria.
Amnestic MCI was diagnosed based on the following criteria (Petersen et al., Reference Petersen2001): (1) memory complaint, preferably corroborated by a spouse or relative, (2) objective memory impairment, (3) normal general cognitive function, (4) intact activities of daily living, and (5) absence of dementia. We have amended the amnestic MCI diagnostic criteria of the Petersen MMSE cut-off score in order to be consistent with the low level of education in elderly Chinese people. Research by Katzman et al. (Reference Katzman1988) found that with the Chinese version of MMSE, AD subjects who had not been educated (NO ED) exhibited MMSE scores of <18, those with elementary school education exhibited MMSE scores of <21, and those with higher than middle school education exhibited MMSE scores of <25. In the present study, the aMCI analysis was carried out on NO ED subjects with MMSE cut-off scores of ≥18, elementary school educated subjects with MMSE cut-off scores of ≥21, and higher than middle school educated subject with MMSE cut-off scores of ≥25.
The cognitively normal elderly who formed the normal control (NC) group were independently functioning community dwellers with no neurological or psychiatric conditions.
All participants underwent a screening process that included a review of their medical history, physical and neurological examinations, laboratory tests, and MRI analysis. The clinical assessment of mild cognitive impairment or dementia included neuropsychological tests, as well as behavioral and psychiatric interviews conducted by the attending psychiatrist. AD patients recorded scores of < 4 on the Hachinski Ischemia Scale and showed no history of significant systemic or psychiatric conditions, or traumatic brain injuries that could compromise brain function. The neuropsychological battery which was used only to determine MCI subtype in the present study included: Wechsler Memory Scale (WMS) Verbal Associates immediate and 30-minute delayed test, Rey Auditory Verbal Learning and 30-minute Delayed Test, WMS-Digit Span, Category Naming Test-Animals, and Clock Drawing Test. We rated the MCI patients’ cognitive impairment in seven domains: memory, attention, language, visual-spatial, orientation, calculation and executive function according to the neuropsychological battery and MMSE. Based on the assessment, we retained aMCI subjects and excluded subjects with impairment in a single non-memory domain (single, non-memory domain MCI subtype) and impairment in two or more domains (multiple domains, slightly impaired MCI subtype). NC subjects had no history of cognitive decline, neurological disorders, or uncontrolled systemic medical disorders. All subjects were required to have fewer than two lacuna ischemia (of diameter < 1 cm), as revealed by MRI fluid-attenuated inversion recovery (FLAIR) sequence scanning.
MRS image acquisition
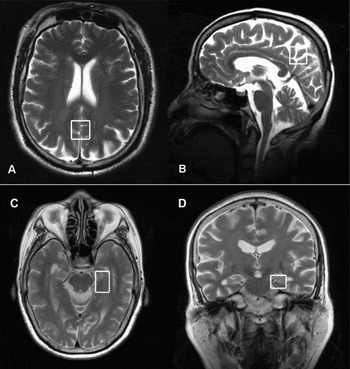
All MRS scans were performed on a 3.0-Tesla Signa HD MR system (General Electric Medical Systems, Milwaukee, WI, USA) using Point-Resolved Spectroscopy (PRESS) pulse sequence. T2-weighted images were obtained to localize 1H MRS voxels. Special attention was paid to the symmetric positioning of the patient's head. The parameters used were: echo time (ET) = 35 ms, repetition time (RT) = 1,500 ms, and acquisitions = 128. Typical voxel locations in the PCG and hippocampus are shown in Figure 1. The Prescan Algorithm of Proton Brain Exam (PROBE) automatically adjusted the transmitter and receiver gains and center frequencies. PRESS pulse sequence with automated shimming and water suppression and excellent reproducibility (Simmons et al., Reference Simmons, Smail, Moore and Williams1998) was used to obtain spectra from each voxel after the chemical shift selective (CHESS) water suppression with high signal to noise ratio and the identification of NAA, Cho, ml, and Cr peaks among the other metabolites. Volumes of interest (VOI) were placed in a uniform manner by the same investigator and included 8 cm3 (20 × 20 × 20 mm) of the PCG and 6.38 cm3 (25 × 17 × 15 mm) of the hippocampus. VOI of the PCG were identified on a mid-sagittal T2-weighted image, below the cingulate sulcus and above the parieto-occipital sulcus, which included the PCG and inferior precuneus bilaterally. VOI of the hippocampus included both grey and white matter, as well as the parahippocampal gyrus. MRS is quite stable for the PCG, but it is not stable for the temporal lobe or hippocampus. Spectral data from either the left or right hippocampus (but not both) were obtained in 91.4% of the subjects. Since no significant differences were found in the metabolite content between the left and right hippocampi, metabolite ratios were averaged across the left and right hippocampi for subjects with data available for both sides.
1H MR spectroscopy showing the location of the PCG volume of interest (VOI) on (A) an axial and (B) a mid-sagittal T2-weighted localizing image, and the hippocampal VOI on (C) an axial and (D) a coronal T2-weighted localizing image.

Data analysis
Demographic and clinical characteristics across the AD, aMCI, and control groups were assessed by analysis of variance (ANOVA) followed by least significant difference (LSD) post hoc tests. Differences between the groups in metabolite ratios relative to Cr (NAA/Cr, Cho/Cr, mI/Cr) and in the NAA/mI ratio were tested by means of a two-way repeated ANOVA, with each group as the between-subject factor. For aMCI and NC subjects, discriminant and ROC (Receiver Operating Characteristic) analyses were also performed.
Results
Demographic and clinical characteristics
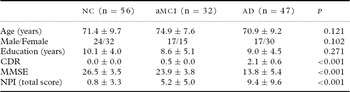
The demographic and clinical characteristics for AD, aMCI, and NC subjects are shown in Table 1. No differences between the groups were observed in age, gender, or level of education. As expected, group differences were observed in the Mini-Mental Status Exam (MMSE) and in the Clinical Dementia Rating (CDR) scores (P < 0.001). Specifically, AD subjects had significantly lower scores on both scales compared to aMCI or NC subjects, and aMCI subjects had significantly lower scores on both scales compared to NC subjects (P < 0.001). The Neuropsychiatric Inventory (NPI) was applied to every subject before 1H MRS scanning. Results revealed no detectable neuropsychiatric symptoms in 50 (89%), 8 (25%), and 8 (17%) subjects from the NC, aMCI, and AD groups, respectively. Anxiety was the most frequently displayed behavior in the aMCI group. Apathy was the most frequently displayed behavior in the AD group.
Demographic and clinical characteristics of subjects

Data represent number or mean ± SD. Data were analyzed by one-way ANOVA.
NC = normal control; aMCI = amnestic mild cognitive impairment; AD = Alzheimer's disease; CDR = Clinical Dementia Rating; MMSE = Mini-Mental State Examination; NPI = Neuropsychiatric Inventory
1H MRS data
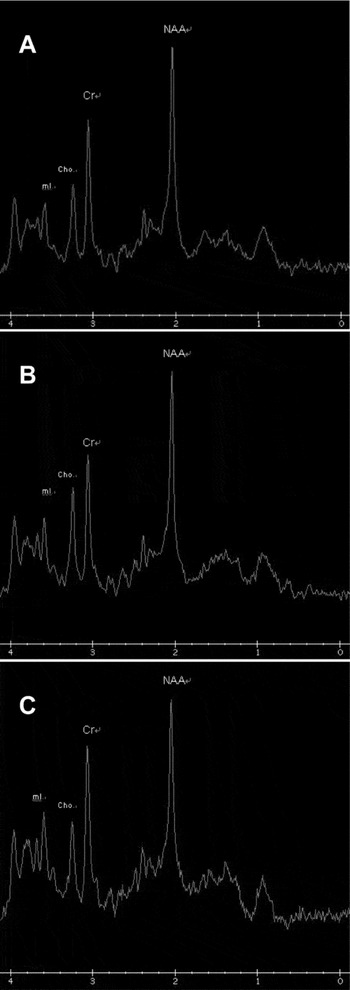
The representative proton MR spectra of the PCG for (a) the NC group, (b) the aMCI group and (c) the AD group are shown in Figure 2.
Representative proton MR spectra for (A) the NC group, (B) the aMCI group and (C) the AD group.

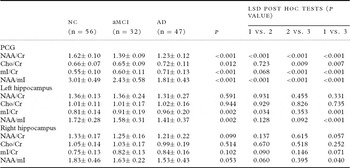
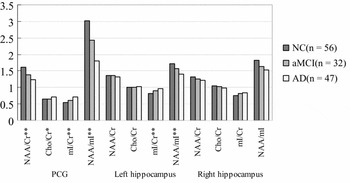
As shown in Table 2 and Figure 3, differences between the groups were found in the PCG for NAA/Cr, mI/Cr, NAA/mI (P's ≤ 0.01) and Cho/Cr (P = 0.012) ratios. Differences between the groups were found in the left hippocampus for mI/Cr and NAA/mI (P's < 0.01). Within the PCG, the NAA/Cr and NAA/mI ratios increased between the AD and MCI groups and between the MCI and the NC groups. Conversely, in the PCG and left hippocampus, the mI/Cr ratio decreased across the AD, MCI, and NC groups. Interestingly, the Cho/Cr ratio of PCG was reduced significantly only in AD subjects.
Assessment of metabolic markers of neuronal damage by MRS

Data represent mean ± SD and were analyzed by one-way ANOVA and LSD post hoc tests.
1 = NC (group 1), 2 = aMCI (group 2), 3 = AD (group 3)
NC = normal control; aMCI = amnestic mild cognitive impairment; AD = Alzheimer's disease; LSD = least significant difference; PCG = posterior cingulate gyri; NAA = N-acetylaspartate; Cho = choline; mI = myo-inositol; Cr = creatine
The metabolic markers of neuronal damage by 1H MRS. *significant at p ≤ 0.05 level, **significant at p ≤ 0.01 level by one-way ANOVA tests.

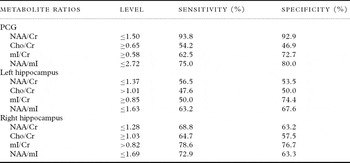
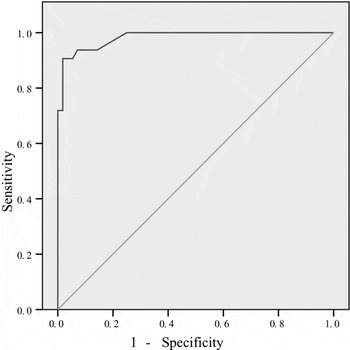
As shown in Table 3, in discriminant and ROC analyses, a NAA/Cr ratio in the PCG of ≤ 1.50 allowed optimal discrimination between aMCI patients and normal control subjects (sensitivity = 93.8% and specificity = 92.9%; Figure 4). A NAA/mI ratio in the PCG of ≤ 2.72 showed the next highest potential for discrimination (sensitivity = 75.0% and specificity = 80.0%). Despite significant differences between NC and aMCI patients in the mI/Cr ratio in the PCG and in the NAA/mI ratio in the left hippocampus, their sensitivity and specificity were low than 75%.
Regional metabolite ratios as discriminators between aMCI and NC

aMCI = amnestic mild cognitive impairment; NC = normal control; PCG = posterior cingulate gyri; NAA = N-acetylaspartate; Cho = choline; mI = myo-inositol; Cr = creatine
The NAA/Cr ratio in PCG as a predictor of aMCI.

Discussion
NAA in the brain is primarily localized in neuron bodies, axons, and dendrites. In this way, NAA can be a sensitive marker for the loss of neuronal components, neuronal functional disruption, or both. NAA is reduced in both the cortical grey matter and the white matter in AD patients, and the cortex shows neuropathology in AD. The neurofibrillary pathology and associated neuronal damage in AD patients affects the limbic cortical regions earlier and more profoundly than the primary sensorimotor and visual cortices, which are affected only at the end stages of the disease (Zhu et al., Reference Zhu2006). Following this progression, NAA/Cr ratios in cases of mild to moderate AD are decreased in the PCG, which is a paralimbic cortical region. NAA/Cr ratios in the PCG in the current study revealed clear brain tissue loss in MCI patients, which was exacerbated in AD patients. In the hippocampus, decreases in NAA and NAA/Cr ratios have been previously reported (Schuff et al., Reference Schuff2002), but only in patients with AD. Our findings of regional metabolite changes in normal ageing individuals and those with MCI and AD reflect a gradual process of brain degeneration that initially affects the hippocampus. In older MCI patients, the severity of hippocampal and parahippocampal atrophy appears to be predictive of the rate of progression to AD. Reduction of NAA occurred even earlier than atrophy in MCI patients.
Conflicting reports exist on Cho levels in AD patients, as some studies have identified elevated levels (Kantarci et al., Reference Kantarci2004), while others have not (Krishnan et al., Reference Krishnan2003). The largest amount of Cho found in the brain is in the Cho-bound membrane phospholipids. Free Cho and acetylcholine are in low levels in brain tissue, and therefore do not contribute detectably to the nuclear magnetic resonance (NMR) signal. One possible explanation for the elevation of Cho in AD patients is increased membrane turnover due to neurodegeneration. It has also been postulated that the elevation of the Cho peak is the consequence of membrane phosphatidylcholine catabolism, to provide free choline for the chronically deficient acetylcholine production in AD. Cho/Cr levels decrease with cholinergic agonist treatment of AD, suggesting that downregulation of choline acetyltransferase activity may be responsible for the elevation of Cho. In our study, Cho/Cr levels were elevated only in the PCG of AD patients, while MCI patients had similar levels to those of the control subjects.
In the current study, NNA/Cr and mI/Cr ratios in the PCG were found to be significantly different across the AD, MCI and NC subject groups. Group differences were not as obvious in the hippocampus as in the PCG, although the mI/Cr ratio in the left hippocampus showed a significant effect. Significant group differences were found in the current study in the NNA/mI ratio of the PCG and left hippocampus. We speculate that metabolite changes may appear early in the PCG and later in the hippocampus, and that this theory may provide an interesting topic for investigation in future studies.
The syndrome of amnestic MCI was established to identify individuals with prodromal AD (Petersen, Reference Petersen2004). Such individuals have memory impairment but do not meet the clinical criteria for dementia, despite many of them having early AD pathology. For this reason, amnestic MCI is an important clinical group for the imaging of early AD and for early therapeutic intervention. Patients with aMCI show an increased mI/Cr ratio in the parietal lobes compared with elderly control subjects (Catani et al., Reference Catani2001), whereas NAA/Cr ratios are either mildly decreased or normal. Conversely, NAA and NAA/Cr ratios are significantly decreased in the hippocampus of amnestic MCI patients (Ackl et al., Reference Ackl, Ising, Schreiber, Atiya, Sonntag and Auer2005). Regional elevation of mI/Cr ratios in prodromal AD suggests the following: (1) that 1H MRS may be sensitive to the biochemical changes that occur during the pathologic progression of AD, before there is a significant loss of neuronal integrity, and (2) that different brain regions and metabolites may identify different pathological stages in the course of AD. Therefore, mI/Cr and NAA/Cr ratios may be useful for predicting and monitoring prodromal AD in MCI patients. For example, NAA/Cr ratios have been reported to be lower at baseline in patients with aMCI who later progressed to AD than in those who remained stable at follow-up (Chao et al., Reference Chao2005; Modrego et al., Reference Modrego, Fayed and Pina2005; Metastasio et al., Reference Metastasio2006). Our results support the clinical utility of proton MRS in diagnosing MCI and NC. NAA/Cr levels in the PCG show good diagnostic discrimination between MCI and NC patients. The clinical utility of NAA/Cr ratios, as determined by 1H MRS, has also been demonstrated by Fayed et al. (Reference Fayed, Dávila, Oliveros, Castillo and Medrano2008). Those authors found that NAA/Cr ratios in the PCG predicted the conversion of MCI to probable AD with a sensitivity of 82% and specificity of 72%, and that NAA/Cr ratios in the left occipital cortex (LOC) demonstrated a sensitivity of 78% and specificity of 69%. Kantarci et al. (Reference Kantarci2009) followed 151 subjects with MCI and found that NAA/Cr ratios, as determined by 1H MRS, predicted progression to dementia. The authors’ previous research showed that the Cho/Cr ratio was elevated in the paralimbic cortical region and in the PCG in MCI patients. Little research has compared MCI and NC subjects. Our study indicates that NAA/Cr ratios of ≤ 1.50 in the PCG show 93.8% sensitivity and 92.9% specificity in discriminating between MCI and NC patients.
Conclusions
Within the PCG, the NAA/Cr ratio showed increasing levels between the AD, MCI, and NC subjects. Conversely, the mI/Cr ratio in the PCG and left hippocampus showed decreasing levels across the AD, MCI, and NC subjects. A ratio of NAA/Cr ≤ 1.50 in the PCG, revealed by proton MRS, indicates considerable potential for distinguishing between MCI and NC patients. Future studies should examine the use of proton MRS in combination with other AD biomarkers to specify their individual contributions to the clinical pathology of AD and to predict the risk for developing MCI and AD.
Conflict of interest
None.
Description of authors’ roles
Tao Wang contributed to the design of the project and writing of the paper. Shifu Xiao supervised the analysis and contributed to the design of the project. Xia Li, Bei Ding and Huawei Ling carried out the data collection of brain images. Kemin Chen and Yiru Fang supervised the data collection and analysis. All authors read and approved the final paper.
Acknowledgments
This work was supported by grants from the Shanghai Science and Technology Committee (Nos.08411951100 and 10ZR1425800) and the China Ministry of Science and Technology. (Nos. 2008ZX09312–014 and 2008ZX09312–003).