

INTRODUCTION
Word learning entails the creation of a lexical representation, corresponding to the sound form of the word (e.g. /mus/ for moose), and a semantic representation, corresponding to the meaning of the word (e.g. ‘mammal with long legs and antlers’ for moose), as well as a link or association between these two representations (e.g. Gupta & MacWhinney, Reference Gupta and MacWhinney1997). Existing lexical and semantic representations in long-term memory may be activated during the creation of these new representations, influencing whether the word is learned or not. sublexical representations, such as phonemes (e.g. /m/, /u/, /s/ for moose), and subsemantic representations, such as semantic features (e.g. solidity, shape, material), in long-term memory also may be activated to support the creation of new lexical and semantic representations (e.g. Gasser & Smith, Reference Gasser and Smith1998; Gupta & MacWhinney, Reference Gupta and MacWhinney1997). While there are many sublexical, subsemantic, lexical and semantic characteristics of novel words that influence word learning, the focus of this study is on phonotactic probability and neighborhood density.
phonotactic probability refers to the likelihood of occurrence of a sound sequence in a language, such that some sound sequences can be identified as low probability (e.g. /dʤus/ juice), having infrequently occurring individual sounds and sound pairs, and others can be identified as high probability (e.g. /boʊl/ bowl), having frequently occurring individual sounds and sound pairs. neighborhood density refers to the number of phonologically similar words based on a difference of one sound. Neighborhood density is correlated with phonotactic probability, such that low probability sound sequences tend to reside in low density neighborhoods with few neighbors (e.g. juice has six neighbors) and high probability sound sequences tend to reside in high density neighborhoods with many neighbors (e.g. bowl has nineteen neighbors; Storkel, Reference Storkel2004c). Past research has shown that preschool children tend to learn high probability/density novel words more readily than low probability/density novel words (e.g. Storkel, Reference Storkel2001; Reference Storkel2004a; Storkel & Maekawa, Reference Storkel and Maekawa2005). However, when phonotactic probability is differentiated from neighborhood density, children and adults learn low probability sequences more readily than high and learn high density sequences more readily than low (Storkel, Reference Storkel2009; Storkel, Armbruster & Hogan, Reference Storkel, Armbruster and Hogan2006).
Past studies of the influence of phonotactic probability and neighborhood density on word learning have computed these variables over the whole word, which in most studies corresponded to a single syllable (but see Storkel, Reference Storkel2004b; Reference Storkel2009). However, there is emerging evidence that part-word phonotactic probability or neighborhood density may influence language processing, at least in adults (e.g. Vitevitch, Reference Vitevitch2002; Vitevitch, Armbruster & Chu, Reference Vitevitch, Armbruster and Chu2004). Specifically, when the overall number of neighbors was held constant, adults recognized words with few neighbors sharing the first sound more quickly than words with many neighbors sharing the first sound (Vitevitch, Reference Vitevitch2002) and produced words with many neighbors sharing the first sound more quickly than words with few neighbors sharing the first sound (Vitevitch et al., Reference Vitevitch, Armbruster and Chu2004). Thus, adults seem to be sensitive to part-word characteristics as well as whole-word characteristics.
What remains unclear is whether part-word characteristics would influence word learning, particularly for preschool children. It has been hypothesized that not all phonological units are readily available at the onset of language acquisition (Metsala & Walley, Reference Metsala, Walley, Metsala and Ehri1998; Ziegler & Goswami, Reference Ziegler and Goswami2005). Specifically, larger phonological units, such as whole-words and syllables, presumably are available initially, and smaller phonological units, such as parts of syllables, become available only as words are acquired and exert pressure to differentiate similar sounding words (Metsala & Walley, Reference Metsala, Walley, Metsala and Ehri1998; Ziegler & Goswami, Reference Ziegler and Goswami2005). Furthermore, even smaller phonological units, such as phonemes, may not become available until written language skills are acquired (Ziegler & Goswami, Reference Ziegler and Goswami2005). A large body of evidence using phonological awareness paradigms supports this view. However, it is unclear how this hypothesis might apply to word learning. On the one hand, we might expect word learning to follow a parallel developmental sequence where children initially are influenced by whole-word characteristics and only later are influenced by part-word characteristics. On the other hand, phonological awareness paradigms tend to require explicit manipulation of phonological units; therefore earlier access to smaller phonological units might be revealed in more implicit tasks, such as word learning tasks (Swingley & Aslin, Reference Swingley and Aslin2000). In this case, we might expect to see that part-word characteristics influence word learning throughout development.
Accordingly, the goal of this study was to examine the influence of part-word characteristics on word learning by preschool children differing in age and/or vocabulary development. To accomplish this, a large number of typically developing preschool children varying in age and vocabulary were recruited to participate in a word learning study. The words to be learned were single syllable consonant-vowel-consonant (i.e. CVC) nonwords varying orthogonally in the phonotactic probability and neighborhood density of the initial consonant-vowel sequence (i.e. CV or body) and the final vowel-consonant sequence (i.e. VC or rhyme). The influence of age and vocabulary on word learning was examined first to determine whether to divide the children based on age or vocabulary. Subsequent analyses then examined whether part-word phonotactic probability/neighborhood density influenced word learning and whether this varied across children differing in age/vocabulary.
Method
Participants
Ninety-eight children (M age 4 years; 4 months, SD=0 ; 10, range=2 ; 11–6 ; 0; 53% female, 47% male) were recruited from local preschools or a database of families interested in participating in research. Parents reported via questionnaire a normal developmental history and unremarkable medical history for each child. Children passed a hearing screening in both ears (ASHA, 1997) and exhibited normal phonological development (Goldman & Fristoe, Reference Goldman and Fristoe2000) with standard scores within a standard deviation of the mean (M=109, SD=8, range=89–124). Children also exhibited normal vocabulary development (Brownell, Reference Brownell2000a; Reference Brownell2000b) with standard scores within a standard deviation of the mean for either receptive (M=107, SD=10, range=82–145) and/or expressive vocabulary (M=108, SD=12, range=81–145).
Stimuli
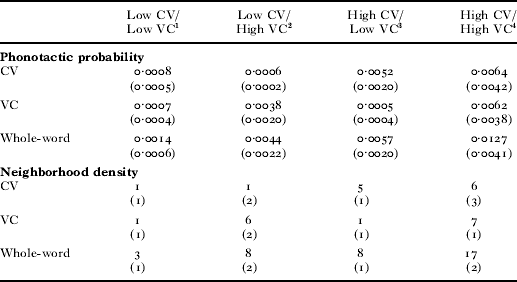
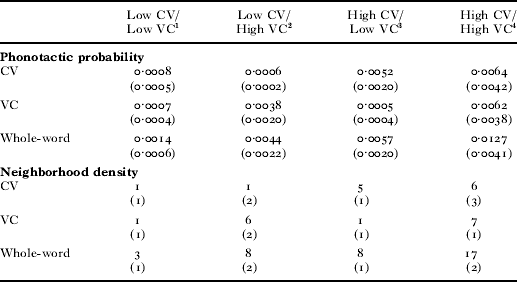
Phonotactic probability and neighborhood density were computed for a pool of legal English CVC nonwords with early acquired phonemes (Smit, Hand, Freilinger, Bernthal & Bird, Reference Smit, Hand, Freilinger, Bernthal and Bird1990). Both measures were originally computed using an approximately 20,000 word adult corpus (Nusbaum, Pisoni & Davis, Reference Nusbaum, Pisoni and Davis1984) and stimuli were selected based on these values (see Storkel & Hoover, Reference Storkel and Hoover2006, for adult values of the selected stimuli). However, recently an on-line calculator using an approximately 5,000 word child corpus became available (Storkel & Hoover, Reference Storkel and Hoover2010, www.bncdnet.ku.edu/cml/info_ccc.vi). Stimuli selection was verified using child values for phonotactic probability and neighborhood density, which are reported in Table 1.
Means (and standard deviations) for part-word (CV, VC) and whole-word phonotactic probability and neighborhood density of the stimuli
1 /naʊb wαf gib joʊg/ 2/wæp gim jʌt jαk/ 3/koʊf pαg meIg tib/ 4/poʊn f∊n kæd pId/.
The measure of phonotactic probability was biphone frequency. The child calculator computes biphone frequency by summing the log frequency for all words in the child corpus containing the given sound pair in the given word position and dividing by the sum of the log frequency of all the words in the corpus containing any sound in the given word position (Storkel, Reference Storkel2004c; Storkel & Hoover, 2010). Biphone frequency was computed for the CV and VC in each CVC nonword. In addition, a measure of whole-word phonotactic probability was computed by summing the CV and VC biphone frequencies.
Note that positional segment frequency is a second commonly used measure of phonotactic probability, and it is highly correlated with biphone frequency (Storkel, Reference Storkel2004c). The positional segment frequency of the selected stimuli for this study agreed with the classification based on biphone frequencies (e.g. high CV nonwords had both high CV biphone frequency and high C+V positional segment frequency).
The child calculator computes neighborhood density by identifying all the words in the child corpus that differ from the given nonword by a one sound substitution, deletion or addition in any word position (Storkel, Reference Storkel2004c; Storkel & Hoover, 2010). This is the whole-word measure of neighborhood density. In addition, the calculator counts the number of neighbors that have the same CV as the nonword or the same VC as the nonword, namely CV and VC measures of density.
Sixteen CVCs were selected to orthogonally vary CV phonotactic probability/density and VC phonotactic probability/density to yield four conditions: (1) low CV/low VC; (2) low CV/high VC; (3) high CV/low VC; and (4) high CV/high VC. Phonotactic probability and neighborhood density of each condition are shown in Table 1. As can be seen in Table 1, this manner of stimulus selection lead to variation in the whole-word measures of phonotactic probability and neighborhood density, resulting in the following ordering of conditions from lowest to highest: (1) low CV/low VC; (2) low CV/high VC and high CV/low VC; (3) high CV/high VC.
The selected CVCs were paired with a previously developed set of novel objects and exposure stories described more extensively in Storkel (Reference Storkel2004b) and Storkel & Maekawa (Reference Storkel and Maekawa2005) . Briefly, four novel objects were selected from each of four semantic categories (i.e. candy machines, pets, horns, toys), yielding a total of sixteen novel objects. CVCs were paired with novel objects such that each CV/VC condition was paired with an object from each semantic category. Pairing of CVCs and novel objects was counterbalanced across participants.
Procedures
The sixteen CVC-object pairs were divided into two sets with two CVCs from each CV/VC condition in each set. Training and testing for each set occurred on separate days. All experimental tasks were administered via laptop computer running DirectRT experimental control software (Jarvis, Reference Jarvis2002). DirectRT randomized the order of items in each task. A session began with baseline testing in a picture-naming task. Each non-object picture was presented and children were encouraged to guess its name. Training then was initiated with presentation of the CVC-object pairs in a previously developed story (Storkel, Reference Storkel2004b; Storkel & Maekawa, Reference Storkel and Maekawa2005). Visual scenes showed the characters with the novel objects. An auditory narrative, recorded by a female native speaker of American English, provided exposure to the CVCs in a sentence context. Upon completion of the first episode of the story, all CVC-object pairs were reviewed by presenting the objects pictures on the computer with a prerecorded production of the CVC. Imitation of each CVC also was elicited and scored during the review to ensure that children could accurately produce the nonwords (M proportion correct=0·95, SD=0·08). Upon completion of this review, picture naming was retested. This cycle of story exposure, review and testing was repeated three times in a session, providing twenty-four exposures to each CVC-object pair by the conclusion of training. Retention was tested one-week after training without further exposure (M=7, SD=2, range 2–19). Only data from the last administration upon completion of training and the one-week retention test were analyzed due to potential floor effects at earlier test points (i.e. during training).
Scoring
Picture-naming responses were audio-recorded, phonemically transcribed and scored. A response was scored as correct if it contained all three target sounds in the correct sequence because previous work has suggested different effects of phonotactic probability and neighborhood density on partially correct responses, which are indicative of emerging mental representations, versus fully correct responses, which are indicative of more complete mental representations (Storkel et al., Reference Storkel, Armbruster and Hogan2006). Analysis of partially correct responses could be useful; however, the analysis would be extremely complex because an additional independent variable would be needed to capture what parts of the word were accurate or inaccurate. Because of this complexity, we chose to focus on fully correct responses only. Point-to-point inter-judge transcription reliability (i.e. proportion of agreements) was computed for 21% of participants with mean reliability of 98% (SD=2, range 95–100%). Scoring reliability (i.e. proportion of agreements) was computed for 21% of participants with mean reliability of 99% (SD=3, range 91–100%).
Results
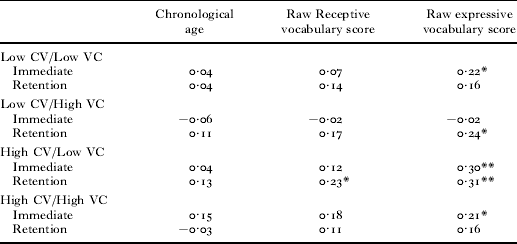
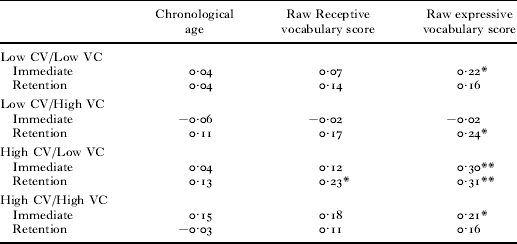
The dependent variable was proportion correct in the picture naming task for each CV (low vs. high)×VC (low vs. high)×time (immediate vs. retention) condition. Correlations between the dependent variables and age, raw receptive vocabulary score and raw expressive vocabulary score were examined to determine whether to split the participants based on age or vocabulary. As shown in Table 2, raw expressive vocabulary generally showed higher correlations and more significant correlations with the dependent variables than chronological age or raw receptive vocabulary scores. Thus, raw expressive vocabulary scores were selected as the relevant dimension for capturing individual differences. Raw expressive vocabulary scores were mean centered (i.e. individual score – group mean) for further statistical analyses.
Correlation (i.e. r) between demographic variables (age, receptive vocabulary, expressive vocabulary) and dependent variables (i.e. proportion correct in each CV×VC×Time condition)
* Significant, p<0·05.
** Significant, p<0·01.
Proportion correct in the picture naming task was analyzed via a 2 CV probability/density (low vs. high)×2 VC probability/density (low vs. high)×2 time (immediate vs. retention) ANCOVA with mean centered raw expressive vocabulary scores as the covariate. Only effects involving the variables of interest (i.e. CV and VC probability/density) will be reported. The main effect of the covariate was significant (F(1, 96)=10·90, p=0·001, ηp2=0·10), with proportion correct in the picture naming task increasing as expressive vocabulary scores increased. This supports the use of ANCOVA instead of ANOVA. In terms of the research questions, there was a significant interaction of CV×VC×Time×Vocabulary (F(1, 96)=4·14, p=0·045, ηp2=0·04).
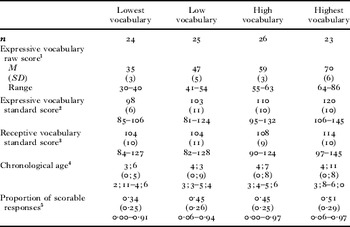
To further examine the significant interaction of CV×VC×Time×Vocabulary, participants were divided into four approximately equal groups based on raw expressive vocabulary scores: lowest, low, high and highest. The previously described ANCOVA was performed for each subgroup. The effect of the covariate was not significant for any subgroup (all F<2·10, all p>0·15, all ηp2<0·09), suggesting that these subgroup divisions were narrow enough to minimize the influence of within-subgroup variation in vocabulary on word learning performance. Characteristics of the four subgroups are shown in Table 3. Data for each subgroup were analyzed using a 2 CV probability/density (low vs. high)×2 VC probability/density (low vs. high)×2 time (immediate vs. retention) ANOVA.
Characteristics of the four expressive vocabulary subgroups

1 Variable used to define the groups.
2 Each group differs significantly from every other group, except for lowest and low.
3 Lowest and low groups differ significantly from highest group. No other groups differ significantly from each other.
4 Lowest group differs significantly from all other groups. Low group differs significantly from highest group.
5 Scorable responses include any response that shared two of three phonemes with any trained nonword, regardless of accuracy of the response, and excludes any responses that were invented nonwords, real words or no response/I don't know response. There was no significant effect of group for this variable.
Lowest expressive vocabulary group
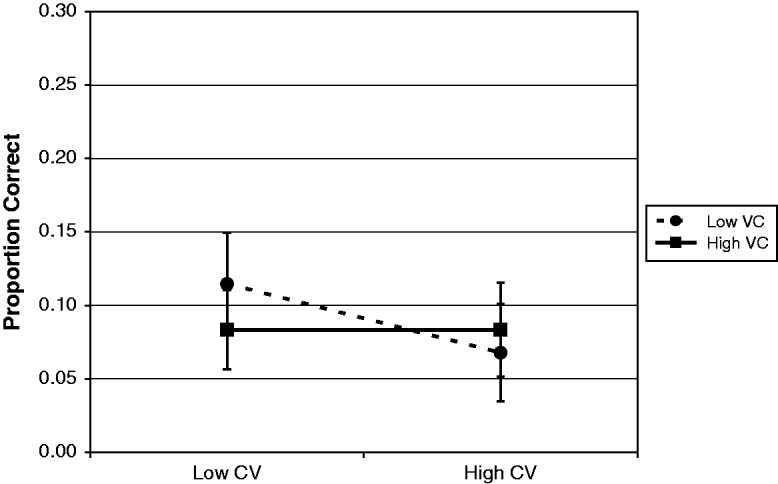
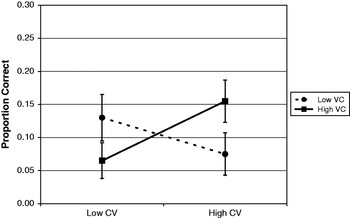
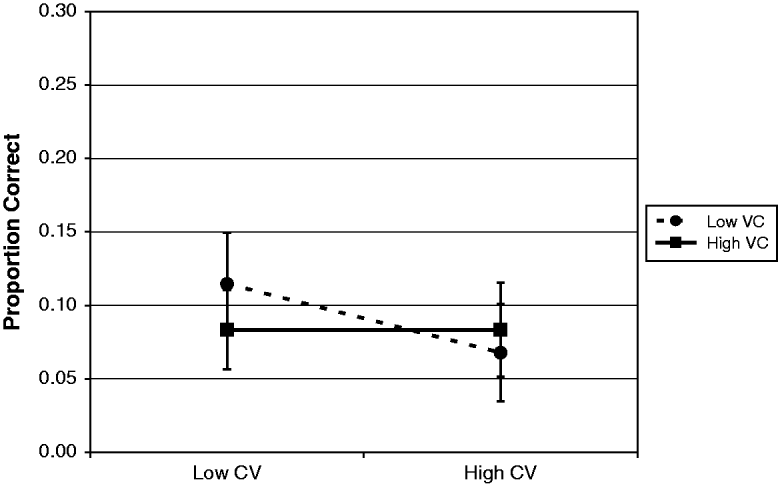
Performance by the lowest expressive vocabulary group is shown in Figure 1. Note that performance for this group was quite low, suggesting floor effects (M=0·09, SD=0·09). In fact, no significant effects of CV probability/density (F(1, 23)=1·18, p=0·29, ηp2=0·05) or VC probability/density (F(1, 23)=0·07, p=0·80, ηp2<0·01) were obtained. Interestingly, as shown in Table 3, this group produced scorable responses (i.e. attempts at trained nonwords) in proportions similar to the other three groups but failed to produce these nonwords for the correct referent, as evidenced by their overall low accuracy (M=0·09, SD=0·09).
Mean proportion correct for the lowest vocabulary group for low versus high CV probability/density (x-axis) and low (circles) versus high VC probability/density (squares). Bars indicate standard errors.
Low expressive vocabulary group
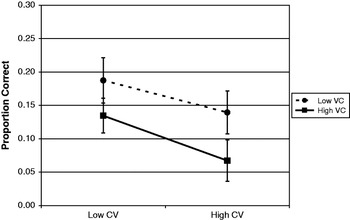
Performance by the low expressive vocabulary group is shown in Figure 2. Here, the interaction between CV probability/density and VC probability/density was significant (F(1, 24)=10·44, p=0·004, ηp2=0·30). This interaction was further explored by examining the effect of CV probability/density within each level of VC probability/density (low vs. high) and the effect of VC probability/density within each level of CV probability/density (low vs. high).
Mean proportion correct for the low vocabulary group for low versus high CV probability/density (x-axis) and low (circles) versus high VC probability/density (squares). Bars indicate standard errors.

Effect of CV probability/density
For low VC nonwords, CV probability/density was not significant (F(1, 24)=3·04, p=0·09, ηp2=0·11) (see Figure 2). In contrast, for high VC nonwords, proportion correct for high CV nonwords (M=0·16, SD=0·18) was significantly greater than proportion correct for low CV nonwords (M=0·07, SD=0·09) (F(1, 24)=7·58, p=0·01, ηp2=0·24).
Effect of VC probability/density
For low CV nonwords, the proportion correct for low VC nonwords (M=0·13, SD=0·14) was significantly greater than proportion correct for high VC nonwords (M=0·07, SD=0·09) (F(1, 24)=5·03, p=0·03, ηp2=0·17) (see Figure 2). In contrast, for high CV nonwords, the proportion correct for low VC nonwords (M=0·08, SD=0·12) was significantly lower than proportion correct for high VC nonwords (M=0·16, SD=0·18) (F(1, 24)=5·37, p=0·03, ηp2=0·18).
High expressive vocabulary group
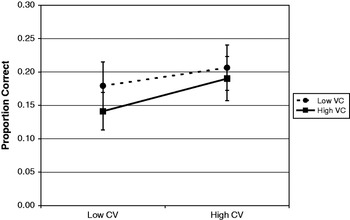
Performance by the high vocabulary group is shown in Figure 3. Significant main effects were observed for both CV probability/density (F(1, 25)=5·33, p=0·03, ηp2=0·18) and VC probability/density (F(1, 25)=7·07, p=0·01, ηp2=0·22), with no significant interaction between the two (F(1, 25)=0·11, p=0·74, ηp2<0·01). Specifically, proportion correct for low CV nonwords (M=0·16, SD=0·13) was significantly greater than proportion correct for high CV nonwords (M=0·10, SD=0·14), regardless of the VC probability/density. Likewise, proportion correct for low VC nonwords (M=0·16, SD=0·16) was significantly greater than proportion correct for high VC nonwords (M=0·10, SD=0·10), regardless of the CV probability/density.
Mean proportion correct for the high vocabulary group for low versus high CV probability/density (x-axis) and low (circles) versus high VC probability/density (squares). Bars indicate standard errors.

Highest expressive vocabulary group
Performance by the highest vocabulary group is shown in Figure 4. No significant effects of CV probability/density (F(1, 22)=1·31, p=0·27, ηp2=0·06) or VC probability/density (F(1, 22)=2·15, p=0·16, ηp2=0·09) were obtained.
Mean proportion correct for the highest vocabulary group for low versus high CV probability/density (x-axis) and low (circles) versus high VC probability/density (squares). Bars indicate standard errors.

CV/VC probability/density×vocabulary group
The previous analyses examined the effects of CV probability/density and VC probability/density within each vocabulary group. A final analysis examined the effect of vocabulary group for each CV×VC probability/density condition to more directly determine which CV/VC conditions lead to significantly different performance across children differing in expressive vocabulary. For low CV/low VC nonwords, there was no significant effect of group (F(3, 94)=1·06, p=0·37, ηp2=0·03). Likewise, for low CV/high VC nonwords, there was no significant effect of group (F(3, 94)=1·97, p=0·12, ηp2=0·06). Thus, children appeared to perform similarly on the low CV nonwords, regardless of their vocabulary.
In contrast, group differences arose for high CV nonwords. Specifically, for high CV/low VC nonwords, the effect of group was significant (F(3, 94)=3·84, p=0·01, ηp2=0·11). Post-hoc comparisons were conducted comparing each vocabulary group to every other (i.e. six comparisons) using Tukey Honestly Significant Difference. Adjusted p values are reported. This post-hoc analysis showed that the highest vocabulary group (M=0·21, SD=0·19) was significantly more accurate than the low (M=0·08, SD=0·12) and lowest (M=0·07, SD=0·10) vocabulary groups (p=0·03 and p=0·02 respectively). The high vocabulary group (M=0·14, SD=0·20) fell between these two extremes but did not differ significantly from the other groups (all ps>0·70). Likewise, for high CV/high VC nonwords, the effect of group was significant (F(3, 94)=3·05, p=0·03, ηp2=0·09). Here, post-hoc comparisons with Tukey HSD showed that the highest group (M=0·19, SD=0·22) was marginally significantly more accurate than the high vocabulary group (M=0·07, SD=0·10) (p=0·05). The low (M=0·16, SD=0·18) and lowest (M=0·08, SD=0·11) vocabulary groups fell between these two extremes but did not differ significantly from the other groups or each other (all ps>0·10). Thus, for high CV nonwords, vocabulary appeared to influence performance with the highest vocabulary group tending to be more accurate than the other three groups.
DISCUSSION
Results of this study suggest that the influence of CV probability/density and VC probability/density varies by vocabulary size. The interpretation of results from each vocabulary group will be considered in turn. Children with the lowest expressive vocabulary scores showed no effect of either CV or VC probability/density. This may have been attributable to their overall low performance in learning words following brief exposure (i.e. floor effects), rather than an actual insensitivity to part-word probability/density. Although it is possible that children with smaller vocabularies are insensitive to part-word probability/density, as predicted by Metsala & Walley (Reference Metsala, Walley, Metsala and Ehri1998) and Ziegler & Goswami (Reference Ziegler and Goswami2005) , future research using a more effective training paradigm is needed to validate this hypothesis. The findings from the remaining groups support access to smaller phonological units in more implicit tasks.
Children in the low vocabulary group demonstrated sensitivity to part-word probability/density. Interestingly, the influence of CV probability/density depended on the VC probability/density, and likewise the effect of VC probability/density depended on the CV probability density. That is, children learned low CV/low VC and high CV/high VC nonwords better than the low CV/high VC and high CV/low VC nonwords. One possible interpretation of this pattern is that children at this vocabulary level require a convergence of CV and VC probability/density to efficiently learn new words and that low and high probability/density offer differing benefits. That is, low probability/density novel words may be more quickly recognized as a new word that needs to be learned because the sound sequence is relatively rare in the ambient language and few existing lexical representations would be activated in long-term memory when the sound sequence is encountered. For these reasons, learning of the novel word may be immediately triggered upon first exposure, speeding learning. A word with low CV probability/density and low VC probability/density would provide a convergence of characteristics indicating the novelty of the sound sequence relative to a word with mixed CV and VC probability/density.
Complementing this, a more complete and accurate lexical representation may be created for high probability/density novel words because these sound sequences are held in working memory more accurately than low probability/density (Gathercole, Frankish, Pickering & Peaker, Reference Gathercole, Frankish, Pickering and Peaker1999; Thomson, Richardson & Goswami, Reference Thomson, Richardson and Goswami2005). A word with high CV probability/density and high VC probability/density would provide a convergence of characteristics to support working memory relative to a word with mixed CV and VC probability/density. These two hypotheses could be explicitly tested using stimuli from the current study in other paradigms, specifically a novelty detection paradigm (Merriman & Schuster, Reference Merriman and Schuster1991) to test the hypothesis related to triggering and a nonword repetition or serial recall paradigm (Gathercole et al., Reference Gathercole, Frankish, Pickering and Peaker1999; Thomson et al., Reference Thomson, Richardson and Goswami2005) to test the hypothesis related to working memory.
Turning to the high vocabulary group, children also demonstrated sensitivity to part-word probability/density but the pattern differed from that of the low vocabulary group. In particular, no interaction of CV and VC probability/density was observed. Instead, children learned nonwords with low CV probability/density better than nonwords with high CV probability/density, and learned nonwords with low VC probability/density better than nonwords with high VC probability/density. This suggests that the high vocabulary group may still have benefited from a convergence of CV and VC probability/density but that the previous benefit of high probability/density observed for the low vocabulary group may have been reduced. That is, although high probability/density sound sequences may be retained better in working memory than low probability/density sound sequences, they also engender greater competition between lexical representations (e.g. Metsala, Reference Metsala1997). As the size of the lexicon increases, more words are available to compete with the newly created lexical representation. This greater competition may degrade the newly created lexical representation of high probability/density novel words, outweighing the previously described benefits of high probability/density to working memory. This hypothesis could be tested by examining the current stimuli in a paradigm that directly examines integration of newly learned words with existing known words in long-term memory (Gaskell & Dumay, Reference Gaskell and Dumay2003).
The highest vocabulary group failed to show significant effects of probability/density. This group showed the highest accuracy in performance so the lack of an effect cannot be attributed to floor effects. However, the comparison of vocabulary groups for each CV×VC condition showed differences between this highest vocabulary group and (some of) the other groups for high CV probability/density nonwords. In particular, the highest vocabulary group showed better accuracy for the high CV probability/density nonwords than (some of) the other groups. This suggests the possibility that the highest vocabulary group may have been undergoing a transition in their word learning that was not yet fully completed. This transition potentially involved the re-weighting of part-word probability/density. That is, the trends were for a benefit of high CV probability/density but low VC probability/density. It is possible that this re-weighting could occur as a reaction to the characteristics of the ambient language. Specifically, it has been reported that there is a greater redundancy in the rhyme than in the body, at least in some languages, including English (Ziegler & Goswami, Reference Ziegler and Goswami2005). Thus, within the language, VCs are higher probability/density than CVs, which could have consequences for the costs versus benefits of high probability/density, as previously described. As a result, the optimal probability/density for each part could differ with high probability/density being beneficial for CVs, and low probability/density being beneficial for VCs. This hypothesis is clearly speculative, warranting further investigation, especially with an array of different paradigms (e.g. working memory, word recognition, speech production).
CONCLUSION
This was the first study to examine the influence of part-word probability/density on word learning. Results showed that word learning by the majority of children was influenced by both CV and VC probability/density but that the nature of this influence varied by the size of the lexicon. This suggests a refinement to the previous hypotheses by Metsala & Walley (Reference Metsala, Walley, Metsala and Ehri1998) and Ziegler & Goswami (Reference Ziegler and Goswami2005) , which assumed that access to smaller phonological units is what changes with development with primary support coming from research using phonological awareness tasks. The current findings from a more implicit task, namely word learning, suggest that children may have access to smaller phonological units early in development but their knowledge and use of these smaller units does continue to change as vocabulary increases. Although preliminary, these results suggest the need to further investigate how part-word characteristics influence word learning, and possibly other areas of language processing, across development.