


Introduction
The cardinal feature and perennial issue looming over early American politics was the peculiar institution of slavery. Indeed, the ratification of the Constitution would not have been possible without the infamous North–South logroll resulting in the three-fifths compromise in which slaves were to be counted as such for representation and taxation. In this article, we make the argument that long before the great sectional crisis of the Civil War, the marked political differences between Northern and Southern states clearly registered in the context of electoral competition in congressional elections.
The Federalist Party won the battle over ratification of the Constitution, but only briefly enjoyed a majority position in national politics. With Alexander Hamilton leading the way, the Federalist vision of a strong central government with superiority over the states and an activist agenda of infrastructure-based expansion was forcefully checked by Thomas Jefferson's quickly emerging Republican opposition (Aldrich Reference Aldrich1995; Wilentz Reference Wilentz2005). In this initial party system that roughly spanned the first 19 Congresses, from 1789 to 1827, the sectional battle lines were firmly drawn. Northern and Southern political environments were not only differentiable, but the peculiar institution had become a Southern issue that unified Northern opposition because westward expansion created an intractable and ultimately unresolvable conflict over whether new states would be free or slave.
As we demonstrate in this study, from the start, the markedly different political settings of the North and South manifested in distinct electoral behavior. Specifically, we examine differences in competitiveness in US House contests. Although we recognize that the slavery issue was far from the only one creating tension between the increasingly free North and increasingly bonded South, our understanding of early American politics combined with the evidence from this work, strongly suggests that the growing sectional tension over slavery is the linchpin for the significant regional differences we find with respect to competitiveness in congressional elections.
Over time the correlation between Southern states and the presence of slaveholding grew much stronger because its expansion occurred primarily in the South, while it was gradually abolished in almost all the Northern states (except for parts of New Jersey and New York, and the border states of Delaware, Kentucky, Maryland, and Missouri). Because of the increasingly tight linkage between the South and the institution of slavery, we begin our preliminary analysis by highlighting sectional differences (North vs. South) before homing in on the specific role of slaveholding in influencing competitiveness at the district level in congressional contests. We find that the district percentage of slaves substantially reduces the degree of competition in the House of Representatives. To our knowledge, this is the first study to systematically examine sectional differences and the direct role of slavery in shaping electoral competition in early US House elections.
Elections and the First Party System, 1789–1827
Recent scholarship on early congressional elections is altering our impression of the dynamics shaping these contests. Most importantly, although we know that the institutional structure of House contests was markedly different than those of today (e.g., candidate selection was done through the party, party ballots that were not officially secret, and a heavily partisan press operated as the primary extraparty conduit for informing and mobilizing voters; see Carson and Hood Reference Carson and Hood2014), it appears that some of the leading factors shaping contemporary competitiveness were applicable in the early 1800s. Perhaps surprisingly, because nineteenth-century candidates did not actively campaign for public office like they do in the contemporary candidate-centered era (Ehrenhalt Reference Ehrenhalt1992), there is still evidence that candidate quality (previous elective office) and incumbency both affected election outcomes (Carson and Hood Reference Carson and Hood2014).
Hence, even when the local party organization and party caucuses monopolized the selection of congressional candidates (ibid. 2014; Dallinger Reference Dallinger1897; Ostrogorski Reference Ostrogorski1964), ambition was alive and well (Kernell Reference Kernell1977), and it influenced voting behavior and ultimately moved election margins (Carson and Hood Reference Carson and Hood2014). Indeed, we owe a debt of scholarly gratitude to the work of Carson and Hood (ibid.: 761), who claim that prior to their study of early House elections (1800–20), “with few exceptions, almost nothing is known about congressional elections during the early antebellum era.”Footnote 1 But even though we now have evidence that political ambition (perhaps to no surprise) dates back to the founding era, and registered an effect with respect to candidate quality and the incumbency advantage, we retain only a hazy and incomplete picture of early congressional contests. And we should fortify the aforementioned statement by noting that no social science literature has empirically addressed the significance of sectionalism and, more specifically, the role of slavery in affecting competition in the earliest years of American congressional elections.
We wish it were possible to enter a time machine to witness the administration of early House elections. Short of this, it is apparent that there is no systematic accounting of how these elections were conductedFootnote 2 nor do we have a satisfactory record of which voters participated. To be sure, there are estimates of turnout in House contests dating back to the founding (Burnham Reference Burnham2010), but these data do not tell us specifically who voted. Historical evidence makes it apparent that prior to the presidential election of Andrew Jackson in 1828, the eligible electorate varied considerably depending on the region, state, and local setting (Ratcliffe Reference Ratcliffe2013; Wilentz Reference Wilentz2005; Williamson Reference Williamson1960). Further, although widespread adoption of the secret ballot did not materialize until the 1890s (Jenkins Reference Jenkins2004), in many places voting using “written ballots became the norm” (Wilentz Reference Wilentz2005: 28) and “[a]s a result—and contrary to common historical opinion—the secret ballot was the norm in the early republic” (Ratcliffe Reference Ratcliffe2013: 235). Yet evidence of an unofficial and certainly far from foolproof form of voting cannot inform us of the possible high degree of variation in the actual process of casting one's ballot. For instance, we can easily envision a polling place where a strong local partisan machine distributed the only ballots that voters could procure. Likewise, we can also imagine a precinct where vigorous two-party competition held sway and there was a tumult that routinely ensued when constituents were summoned to vote.
According to Ratcliffe (Reference Ratcliffe2013) (see also Keyssar Reference Keyssar2009 and Wilentz Reference Wilentz2005), by the second decade of the constitutionally birthed United States, the majority of white males were eligible to vote; this was true even in the nation's most elitist states like Connecticut, South Carolina, and Virginia.Footnote 3 Hence, before the rise of the Jacksonian mass-based party system, the ascriptive features of white and male came to delineate the common boundaries of the American electorate. Outside of these two accidents of birth, except for New Jersey, which for a time allowed white women to vote (Wilentz Reference Wilentz2005), being of some other demographic profile practically guaranteed disenfranchisement (Smith Reference Smith1993). Indeed, across the United States, free blacks were especially singled out as unfit to vote by legal prescriptions, with rare exceptions in parts of New England where African Americans constituted a meager presence (Wilentz Reference Wilentz2005).
Having a better understanding of the enfranchised early American electorate provides only a broad and nebulous portrait of a nascent democracy monopolized by white males. At this time, we still lack detailed information on the characteristic features of each state's “places and manner of holding elections for. . .Representatives,” as charged by the Constitution. Nonetheless, the incomplete and often spotty historical record leads us to believe that a typical polling place in a highly democratic state like Pennsylvania drew a much more egalitarian constituency than one found somewhere in regal Virginia with its phalanx of slaveholders (Shade Reference Shade1987). In this respect, it naturally follows that a more diverse electorate fosters more political competition, especially if a greater variety of voters harbor a multitude of interests eliciting the attention of a wide swath of ambitious politicians.
So, in the absence of a rich and representative tapestry of the numerous electoral milieus in which congressional voting occurred before Old Hickory resided in the White House, we admittedly find it more prudent to rest our argument that slavery greatly constricted competition in early House elections on the firmer footing of what we know about political elites. Specifically, in the American South, long before the massive schism of the Civil War, every state that would secede from the Union was home to a subset of planter rulers who found it in their immediate political interest to limit electoral competition for the sake of safeguarding their peculiar institution of chattel slavery (Key Reference Key1949). Thus, whatever division may have emerged between slaveholders who found themselves separating into different partisan camps (Federalist vs. Jeffersonian Republican), the higher the concentration of human bondage in a given congressional district (including at-large statewide districts), the less likely a spirited contest would arise because the planter elite would discourage such a vigorous display of democracy. Unlike the greater potential and realization of expanded participation and competition in Northern House districts and even in those Southern settings where human bondage was rare or nonexistent, where the “slaveocracy” reigned supreme, we contend that a cardinal feature of deference to the established order (Beeman Reference Beeman1992) manifested in a dearth of electoral competition for the lower chamber of the “people's branch.”Footnote 4
Slavery in the United States
In the English colonial setting, chattel slavery, America's original sin, dates to 1619 when the first slave ship unloaded its bonded subjects at Old Point Comfort in Hampton, Virginia. More than a century and a half later, the Declaration of Independence and its famous words declaring that “all men are created equal” resulted in an American Revolution that did little to address the plight of human property. In fact, “The Revolution itself ultimately strengthened slavery” (Van Cleve Reference Van Cleve2010: 3). The slaveholders of the South vigilantly guarded their wealth at every turn—ensuring the Constitution safeguarded the existence of the peculiar institution. Indeed, with the inclusion of the three-fifths rule, it would be hard to fault Southern planters for believing that the slavery issue amounted to settled law.
Figure 1 plots the total number of slaves in the United States across time and region using census data.Footnote 5 From 1790 to 1830, the total slave population increased dramatically, going from 681,777 to 2,009,043. The majority of slaves in the United States were in Southern states. The preponderance of slaves in the South was not based upon attitudinal differences between English settlers in the North and South, but on differences in climates and soils that made “gang labor” a successful method of agricultural enterprise in many parts of the South, but in very few places in the North (Engerman and Sokoloff Reference Engerman and Sokoloff2012: 351).
Slave population by region, 1790-1830.
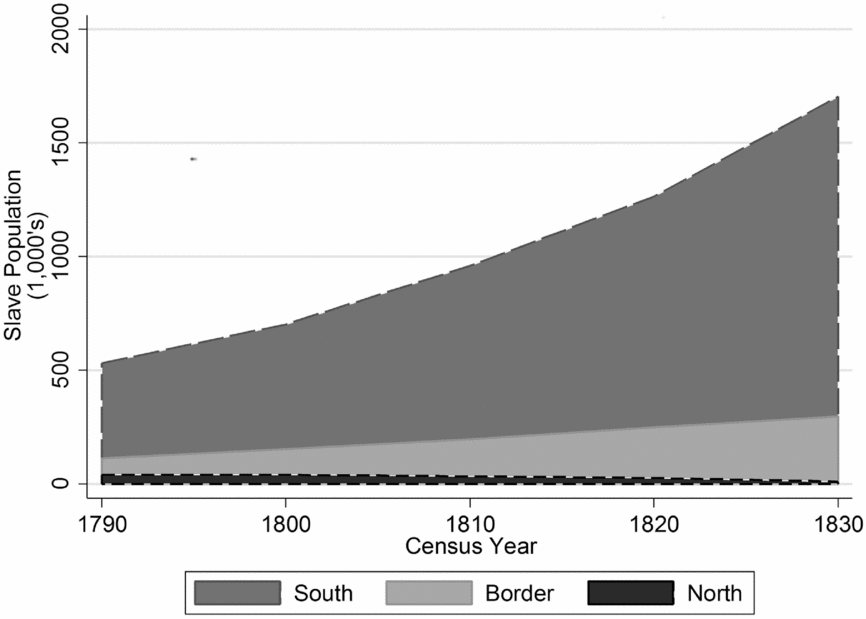
While the slave population in Southern states always dwarfed other regions, the number of slaves in the North decreased significantly from 1790 to 1830. Many Northern states abolished slavery well before passage of the Thirteenth Amendment. For instance, Vermont partially banned slavery as early as 1777. By 1829, seven Northern states outlawed slavery. In most cases, the bans were gradual; the children of slaves were not born into chattel slavery. The Slave Trade Act of 1807 banned the importation of new slaves into the United States. Yet, because no Southern state freed the children of slaves, the overall population of slaves in the South continued to rise. In fact, the expansion of slavery into the West would be driven by the sale of slaves from southeastern slave states. Between 1790 and 1860, more than 1 million African American slaves were transported from upper South states (e.g., Virginia) to lower South states (e.g., Mississippi) (Deyle Reference Deyle2009).
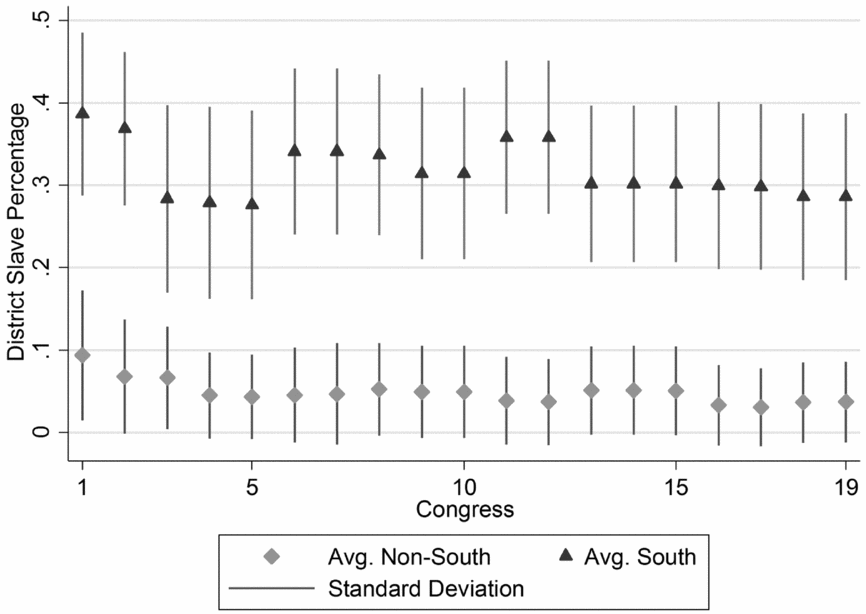
Even in the South, however, the population of slaves greatly varied across states. Figure 2 plots the average number of slaves as a percentage of congressional district total population for Southern and non-Southern states, as well as the standard deviation around the mean. On average, slaves were a much higher percentage of the total House district population in the South than they were in the rest of the nation. Of course, this is not surprising. Nonetheless, even in the South, the standard deviations of average district slave percentage were quite large. Thus, it is not the case that slavery was evenly distributed across districts. In fact, large-scale plantation agriculture was found disproportionately in the coastal, tidewater regions of Virginia and North Carolina, the low country of South Carolina and Georgia (Watson Reference Watson1985), the Black Belt counties of the lower South and east Texas (Key Reference Key1949), and especially in the lower Mississippi River Delta portions of Arkansas Territory, Tennessee, Louisiana, and Mississippi (Collins Reference Collins2015).
Slave percentage in US House districts according to region.
The Slave Power Thesis and Sectional Distinctiveness in Electoral Competition
Is there a connection between slavery and electoral competition? Chattel slavery, as practiced during this period in the United States is one, if not the most extreme, example of labor repressive agriculture. There is quite a bit of research across many cases that pins the absence of democracy on the existence of labor repressive systems, such as slavery and serfdom (Acemoglu and Robinson Reference Acemoglu and Robinson2006; Dahl Reference Dahl1971; Moore Reference Moore1966; Rueschemeyer et al. Reference Rueschemeyer, Stephens and Stephens1992). In such systems, landowners directly control agricultural labor, as in the case of chattel slavery, or through limitations on the movement of labor, as in the case of serfdom. Landed aristocrats benefit from this system because it ensures cheap labor. With low labor costs, their control of land enables the planter aristocracy to become the dominant economic actors in the political system.
The wealth and privilege of landowners in these systems translates directly into political power. For instance, Dahl (Reference Dahl1971: 53) writes:
Cumulative inequalities of status, wealth, income, and means of coercion mean a marked inequality in political resources, an inequality that is reinforced by prevailing beliefs. A small minority with superior resources develops and maintains a hegemonic political system (often headed by a single dominant ruler) through which it can so enforce its domination over the social order and hence strengthen the initial inequalities even more.
The wealth earned through labor repressive agriculture enables the landed gentry to dominate the political system. Control of the political system is essential because it allows the planter aristocracy to perpetuate an economic structure that creates their wealth through the exploitation of serfs or slaves.
Democracy threatens the dominance of the landed elite. Labor repressive systems are, by their nature, antidemocratic. Thus, moving toward democracy threatens the ability of landed elites to tie workers to the land (Dahl Reference Dahl1971; Rueschemeyer et al. Reference Rueschemeyer, Stephens and Stephens1992). Acemoglu and Robbins (Reference Acemoglu and Robinson2006) argue that the mobility of capital implies a higher tax rate on land than industries, which explains the resistance of landowners to a more egalitarian system. Consequently, countries that feature labor repressive systems remain undemocratic. The only path toward democracy is, therefore, to destroy the power of landed aristocrats. The antidemocratic nature of labor repressive agricultural systems does not imply that all agricultural systems are similarly antiegalitarian. Dahl (Reference Dahl1971) points out that agricultural systems that do not tie laborers to the soil tend to be more equitable. The lower economic inequality found in these systems leads to a more equal demonstration of political power as well. Consequently, they tend to be more supportive of democracy.
If a hegemonic landed aristocracy based upon labor repressive agriculture forestalls democracy, then destroying that hegemony is central to democratization. What can unseat the power of the dominant agricultural interests? For some, capitalist economic development creates new classes, the bourgeoisie (Moore Reference Moore1966) and the working class (Rueschemeyer et al. Reference Rueschemeyer, Stephens and Stephens1992) that can challenge the dominance of landowners. Modernization, therefore, unleashes processes that destroy the hegemony of the landed classes, paving the way for a more egalitarian distribution of economic and political power. Thus, democracy is linked to the destruction of labor repressive agriculture and the power of landed aristocrats.
This association between political oligarchy and labor repressive agriculture explains in part, we argue, the variation in electoral competitiveness in the early United States. The existing research on labor repressive agriculture suggests that the portion of slaves in a House district is associated with unequal distributions of economic and political power. We believe that the presence of a significant number of slaves is an indication of these inequalities, which leads to weaker electoral competition. Put another way, we hypothesize that slavery and the inequality it fosters undermined electoral competition in those regions where slavery was most prevalent, most notably in the American South.
If we are correct, then we should see evidence of political and economic inequalities created by slavery in the South during this period. Consider that in 1860, slaveholding “comprised far more national wealth than railroads and manufacturing enterprise combined” (Huston Reference Huston1999: 254), a figure estimated at 3 billion dollars (Deyle Reference Deyle2009). This wealth, however, was highly unequally distributed (Carey Reference Carey1997). In many states, only certain sections were suited for slave labor. Thus, slaveholding and wealth were often concentrated in particular parts of states. Moreover, slaveholding was often concentrated in the hands of a relatively few planters, further concentrating wealth disparities in Southern states.
The inequality in economic resources based on slaveholding translated into an unequal distribution of political influence in the antebellum South. Watson (Reference Watson1985: 274) argues that, “[S]lavery everywhere undergirded a pattern of political and economic privilege which seemed to discriminate against non-slaveholders.” Planters with large slaveholdings used their wealth to skew the political system in their favor (Cecil-Fronsman Reference Cecil-Fronsman1992). White landowners with small slaveholdings or those residing in Appalachia who typically had none, while possessing voting rights, were not able to contest the power of the large, slave-owning planters (Bolton Reference Bolton1994; Carey Reference Carey1997; Wells Reference Wells2009). In fact, slave owners created an atmosphere that undermined any type of “organized political dissent,” particularly dissent that was “hostile to the expansion of slavery” (Pessen Reference Pessen1980: 1139).
The political power of the slave-owning class impacted parties and elections during this period. In a study of antebellum Georgia, Carey (Reference Carey1997: xvi) writes that while white smallholders had some influence in the system, “The state of Georgia and Georgia's parties were, to be sure, run in the interests of planters and slaveholders, but they also served the interests of other men.” Voters often showed deference to the political interests of powerful planters who owned many slaves (Olsen Reference Olsen2000). Only “men of station” had the resources to compete for election (Abernethy Reference Abernethy2009: 126). In his analysis of voting in Jeffersonian Virginia, Risjord (Reference Risjord and Boles1973: 63) argues that:
Very rarely was there an electoral contest in which there was any apparent difference in social or economic status between candidates. Not only were the candidates invariably wealthy, they were often the wealthiest men in the county.
At various points, many Southern states had property requirements for holding office (Sydnor Reference Sydnor1948). While Virginia did not have property requirements to seek office, elections were dominated by local gentry often tied to the most powerful landowning families (Sydnor Reference Sydnor1948, Reference Sydnor1952).Footnote 6 The influence of planters on party and electoral politics pervaded the antebellum South, but it would be inaccurate to say that white smallholders did not participate in politics. In fact, they formed the majority of voters; however, the political system reflected the interests of the slave-owning class. Thus, “Expressions of Southern opinion on national questions. . .reflected in large measure the views of the Eastern, planting, slaveholding parts of the South” (Sydnor Reference Sydnor1948: 53).
Perhaps best articulated by Richards (Reference Richards2009), the slave power thesis holds that the slavery issue overshadowed, and frequently dominated, party politics from the founding to the Civil War. If viewed in terms of political power, it is indisputable that Southerners and almost always slaveholders, typically held the levers of national power from 1800 to the advent of the Civil War (ibid.: 8–9). In addition, although it appeared that Southern elites rarely spoke in unison regarding the slavery issue, their Northern opponents (e.g., Abraham Lincoln and William Henry Seward) spoke openly and repeatedly about the domination of a Southern “slaveocracy.” To be sure, among historians the slave power thesis is vigorously disputed (see Boucher Reference Boucher1921), but for our purposes the significance of the institution of slavery and its effects on sectional politics leads us to consider its impact in the realm of congressional elections.
More representative of feudal systems outside of the United States than perhaps above the Mason-Dixon Line, the slaveholding South strongly resembled an aristocracy in which the notion of anything resembling a democracy was laughable.Footnote 7 As slavery spread westward to the more recently admitted lower South states of Alabama, Mississippi, and Louisiana, the hierarchical structure of politics would become even more pronounced as white slaveholders were greatly outnumbered by their large slave populations. The number of qualified white candidates was severely diminished in these overwhelmingly African American settings in the heart of the Black Belt South (Key Reference Key1949). Southern patricians designed a political system that elevated their own privileged slaveholding class so that its members would be able to hold elective office in an electoral environment where competitiveness was minimized. In the next section, we describe our data and methods for testing this claim.
Data and Methods for Estimating Competitiveness
If our argument is correct, then an analysis of US House elections data should reveal significant differences in the level of competitiveness between districts during this period covering the first party system (1789–1827).Footnote 8 To test our argument, we calculate four measures of district competitiveness:
1. We use the percentage vote of the district winner, percent of vote (Bartels Reference Bartels1991; Kuklinski Reference Kuklinski1977; MacRae Reference MacRae1952). Large victory margins are a good measure of the dominance of the winning candidate over the remaining candidates. Consequently, larger margins are an indication of the weakness of competition in the election.
2. We code each House district according to the effective number of electoral parties (ENEP) (Laakso and Taagepera Reference Laakso and Taagepera1979).Footnote 9 This measure counts the number of parties and weights them by their percentage of the House vote. A greater effective number of parties is an indication of a more competitive, partisan environment.
3. We code each district according to the effective number of electoral candidates (ENEC) (Cox Reference Cox1997; Lijphart Reference Lijphart1994; Taagepera and Shugart Reference Taagepera and Shugart1989). The variable is similar to the effective number of parties; however, instead of counting the number of parties, it counts the number of candidates. Thus, it counts the number of candidates weighed by their percentage of the vote in the House election. More competitive districts are those with a greater number of effective candidates.
4. Finally, we create a dummy variable indicating whether the district is “competitive.” We define competitive districts as those where the winner won the district by less than 60 percent of the vote (Black and Black Reference Black and Black2002; Carson and Crespin Reference Carson and Crespin2004; Cox and Katz Reference Cox and Katz2002; Ferejohn Reference Ferejohn1977; Jacobson Reference Jacobson2004; Mayhew Reference Mayhew1974). Thus, this variable assesses competitive districts by using the 60 percent vote threshold.
We employ four different competitiveness measures for several reasons. First, we prefer measures employed in previous research to place our analysis in a broader context. Second, we believe that slavery impacted competitiveness among both parties and candidates. Finally, we believe that using four measures adds to the robustness of our findings because we can show that our results are not driven by the choice of the dependent variable.
Do we see a difference in district competitiveness between Southern and non-Southern states? For three of our measures, percent of vote, the ENEC, and the ENEP, we conduct difference in means tests between Southern and non-Southern states across the 19 congressional elections in our sample. Figure 3 plots the differences in the Southern and non-Southern means for these three measures of competition. The black symbols indicate whether the plotted difference is statistically significant at the 95 percent threshold. The gray symbols indicate a statistically insignificant difference in means test. For the competitive dummy variable, we conduct a difference in the proportions of competitive districts between Southern and non-Southern states in each of the 19 congressional elections in our sample. Again, the black symbols indicate whether the difference in proportions test is statistically significant.
District competitiveness by region.
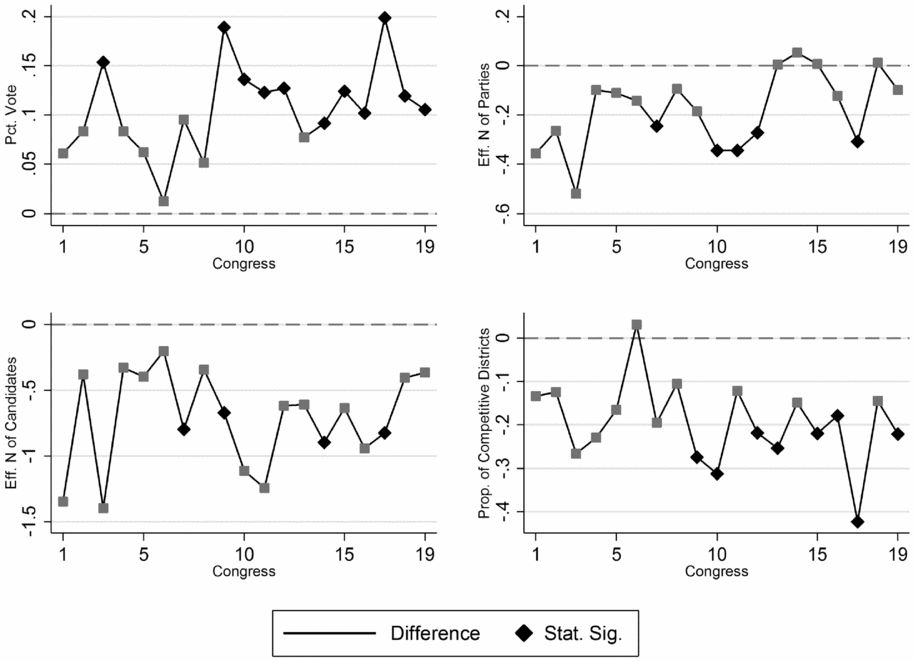
The plots of the differences in means and proportions for our measures of electoral competitiveness across our sample of congressional elections suggest that elections in Southern states were typically less competitive than were elections in non-Southern states. With few exceptions, Southern districts were less competitive over the first 19 Congresses than were non-Southern districts. In several congressional election cycles, these differences were statistically significant.
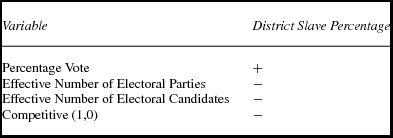
We contend that these differences are the result of the variation in slavery between Northern and Southern states. To test this argument, we develop a series of regression models using our four measures of electoral competitiveness as dependent variables. Our primary independent variable, district slave percentage, measures the number of slaves as a percentage of the total population in each district. With the use of county-level slave population data, county-level shapefiles, and congressional district shapefiles, we were able to overlay congressional districts on the county boundaries and then proceed to aggregate the county-level slave population to the House district.Footnote 10 Needless to say, this process of determining slave populations at the congressional district level is not without some degree of estimation, particularly because of many districts that were not drawn to conform to county boundaries. This said, we are fortunate that Southern districts, with their notably less dense populations (more rural settings) are more likely to align with county lines and, of course, the lion's share of slave populations reside in Southern congressional districts. Overall, we were able to compute almost three-quarters of district slave percentages across the first 20 US Congresses—an impressive feat given the issues outlined in the Appendix and the reality that there is substantial missing data in certain states for specific periods.Footnote 11 Table 1 reports the expected relationships between our main independent and dependent variables.
Expected relationship of variables
In all our models, we utilize a series of control variables. First, we include district magnitude, the number of seats per district. Thus, we can control for differences between single and multimember districts used in early congressional elections. There is a notable literature that finds a significant relationship between the number of parties and district magnitude (e.g., Clark and Golder Reference Clark and Golder2006; Duverger Reference Duverger1954).Footnote 12
Second, we include a dummy variable indicating “open seats,” which we define as those districts in which no incumbent ran for office. Open seats should be more competitive because the absence of an officeholder with significant incumbency advantages might attract more candidates (Carson and Hood Reference Carson and Hood2014; Gaddie and Bullock Reference Gaddie and Bullock2000; Jacobson Reference Jacobson2004). It also may mean that the margin of victory is, on average, smaller, given greater competition. We recognize that the institutionalization of the US House (Polsby Reference Polsby1968) and, by extension, congressional elections was far from complete in the first party system, but recent scholarship demonstrates that an incumbency advantage was present in our period (Carson and Hood Reference Carson and Hood2014) and shortly after the Civil War (Carson and Roberts Reference Carson and Roberts2013). Further, the length of tenure was markedly shorter in early Congresses (Glassman and Wilhelm Reference Glassman and Wilhelm2015; Kernell Reference Kernell1977) and our data reveal a sectional distinction in the first 19 Congresses with respect to time in office. The average tenure in the House was 2.64 Congresses in the South compared to 2.02 Congresses in the North (p < .001). Hence, even in the early days of Congress, we have descriptive evidence of more entrenched officeholding in the South—a finding that jibes with the expectation that the milieu of Southern politics, and slavery in particular, reduces competition in House elections.
Third, we include a dummy variable for each Congress. The Second Congress is the reference group. By including Congress fixed effects, we can control for differences between congressional elections. Finally, we include a measure of the total population of each House district. As with the district slave percentage variable, we used county-level total population data, county-level shapefiles, and congressional district shapefiles to overlay congressional districts on the county boundaries and then proceed to aggregate the county-level population to the House district. (A detailed accounting of this process can be found in the Appendix.) We use this as a proxy for urbanization.
To estimate the impact of slavery on district competitiveness, we opt for three-level hierarchical regression models:
 $$\begin{equation*}
{Y_{dcs}} = \alpha + {\beta _1}*{X_{dcs}} + {\Upsilon _{dcs}}*\beta + \zeta _{ds}^{\left( 2 \right)} + \zeta _s^{\left( 3 \right)} + {\epsilon _{dcs}}.
\end{equation*}$$
Where Ydcs is one of our four measures of competitiveness in district d, during congressional election c, in state s. Xdcs is our main independent variable—district slave percentage. Υdcs is a vector of control variables. We include random effects for districts nested in state, ζ(2)ds, and for states, ζ(3)s. It is possible that different electoral districts or states will have different error variances. By estimating random effects for districts, we can control for this possibility. For our first three continuous dependent variables, we estimate hierarchical linear models. For our final, binary variable, we estimate hierarchical logit models.
Wooldridge tests for autocorrelation found evidence of autocorrelation in all our models. For the percentage vote of the district winner, ENEP, and ENEC's models, we include an AR(1) correction to control for autocorrelation. In our models using the competitive dummy variable, we follow Carter and Signorino (Reference Carter and Signorino2010) and include a variable for time, as well as squared and cubed versions of time.
Results
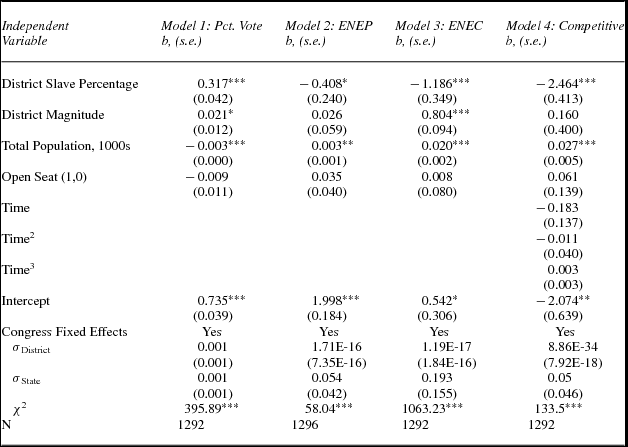
Table 2 presents the parameter estimates of four models, each using a different measure of electoral competitiveness. The results of Table 2 provide strong support for the effect of district slave percentage across all four specifications. In Model 1, district slave percentage is positively correlated with percentage of vote and statistically significant. The district slave percentage variable is, as expected, negatively correlated and statistically significant with ENEP (Model 2), ENEC (Model 3), and the competitive variable (Model 4).
Model estimates—District competitiveness and state-level variables
*p < 0.10. **p < 0.05. ***p < 0.001.
The results also show some support for the notion that district magnitude is related to competitiveness; however, its pattern is inconsistent. The variable is statistically significant in Models 1 and 3, and statistically insignificant in Models 2 and 4. The effect is mixed. In Model 1, district magnitude appears to undermine competitiveness, while enhancing it in Model 3.
The size of the population in the district impacted competitiveness across all models. As population increased, so did the competitiveness of elections. The total population variable is statistically significant in all models. Increasing population decreases the percentage vote of the winner variable but increases the ENEC, the ENEP, and the likelihood of a competitive election. However, contrary to expectations, there is scant evidence that open seats are more competitive. The open-seat dummy variable is statistically insignificant across all specifications.
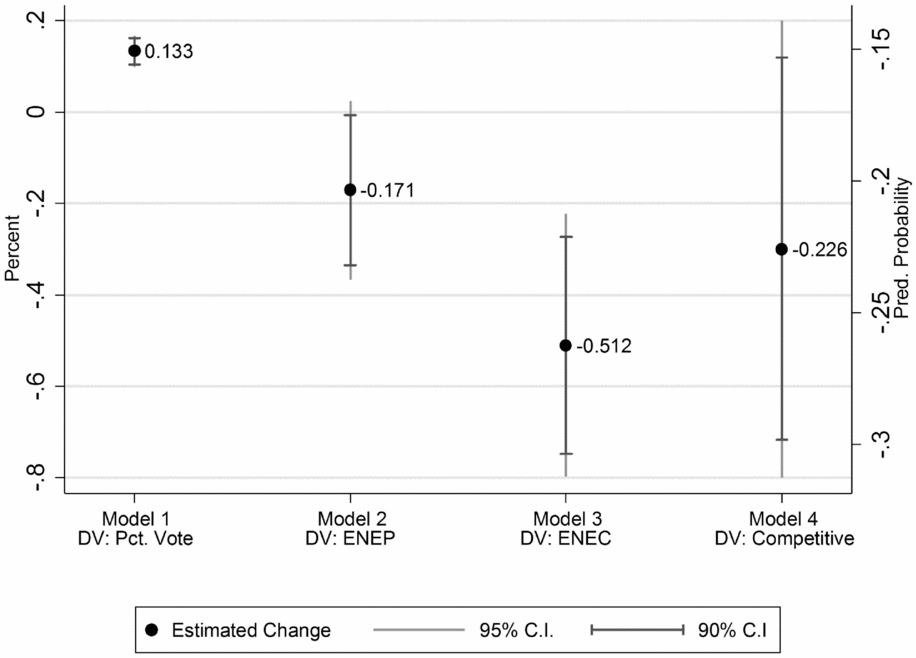
To assess the substantive impact of our main independent variable, district slave percentage, we estimated changes in the expected values of each competitiveness measure across all four models. In each specification, we set the district magnitude and other controls at their means. The open-seat variable is set to 0 (an incumbent seeking reelection). For all models, we calculated the difference of increasing the district slave percentage variable from 0 to 1 standard deviation above its mean. We calculated the predicted values using 10,000 Monte Carlo simulations to account for uncertainty (King et al. Reference King, Tomz and Wittenberg2000).
Figure 4 plots the first differences and confidence intervals of the expected values for each model. The estimates show a strong, substantive effect for our main independent variable. For Model 1, the increase of district slave percentage from 0 to 1 standard deviation above its mean increases the expected percentage of vote (Pct. Vote) by more than 13 percent. The expected value of the ENEP in Model 2, decreases by more than 17 percent with a similar change in the district slavery percentage. The results for Model 3, the ENEC, show a substantial impact. A one standard deviation increase in district slave percentage decreases the expected number of electoral candidates by more than 50 percent. Finally, we see another substantive impact of the change in district slave percentage in Model 4, which estimates the influence of the competitive variable. Increasing the district slave percentage from 0 to 1 standard deviation above its mean, decreases the probability of a competitive district by nearly 23 percent.
First differences of expected values, Models 1-4.
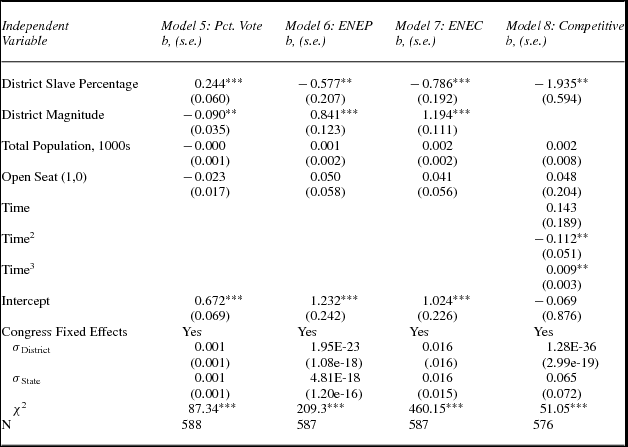
These initial models find strong support for our argument that slavery decreased the competitiveness of congressional elections. One concern, however, arises from the fact that slavery, especially in later periods, was concentrated primarily in the South. While we controlled for states and districts in our models, we remain concerned that the results might simply reflect differences between the South and other regions and not between districts within the South. To test for this, we reestimated our first four models using data only from Southern states.Footnote 13 If our argument is correct, then we would expect that differences in rates of slaveholding between Southern congressional districts should lead to differences in levels of competition. Table 3 reports the parameter estimates for our models using only Southern states.
Model estimates—District competitiveness and state-level variables, South only
*p < 0.10. **p < 0.05. ***p < 0.001.
The results for our South-only models support our argument. In Model 5, we find that the district slave percentage variable is positively correlated and statistically significant with the percentage of vote variable. We also find that the variable is negatively correlated and statistically significant with the effective number of electoral political parties (Model 6), the ENEC (Model 7), and the competitive dependent variable (Model 8). Thus, our models find strong evidence that variation in the prevalence of slavery at the district level explains differences in electoral competition even within Southern states.
The control variables have effects different from the previous models. We find more consistent support for the notion that higher district magnitudes increase competitiveness. The district magnitude variable is statistically significant and correlated with competitiveness in Models 5 through 7. Unfortunately, the variable was dropped due to collinearity in Model 8. Neither differences in total population nor open seats independently affect competition in these models confined to Southern states.
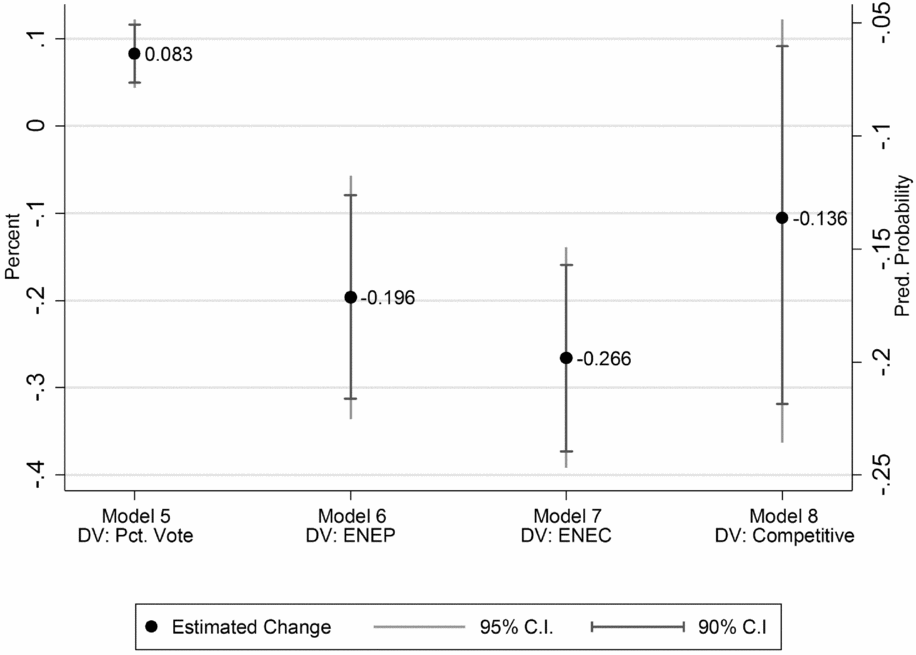
Figure 5 plots the expected values and confidence intervals for Models 5 through 8. We estimated the results using the same process as discussed earlier. We plot the impact of increasing the district slave percentage variable from one standard deviation below its mean to one standard deviation above, for all South-only models. The plotted first differences show substantively significant impacts of increasing district-level slavery for all dependent variables. Increasing district-level slavery increases the percentage of vote (Pct. Vote) by more than 8 percent (Model 5). A similar increase in slavery decreases the ENEP by nearly 20 percent (Model 6) and ENEC by more than 26 percent (Model 7). In addition, a higher district slave population decreased the probability of a competitive election by more than 13 percent (Model 8).
First differences of expected values, South only, Models 5-8.
Conclusion
Decades before the Civil War, in fact by the time of the early 1800s, the American party system had taken shape and developed a pronounced sectional cleavage over the slavery issue. The North–South divide grew as the peculiar institution expanded both in size and scope as Southerners moved westward in search of more fertile fields to cultivate King Cotton and other cash crops. The growth of slavery became a direct affront to the North, especially because the lack of slave owners in this section meant that they fiercely resisted the encroachment of the peculiar institution into new territories desirable for Northern white settlement (recall “Bleeding Kansas”).
In this study, we sought to understand how slavery impacted the electoral politics of the early American Congress. There is significant literature that links the presence of slavery and other forms of labor repressive agriculture to the absence of democracy. Our contention is that the concentration of slavery in certain sections of the country similarly affected electoral competitiveness. Our empirical analysis finds that increasing levels of slavery in congressional districts were associated with weaker levels of electoral competition in early US House elections. Slavery concentrated economic power in the hands of slave owners, which concomitantly concentrated political power within their hands as well. This slavery-based oligarchy, we contend, explains, in part, the relatively weaker level of electoral competition among districts with high levels of slavery in comparison with other districts.
By contrast, a relatively more democratic political environment in the North opened the door to more competitive elections. And with greater political competition came the need for Northern representatives to articulate clear positions on issues of concern to a more participatory Northern electorate that had the power to punish.Footnote 14 Indeed, perhaps no better example of the electoral consequences of greater party discipline in the North, takes place decades after the period we study. In the 1850s, Northern Democrats who were aligned with Southern Democrats “paid dearly at the polls” and did so in part because:
They were accused [by Republicans] of being allies of the Slave Power, of complicitly [sic] allowing the slave oligarchs to run the nation, of selling out to their Southern colleagues for a few measly positions in the national Democratic hierarchy. (Richards Reference Richards2009: 4)
Slavery never dominated the South, but slaveholders did. The majority of white Southerners never owned a slave but those who did, and their lineage, controlled Dixie's economic and political system from the founding to the middle of the twentieth century. The minority of whites who operated the slave economy made sure they protected their investment by dominating the political system.
As Key (Reference Key1949) pointed out, the whites of the South's Black Belt counties were heavily outnumbered by African Americans, and yet they convinced a majority of the white population to secede from the Union, led the charge to redeem their state and local governments from Republican-led Reconstruction rule, instituted Jim Crow, put down the Populist Revolt of the 1890s, and installed a one-party Democratic Solid South that persisted into the 1960s. In sum, the slaveholding aristocracy and their progeny (Acharya et al. Reference Acharya, Blackwell and Sen2016; Kousser Reference Kousser1974), managed to control Southern politics for most of American history and the linchpin of their success was tied to structuring elections in a manner that limited competition. By stifling political competition, slaveholders thwarted an inside threat to the peculiar institution, while regional unity delayed the outside threat, and alliances with Northern politicians prolonged the preservation of bonded servitude.
We have uncovered robust evidence that a substantial presence of slaveholding dampens competition in early US House elections. This finding strongly supports the slave power thesis. The lucrative but increasingly controversial practice of slavery could only persist by blocking avenues of political opposition in the electoral arena. Thus, once an opponent of slavery won the White House, the Southern aristocracy suspected it was game over and proceeded to leave the Union. But several decades before the fateful 1860 election, competition was curtailed in slaveholding strongholds and perhaps in the back of these planters’ minds, they understood that squelching competition would postpone the day of reckoning.
Appendix
There were several steps taken to aggregate the county-level census data to the congressional districts used in the analysis. The first task was to identify which congressional district boundaries were in alignment with historic county boundaries. Using historical congressional district boundary shapefiles provided by the Digital Boundary Definitions of United States Congressional Districts project, any congressional districts that were identified in the shapefiles as having boundaries that were based on county boundaries were extracted into new shapefiles. The congressional districts that were not identified as having county-based boundaries were also extracted into separate shapefiles and then overlaid on top of two historical sets of census county boundary shapefiles, which were obtained from the National Historical Geographic Information System project and the Newberry Library's Atlas on Historical County Boundaries. Any congressional district that had boundaries matching the county boundaries in either of the county boundary district shapefiles was considered a county-based district and was added back to the original set of county-based districts. The same process was also applied to the original set of congressional districts that were identified as being based on county boundaries. Doing so ensured that all county-based congressional districts were based on county boundaries that existed at the time when the census data used in the analysis were collected. Once all the county-based districts were accounted for, census data containing county-level total and slave populations were aggregated to the congressional districts with county-based boundaries. Any congressional districts that did not have both total population and slave population census data aggregated to them were removed from the final data set.
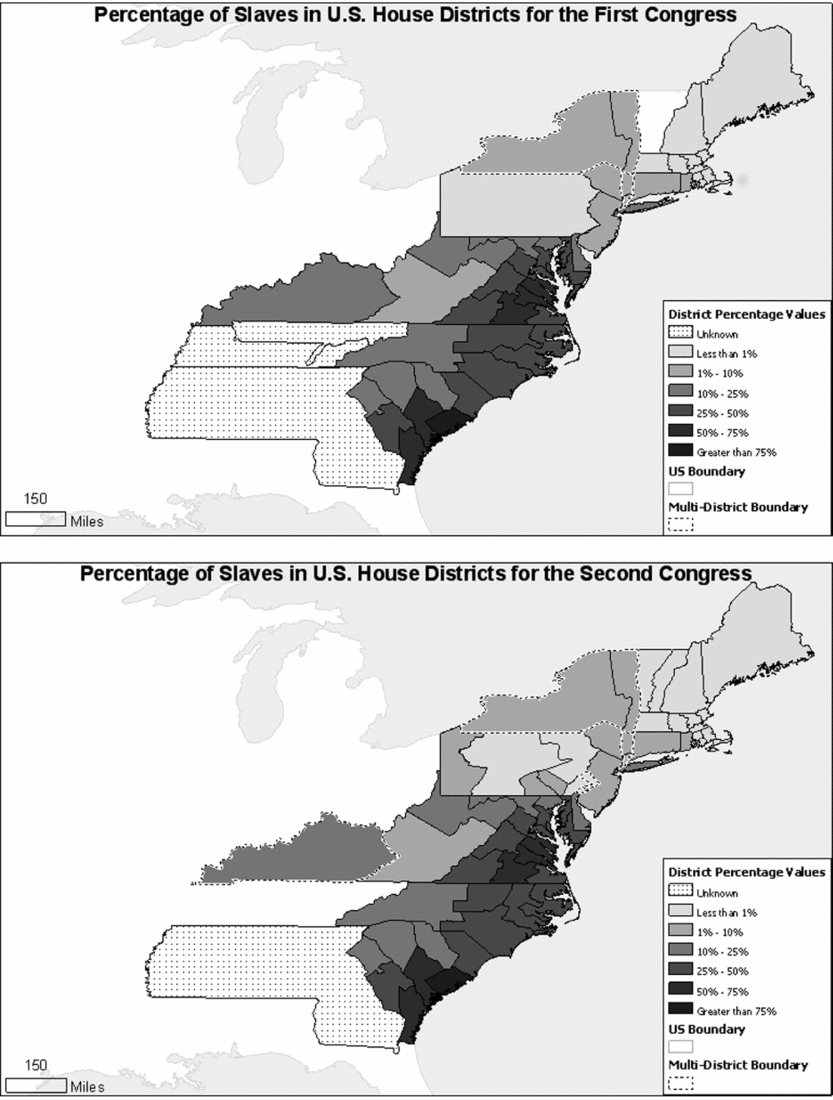
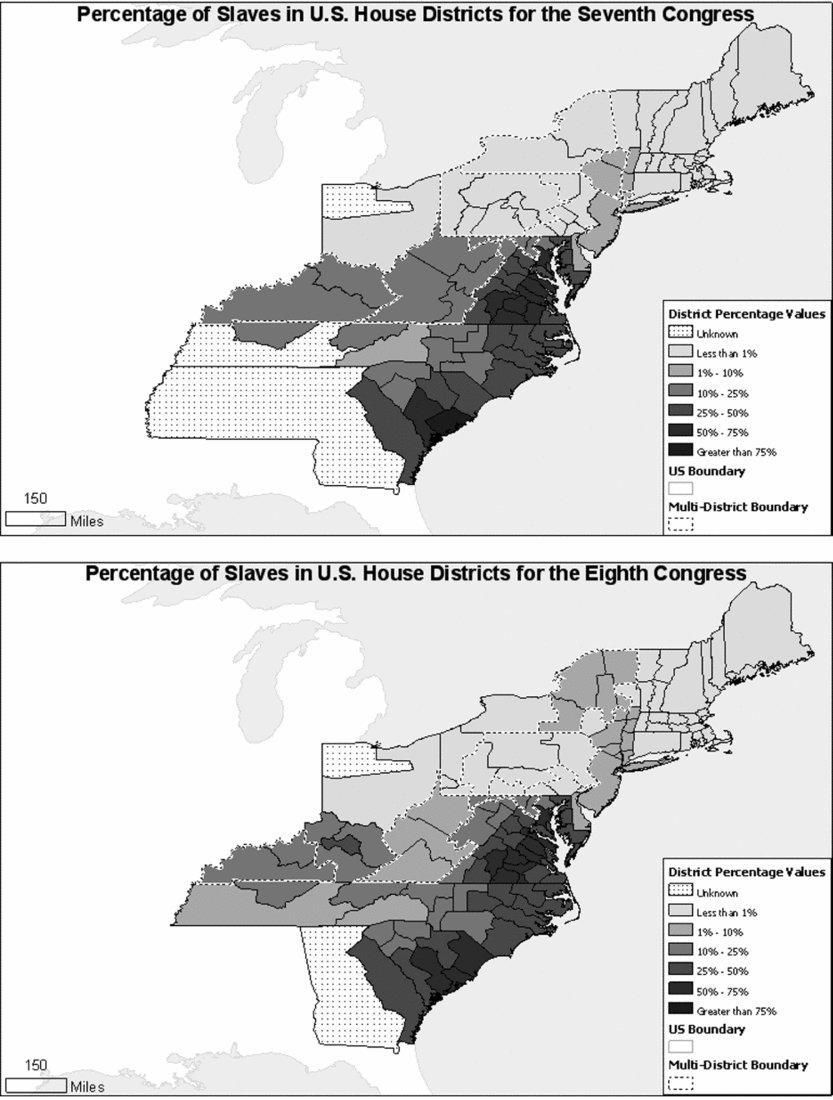
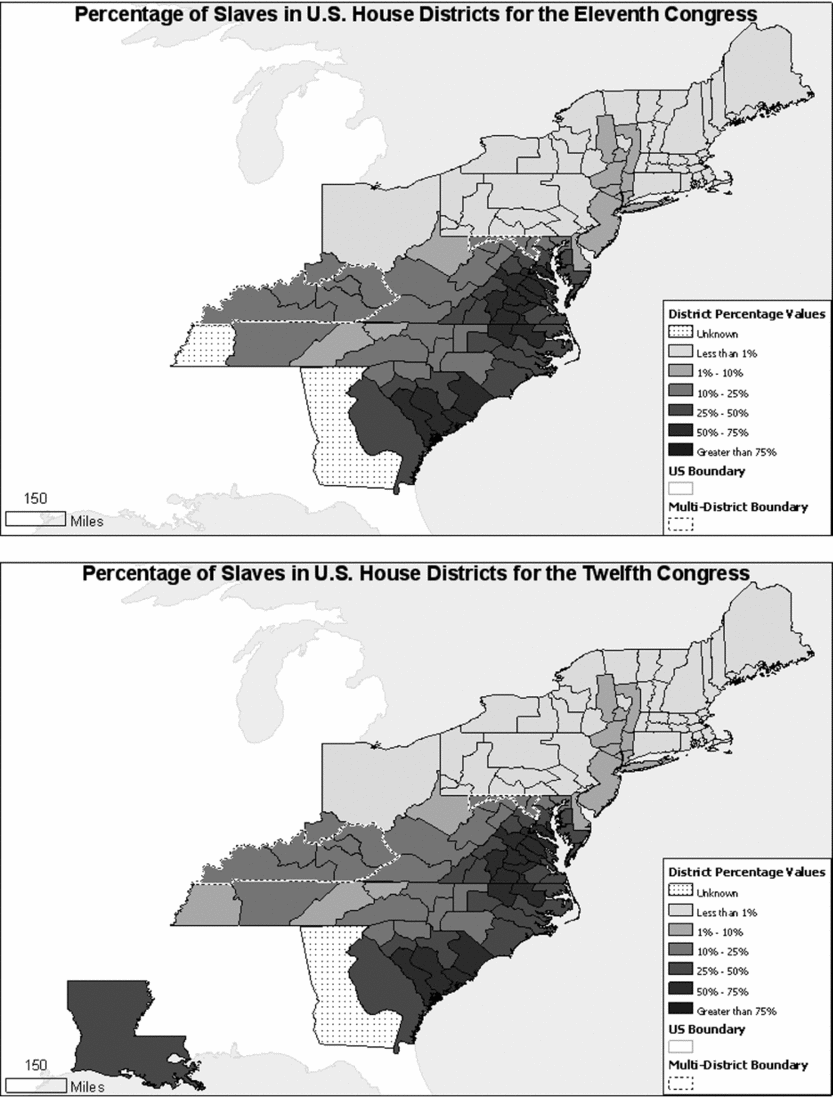
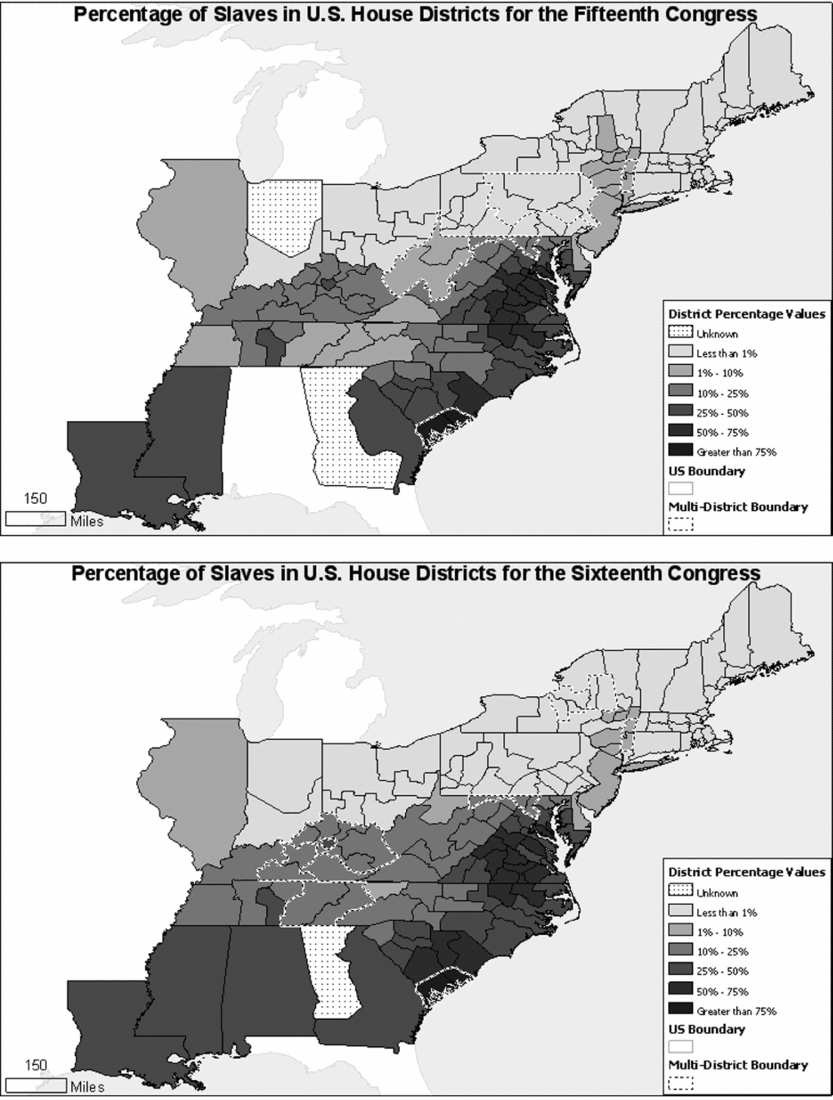
The resulting figures show the slave population as a percentage of the total population in US House districts for select Congresses. For space considerations, here we show maps for the following Congresses: First and Second (1789–93), Seventh and Eighth (1801–5), Eleventh and Twelfth (1809–13), Fifteenth and Sixteenth (1817–21), and Nineteenth and Twentieth (1825–29). Hence, we show maps for the first and last Congress in our study and three in between that occur right around the time of the corresponding decennial census. It was possible to determine the percentage of slaves for about 73 percent of the US House districts from the first 20 Congresses. Congressional districts that do not have a slave population percentage value are classified in the maps as Unknown. A district is classified as having an unknown value if at least one of the following circumstances applies to it: (1) the district did not align with county boundaries from the time when the corresponding census data were collected, (2) the district was originally identified as being an Indian Territory, or (3) the counties within the district were missing census data. The remaining districts are classified into one of the following five categories: (1) the percentage of slaves was less than 1 percent of the total population in the district, (2) the percentage of slaves was between 1 and 5 percent of the total population in the district, (3) the percentage of slaves was between 5 and 30 percent of the total population in the district, (4) the percentage of slaves was between 30 and 55 percent of the total population in the district, or (5) the percentage of slaves was greater than 55 percent of the total population in the district. Data sources used to aggregate county-level slave data to the congressional district: Lewis et al. (Reference Lewis, DeVine, Pitcher and Martis2013); Minnesota Population Center (2011); and Siczewicz (Reference Siczewicz and Long2011).
Presence of slavery in House districts, First and Second Congress.
Presence of slavery in House districts, Seventh and Eighth Congress.
Presence of slavery in House districts, Eleventh and Twelve Congress.
Presence of slavery in House districts, Fifteenth and Sixteenth Congress.
Presence of slavery in House districts, Nineteenth and Twentieth Congress.



