I. INTRODUCTION
Metal–insulator–metal (MIM) diodes have been used for the past ∼35 years as harmonic generators and mixers of sub-millimeter and infrared radiation and currently hold the record for the fastest diode operation at ∼150 THz. Reference Grossman, Harvey and Reintsema1 Potential applications for terahertz frequency alternating current (AC) to direct current (DC) signal rectification include rectenna-based solar energy harvesting, Reference Eliasson2–Reference Osgood, Kimball and Carlson5 terahertz electronics, infrared sensors or cameras, Reference Bean, Tiwari, Szakmány, Bernstein, Fay, Porod, Baatar, Porod and Roska6–Reference Grover, Dmitriyeva, Estes and Moddel8 and chemical sensors. Reference Rosenfeld, Schmid, Szeles, Levy, Demarne and Grisel9 Fast switching in these devices is believed to be enabled by the tunneling of electrons through the insulator layer. Initially, MIM diodes took the form of point‐contact diodes where a metallic whisker, electrochemically sharpened to a radius of 0.05–0.2 μm, touches a native oxide layer 1–8-nm thick on a metallic film to form a metal-insulator-metal (MIM) stack. Reference Masalmeh, Stadermann and Korving10 The advantage of this relatively crude approach is the self-defined small diode area, which gives excellent high‐frequency performance. Reference Masalmeh, Stadermann and Korving10–Reference Ward, Huser, Pauly, Cuevas and Natelson12 Another approach to MIM arrays uses a planar diode geometry that solves the scalability challenge by its compatibility with semiconductor processing or nano-transfer printing. Reference Choi, Yesilkoy, Ryu, Cho, Goldsman, Dagenais and Peckerar7,Reference Bareiss, Ante, Kalblein, Jegert, Jirauschek, Scarpa, Fabel, Nelson, Timp, Zschieschang, Klauk, Porod and Lugli13 However, in planar devices, decoupling optimal MIM device composition and insulator thickness from processing issues is difficult. The influence of material properties on MIM diode nonlinearity and asymmetry can been explored more directly by contacting metal–insulator bilayers with bent metal wires, Reference Periasamy, Bergeson, Parilla, Ginley and O'Hayre14–Reference Periasamy, Guthrey, Abdulagatov, Ndione, Berry, Ginley, George, Parilla and O'Hayre16 allowing rapid screening of material combinations but providing little control over the active device geometry. Further investigation of tunneling in MIM point contacts has been conducted using atomic force microscopy to impart a greater level of control over forming the nanoscale junction, though these studies have historically been restricted to soft, organic insulators, Reference Beebe, Kim, Gadzuk, Frisbie and Kushmerick17–Reference Kim, Pradeep, DelRio and Cook20 rather than the stiff, high-dielectric oxides most often used in MIM devices. Tunneling barrier parameters have been extracted from current–voltage curves performed while a conductive-atomic force microscope (C-AFM) tip is held in contact with a sample surface by a force that is inferred from the cantilever spring constant.
The nanoindentation-based approach described in this work is similar to C-AFM where a metal tip is used to acquire current–voltage measurements, typically by biasing the sample. Reference Kelley and Frisbie19–Reference Olbrich, Ebersberger and Boit21 For MIM diode characterization, however, conductive mode nanoindentation offers several important advantages over C-AFM for the present study, including:
-
(i) The nanoindenter can operate in both force- and displacement-controlled modes, with feedback and measurement provided by a low-drift electrostatic transducer.
-
(ii) The radius of the nanoindenter tip is at least 10 times larger than that of a typical AFM tip. Hence the nanoindenter tip can support larger currents and provide lower current density for equivalent current, potentially reducing nanooxidation Reference Shirakashi, Matsumoto, Miura and Konagai22 at the tip/sample contact.
-
(iii) The diamond-based tip is less susceptible to wear and deformation from test-to-test and sample-to-sample than C-AFM tips—a feature that is crucial for reliable material screening studies.
-
(iv) The larger force range (1 μN–10 mN) provided by nanoindentation can allow penetration of stiff materials, such as the oxide materials typically used in high performance MIM systems.
Here, a metal–insulator combination previously demonstrated by this group Reference Periasamy, Berry, Dameron, Bergeson, Ginley, O'Hayre and Parilla15,Reference Periasamy, Guthrey, Abdulagatov, Ndione, Berry, Ginley, George, Parilla and O'Hayre16 to show superior performance in bent-wire tests was subjected to in situ electrical measurements during contact with known forces and sub-nanometer displacement precision, precisely controlling the junction geometry. Experiments were designed to demonstrate the capability of the technique and to explore potential relationships between tunneling distance and current–voltage (I–V) behavior systematically by varying the penetration of the indenter tip into oxides of various thicknesses. Consistent observations across all data sets demonstrate that MIM I–V behavior can be actively tuned via nanoindentation and that the resulting data can be modeled using a Fowler–Nordheim approximation to describe the electron field emission across the barrier.
II. EXPERIMENTAL METHODS
Simultaneous measurement of both electrical and nano-mechanical information was accomplished using a nanoindentation apparatus equipped with a conductive tip and circuit analyzer. Reference Bhaskaran, Sriram, Ruffell and Mitchell23,Reference Ruffell, Bradby, Williams and Warren24 A conductive nanoindenter tip, composed of degeneratively boron-doped diamond, served as the point-contact “metal” in the MIM structure. Sputtered niobium formed the base metal, while the insulator was composed of a continuous layer of native oxide (NbO x ) approximately 5-nm thick Reference Grundner and Halbritter25 and a layer of Nb2O5 formed by anodization, the thickness of which was intentionally varied. Samples were fabricated on p-type Si wafers (Silicon Quest Internationals) with <100> orientation and a resistivity between 1 and 10 Ω cm. The Nb metal layers were deposited via DC magnetron sputtering using a 2-inch Nb metal target (Alfa Aesar, Ward Hill, MA). After achieving a base pressure of at most 3 × 10⁻⁶ Torr, 90–100-nm-thick Nb metal films were deposited at a working pressure of 5 mTorr of Ar gas by DC sputtering. The Nb2O5 layers were formed by anodization in a 1 M H2SO4 electrolyte solution at room temperature under potentiostatic conditions. Anodic oxides of different thickness were grown by varying the anodization voltage. Reference Periasamy, Berry, Dameron, Bergeson, Ginley, O'Hayre and Parilla15 The anodic oxide growth coefficient was estimated to be 2.4 ± 0.3 nm/V through a series of samples anodized at different voltages and measured by x-ray reflectivity (XRR). Reference Periasamy, Berry, Dameron, Bergeson, Ginley, O'Hayre and Parilla15 XRR measurements were carried out on a Philips X’Pert five-circle diffractometer (Almelo, Netherlands) with specular XRR scan assuming 1.5416 Å radiation. The sample angle (Ω) started at 300 s and finished at 8000 s with a step size of 25 s. Simultaneously, the detector angle (2θ) started at 600 s and finished at 16,000 s with a step size of 50 s. The thickness was independently verified by ellipsometry and transmission electron microscopy for selected samples. Reference Periasamy, Guthrey, Abdulagatov, Ndione, Berry, Ginley, George, Parilla and O'Hayre16 Fresh electrolyte solution was prepared for each anodization process to avoid accumulation of Nb metal ions in the electrolyte solution. During anodization, a portion of the Nb film was not oxidized i.e., not immersed in the electrolyte solution. This nonoxidized area acted as an electrical contact to the Nb layer during I–V measurements. For simplicity, combined oxide thicknesses (5-nm native oxide plus anodized layer thickness) are reported in this manuscript and referred to as Nb2O5. Thus, the MIM structure consisted of Nb/Nb2O5/B-Diamond, with the dynamically controlled contact of the B-Diamond tip completing the MIM structure.
Rectification performance was characterized by measuring the current–voltage (I–V) response while applying bias to the sample’s Nb-metal layer against the grounded tip. I–V measurements were carried out in a Hysitron TI 950 nanoindenter (Minneapolis, MN) equipped with nanoECR, a commercially available package that allows in situ electrical measurements. According to information provided by the manufacturer, the diamond tip had a boron dopant concentration of ∼1022/cm3 (Ref. Reference Bhaskaran, Sriram, Ruffell and Mitchell23) and a resistivity value of ∼3.3 Ω cm. The apex of the tip had a radius of approximately 50 nm. Silver paint (Pella PELCO conductive silver) provided electrical connection from the nonoxidized area of each sample to the biasing stage. Indentations were performed with a minimum lateral spacing of 5 μm in displacement-controlled mode with a loading function that loads to the maximum displacement over 2 s, holds at that displacement for 46 s, and unloads over 2 s. Electrical measurements were conducted during the displacement hold section of each test, with the electrical source compliance (voltage limit) set to 10 V and the A/D parameter set to 1 for each test. In this study, the polarity defined by the instrumentation was used; therefore negative voltages correspond to the forward bias condition as defined in the MIM literature. All tests were conducted by manually sourcing current and measuring voltage in a series of stepped increases. Current was increased over a range of 1–1024 nA, doubling the current at each step and allowing a settle time of 3 s at 1 nA and 1.5 s for all other currents. Following a stepwise increase in current in the positive direction, the procedure was repeated for negative currents in the same manner. The voltage associated with each current was calculated by averaging the data from the final 1 s of each current step. This procedure was developed due to limitations of the sourcemeter in measuring highly capacitive samples. It should also be noted that the B-diamond tips are not ideal electrical contacts in that they are known to exhibit tip to tip variations in resistance due to dopant distribution inhomogeneities Reference Sprouster, Ruffell, Bradby, Williams, Lockrey, Phillips, Major and Warren26 ; therefore, a single tip was used throughout this study to minimize this impact.
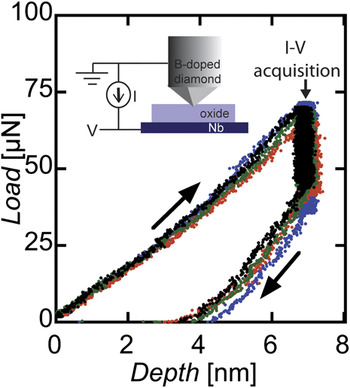
Figure 1 shows a schematic of the testing set-up and protocol. Throughout this study, nanoindentation was conducted in displacement-control mode to ensure consistent contact area between the tip and oxide. As shown in Fig. 1, loading involved contact of the B-diamond tip into the bilayer until a preset displacement value (h max) was reached, after which the I–V response was acquired. Finally, the tip was unloaded. Indentation depths of 4, 7, and 10 nm and oxide thicknesses of 5, 10, and 16 nm were explored. Six nominally identical tests were performed for each set of conditions.
Load–depth response acquired during 4 independent indentation experiments into an Nb/16-nm-thick Nb2O5 bilayer to a depth (h max) of 7 nm, where electrical measurements (I–V) are collected. Arrows represent loading and unloading directions. The inset in Fig. 1(a) is a schematic representation of the electrical measurement setup used in this study.

III. RESULTS AND DISCUSSION
Sub-nanometer displacement accuracy during tests ensured a constant contact area for independent measurements and hence a consistent MIM structure from test to test, which was reflected in the reproducibility of the electrical measurements acquired at h max. Figure 1 shows the results of four nominally identical indentations performed to a maximum depth (h max) of 7 nm at different locations on the 16-nm-thick oxide sample. For each of these tests, the load–displacement (P–h) response followed an identical path at extremely low loads where elastic contact dominates, followed by discrete and stochastic behavior consistent with nanoscale plastic deformation until reaching an h max value of 7 nm. Each curve unloaded along the same path by elastic recovery to similar residual displacements representing plastic deformation. Recording the P–h response in addition to the I–V response helped to identify possible contamination on the tip or the bilayer surface. Any surface contamination on the tip or sample can alter the slope of the loading region of the P–h curve, allowing errant data to be removed from analysis.
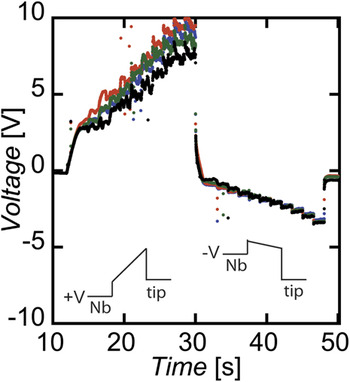
Figure 2 shows the electrical measurements corresponding to the indentation curves in Fig. 1. Data set color-coding (available online) is matched between Figs. 1 and 2. The shape of the voltage response was consistent for each of the four curves shown and for all other experiments in this study. Outlier points that deviate significantly from the bulk of the data (see times around 20 s and 32 s in Fig. 2) resulted from automatic ranging shifts in the source meter and are discarded from calculations of the settle voltage at each current. Negative current flow was seen to require generally lower voltages than positive current flow, consistent with the barriers represented by the schematic band diagrams illustrated in Fig. 2. For a given voltage, the magnitude of the current was exponentially dependent on a product of the distance that the electrons must tunnel across and the effective barrier height. The distance will depend on the band structure across the junction and this, in turn, depends on the work functions of the conductors and the electronic affinity of the insulator. For this situation, with the Nb as one metal and the B-diamond tip as the other, we expect the barrier heights at the two conductor/oxide junctions to be vastly different, leading to the differences between forward and reverse biases. In this study, we used the polarity defined by the instrumentation; therefore negative voltages correspond to the forward bias condition as defined in the MIM literature. For negative currents, electrons are flowing from Nb to the tip, corresponding to a negative voltage on Nb with respect to the tip. For a given current, a lower magnitude voltage was required for electron flow from Nb to the tip due to the lower relative barrier height.
Voltage response measured while conducting stepwise increases in current between 1 nA and 1.024 μA in +/− bias for the curves in Fig. 1 and qualitative band diagrams approximating the conditions in the positive and negative bias conditions.

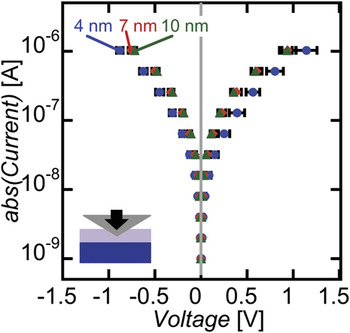
If tunneling is responsible for the observed asymmetric current–voltage (I–V) behavior in Fig. 2, the results should show a marked dependence on the distance through which electrons must travel. This point was systematically investigated through probing oxides of various thicknesses to different indentation depths. Figure 3 compiles the current–voltage data for in situ measurements conducted to indentation depths of 4–10 nm on a sample with a 5-nm-thick oxide layer. In each data set in this figure and throughout the paper, each point represents the average settle voltage from 6 nominally identical tests at different sites on the same sample, with error bars representing the standard deviation of those values. Despite differences in the expected barrier heights of the Nb/Nb2O5 and B-doped diamond/Nb2O5 junctions, symmetric I–V behavior about the gray vertical line drawn at V = 0 was observed for each of the indentation depths. The origin of the symmetric behavior is examined in more detail in Sec. IV. As indentation depth was increased, there was only a slight difference in the average voltage required to reach a given current, with error bars from the 7- and 10-nm depths overlapping significantly. It should be noted that even though the 7- and 10-nm indentation depths were larger than the oxide layer thickness, the persistence of non-Ohmic behavior indicated that the complete penetration of the oxide was unlikely and that at least some of the deformation was accommodated by the Nb film underneath the oxide. Such a scenario was possible since the Nb2O5 layer, an insulating oxide, was relatively hard compared with the underlying soft metallic Nb layer. In such a hard film (Nb2O5) on soft substrate (Nb) condition, the underlying Nb may have accommodated a significant portion of the deformation. Reference Tsui, Vlassak and Nix27 For the smallest indentation depth of 4 nm, the data showed a slight, but consistent, trend toward larger voltages for the same currents. Overall, varying indentation depth from 4 to 10 nm did not substantially affect the I–V behavior in the 5-nm-thick oxide sample.
Current–voltage behavior variation with indentation depth (h max = 4, 7, 10 nm) in an Nb/5-nm-thick Nb2O5 oxide layer. Error bars represent the standard deviation of 6 measurements obtained at distinct locations across the sample for each data point. Symmetric behavior is observed.

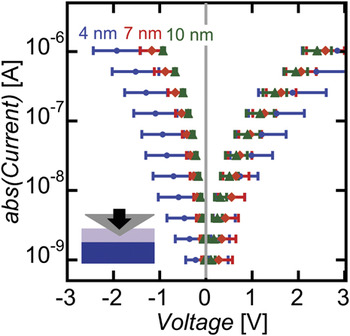
Increasing the oxide thickness to 10 nm while maintaining equivalent indentation depths produced more distinct changes in the I–V behavior. Figure 4 shows that the thicker oxide required higher voltages to produce the same range of currents shown in Fig. 3. Furthermore, as indentation depth was increased from 4 to 10 nm, lower average voltages were consistently required to reach equivalent currents across the entire range. Shifts in the averages were clear despite overlap between data error bars. The shift to lower voltages for larger indentation depths is consistent with the reduction of the effective oxide thickness in the area of indentation due to penetration of the oxide by the tip. Even small reductions in the effective oxide thickness can impact I–V behavior due to the exponential dependence of electronic tunneling on barrier thickness. An additional distinguishing feature of Fig. 4 was that an asymmetry develops between positive and negative voltages, with positive current flow requiring higher voltages.
Current–voltage behavior variation with indentation depth (h max = 4, 7, 10 nm) in an Nb/10-nm-thick Nb2O5 oxide layer. Error bars represent the standard deviation of 6 measurements obtained at distinct locations across the sample for each data point. Asymmetric behavior is observed, and slightly lower voltage is required to reach equivalent currents as the effective oxide thickness decreases.

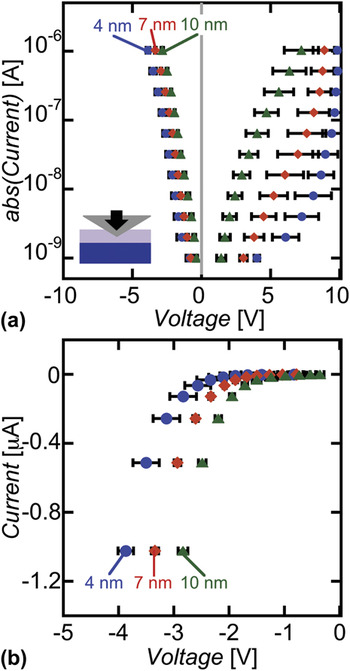
The trends in voltage and asymmetry observed in the 10-nm-thick oxide sample persisted and were further amplified when the oxide was increased to 16-nm-thick. Figure 5(a) shows that nearly −5 V was required to reach 1 μA, as compared to −1 to −2 V seen in Fig. 4. Pronounced asymmetry across V = 0 was observed with substantially lower voltage required for conduction at each current level in negative bias. The apparent change in curvature in the data from 7- to 10-nm indentation depths at high positive voltages was an artifact of the data acquisition setup and does not reflect some physical phenomena with respect to the tunneling behavior. The compliance limit of 10 V prevented application of voltages high enough to meet the current setpoints; thus, the data were artificially screened to <10 V. The trends in the negative voltage range were more readily observed with an expanded voltage scale and a linear current axis, as in Fig. 5(b). Increasing indentation depth consistently lowered the required voltage, producing a shift that was greater than the error. At −1 μA, the voltage was tuned over >1 V by small changes in indentation depth. These shifts demonstrate that the I–V behavior of MIM point contacts consisting of a hard oxide-based insulator layer can be mechanically tuned.
Current–voltage behavior variation with indentation depth (h max = 4, 7, 10 nm) in an Nb/16-nm-thick Nb2O5 oxide layer. Error bars represent the standard deviation of 6 measurements obtained at distinct locations across the sample for each data point. (a) Asymmetric behavior is observed, and lower voltage is required to reach equivalent currents as the effective oxide thickness decreases. (b) Linear current scaling and a smaller voltage range show clear tuning with indentation depth in the negative bias region.

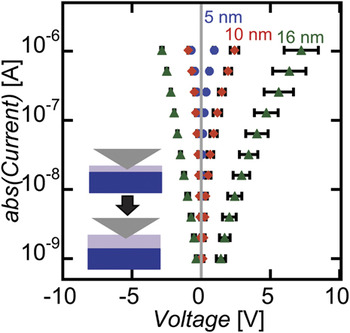
Though Fig. 5 shows unequivocal tuning of I–V behavior, indentation depth was not the only systematically changing variable; contact area also increased with increasing indentation depth. Plotting all the data from a consistent indentation depth normalizes the contact area between data sets, as shown in Fig. 6 for a 10-nm indentation depth in the samples with 5-, 10-, and 16-nm oxide thicknesses. Varying the oxide thickness while maintaining a constant indentation depth provided another way to modulate the effective tunneling distance. Figure 6 shows an increased degree of asymmetry and increased amount of voltage required for conduction as the oxide thickness, and thus the effective tunneling distance, is increased. This result is qualitatively similar to the changes in asymmetry and voltage required for conduction in Figs. 3–5, where decreasing indentation depth increases the effective tunneling distance. Though not shown here, a behavior consistent with that of Fig. 6 was also observed at the 4- and 7-nm indentations depths, demonstrating that MIM I–V behavior can be actively tuned via nanoindentation.
Current–voltage behavior with indentation to a constant depth (h max) of 10 nm for samples with varying oxide thickness (5, 10, and 16 nm) replotted from Figs. 3–5. Trends observed with decreasing oxide thickness in Fig. 6 are consistent with those seen when indentation depth is increased in Figs. 3–5, reducing the effective oxide thickness.

IV. ANALYSIS
The physics of MIM devices have been an active topic of research since the groundbreaking work of Simmons in the 1960s in producing analytical approximations to quantum-mechanical tunneling equations involving the Wentzel–Kramer–Brillouin (WKB) approximation. Reference Simmons28–Reference Simmons31 Similar work was carried out by Stratton Reference Stratton32 and Hartman, Reference Hartman33 and following shortly thereafter, Brinkman, Reference Brinkman34 Dynes, and Rowell produced one of the first numerical studies that did not rely on the approximations used in Simmons’ earlier work. In the last decade, theoretical studies have focused on thin low dielectric constant insulators in MIM structures, where the barrier is better approximated by a parabola than a trapezoid or triangular, Fowler–Nordheim barrier due to the effects of image charge, which rounds off the corners of energy discontinuities at material interfaces and can lower barrier heights if the barrier is thin. Reference Hansen and Brandbyge35 This latest work is of great significance to the recent studies using C-AFM, as the insulators in those studies are in many cases monolayers of organic materials with a low dielectric constant. Reference DelRio, Steffens, Jaye, Fischer and Cook18,Reference Kelley and Frisbie19
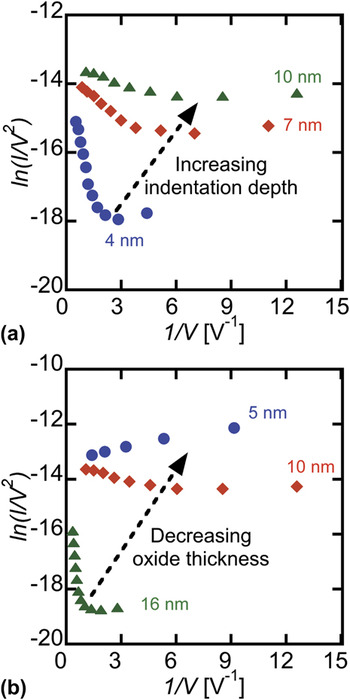
Given that the experiments here used a new technique to form and measure diodes, it is necessary to show that the measured I–V data are consistent with what is known about the Nb/Nb2O5 system, particularly the barrier height. In modeling the results of the measurements in this study, several properties of the materials, devices, and testing conditions must be considered. The small contact area of the MIM diodes formed by nanoindentation led to very high current densities for the sourced currents, which would suggest that field emission would be a significant tunneling mechanism. This was confirmed by the I–V curves plotted on Fowler–Nordheim axes [ln(I/V 2) versus 1/V] in Fig. 7, which show the current transitioning to linear behavior consistent with entering the Fowler–Nordheim field-emission regime at high field for several conditions. For both the 10- and 16-nm oxide thicknesses, a minimum in ln(I/V 2) was seen for each of the indentation depths, with data at voltages higher than the minimum trending toward linearity; data from the 10-nm-thick oxide at three indentation depths are shown in Fig. 7(a). Figure 7(b) shows data from the three oxide thicknesses measured at a fixed h max of 10 nm. The thinnest oxide (5 nm) sample did not show a transition to field emission at this indentation depth, or at any other indentation depth explored in this study, indicative of a nontriangular barrier to electronic conduction; the symmetric I–V behavior is also consistent with a nontriangular barrier shape. The thicker oxides showed a behavior that was similar to that observed for molecular junctions investigated with C-AFM. Reference Beebe, Kim, Gadzuk, Frisbie and Kushmerick17 Here, however, the insulator was niobium oxide, deposited with a thickness greater than the monolayers investigated by C-AFM and possessing a significantly higher dielectric constant [∼40 (Ref. Reference Muhammad, Morgan and Guile36)]. These conditions suggested that, for these MIM diodes, traditional models put forward by Simmons using a triangular barrier at high fields were appropriate, Reference Simmons28 in contrast to the parabolic barrier models used in C-AFM studies. Reference DelRio, Steffens, Jaye, Fischer and Cook18
I–V measurements plotted on axes consistent with Eq. 3, where a transition to linear behavior is expected for measurements entering the field emission regime at high voltages (low 1/V). (a) 10-nm-thick oxide measured at indentation depths of 4, 7, and 10 nm shows a minimum and transition for each data set. (b) Data from the 5-, 10-, and 16-nm oxide layers indented to a constant depth of 10 nm, showing that only the thicker (10 and 16 nm) samples demonstrate a transition.

We therefore modeled the 10- and 16-nm devices at high voltages, where the traditional Fowler–Nordheim field emission equation is appropriate. At high voltages, where the MIM diodes’ insulating barrier becomes triangular in shape, the current density is given by
 $$J = {{B{F^2}} \over \phi }\exp \left( { - {{\lambda {\phi ^{3/2}}} \over F}} \right)\quad ,$$
where B = 1.1e
3/(4πh), λ = 23πm
1/2/(6he), F is the electric field in volt/meter, and
 $\phi$
is the effective barrier height in volts, m is the mass of a free electron, e is the fundamental charge, and h is Planck’s constant.
Reference Simmons28
Since asymmetric devices have two different barrier heights, in the Fowler–Nordheim limit, we used the barrier height appropriate for the material from which the electrons tunnel (i.e., the Nb/Nb2O5 barrier for negative voltage data). Substituting J = I/A, where A is the area of the contact, and F = V/s, where V is the voltage across the insulator and s is the barrier thickness, gives:
 $${I \over A} = {{B{V^2}} \over {\phi {s^2}}}\exp \left( { - {{\lambda {\phi ^{3/2}}s} \over V}} \right)\quad .$$
Rearranging terms and taking the natural logarithm gives:
 $$\ln \left( {{I \over {{V^2}}}} \right) = \ln \left( {{{AB} \over {\phi {s^2}}}} \right) - {{\lambda {\phi ^{3/2}}s} \over V}\quad ,$$
which is a linear equation in 1/V that can be used to fit either the barrier height or thickness (provided that the other variable is fixed) from the measured I–V data using the slope of the linear equation. The last data point in each set, corresponding to where the measured voltage is maximum, V max, was used as the anchor point for the fits, giving the equation for fitting:
 $$y\left( {{1 \over V}} \right) = y\left( {{1 \over {{V_{\max }}}}} \right) - \lambda {\phi ^{3/2}}s\left( {{1 \over V} - {1 \over {{V_{\max }}}}} \right)\quad .$$
In this case, the fits were used to determine the thickness of the insulating niobium oxide barrier given an assumed barrier height. In principle, the intercept could be used with the slope to solve for both barrier height and thickness if the tunneling area in Eqs. (2) and (3) were specified. While the projected area from an indentation can be well-approximated, it is not clear that the entire projected area should be considered as the tunneling area; the tunneling current is exponentially dependent on the oxide thickness, and thus, regions closer to the tip apex may dominate the field emission process.
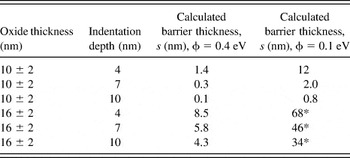
The fitting was performed for the negative voltages, where the tunneling of electrons is occurring from niobium into the boron-doped diamond tip. The results of the fits, which use the five highest-magnitude negative voltages in each indentation’s I–V curves, are shown in Table I. The fits were performed for an assumed barrier height of
 $\phi$
= 0.4 eV and
 $\phi$
= 0.1 eV. The former has been used previously as the barrier height for the Nb/Nb2O5 interface,
Reference Periasamy, Berry, Dameron, Bergeson, Ginley, O'Hayre and Parilla15,Reference O'Regan, Chin, Tan and Birdwell37
and the latter was used as a lower bound to account for possible barrier height lowering due to image charges and thin oxides. The results of the fit show that for the thick oxide sample (16 nm) and a barrier height of
 $\phi$
= 0.4 eV the fitted barrier thickness plus known indentation depth was a very good match to the original thickness of the oxide. When using the smaller barrier height for the same sample,
 $\phi$
= 0.1 eV (marked with *), the fitted barrier thickness data alone were much larger than the sample’s original thickness of oxide, meaning a barrier height of
 $\phi$
= 0.1 eV in this case is not physical. For the 10-nm sample, using either
 $\phi$
= 0.4 eV or
 $\phi$
= 0.1 eV gave barrier height thicknesses that, when added to the known indentation depths, were reasonably close to the original sample thickness, especially for the 7- and 10-nm indentation depths. The fitted barrier thicknesses for the 10-nm sample indicated that as the indent is made deeper into a sample, it was less clear which barrier height best fits the data. However, for the thicker 16-nm sample, none of the indentation depths were well fit by the lower barrier height. In a previous study of Nb2O5 thickness-dependence, no consistent trend in the barrier height was associated with oxide thickness variation over the range of 1.1–2.8 nm.
Reference Grossman, Harvey and Reintsema1
However, that study concerned planar devices, whereas the present results may be impacted by geometric field enhancement due to the shape of the tip as discussed by Choi et al.
Reference Choi, Yesilkoy, Ryu, Cho, Goldsman, Dagenais and Peckerar7
This modeling shows that the I–V data measured by electrically conductive nanoindentation are consistent with reported barrier heights for Nb/Nb2O5.
Effective barrier thickness fitting results. The degree of deformation of the oxide layer is unknown, but the effective barrier thickness is constrained to be less than or equal to the oxide thickness. Qualitative evaluation of the plausibility of each barrier height based on this constraint shows that all calculations are plausible with the exception of the ones marked with *.

V. SUMMARY
Nanoindentation with electrical characterization capabilities was used to tune and characterize point-contact MIM-structures with oxide-based insulators in situ. Data acquired for a range of oxide thicknesses probed to varying indentation depths showed that the I–V behavior can be mechanically tuned over a range of more than 1 V for equivalent currents. For the bilayers (Nb/Nb2O5) with the thickest oxides, the I–V data showed a distinct asymmetry around 0 V, and corresponding modeling showed behavior consistent with a transition to field emission in the high voltage regime. By enabling simultaneous measurement of nanomechanical and electrical data, nanoindentation shows promise as a high resolution, reproducible method for screening metal–insulator bilayers and their oxide thicknesses for potential use in MIM material structures and for exploring the physics of tunneling through thin films.
ACKNOWLEDGMENTS
This work was supported by the U.S. Department of Energy under Contract No. DE-AC36-08-GO28308 with the National Renewable Energy Laboratory, as part of the Laboratory Directed Research and Development Program and is currently supported by funding from the Center for Revolutionary Solar Photoconversion (CRSP). This material is partially based upon work supported by the National Science Foundation through the Renewable Energy Materials Research Science and Engineering Center under Grant No. DMR-0820518.