INTRODUCTION
To date, there is ample evidence that adult second language (L2) speech is generally marked by some trace of a foreign accent. This is very likely due to the inevitable interaction between the L2 and deeply entrenched, strongly developed first language (L1) system in the common linguistic space (Flege, Reference Flege2016). Given that few late L2 learners can attain nativelike L2 proficiency (e.g., Abrahamsson & Hyltenstam, Reference Abrahamsson and Hyltenstam2009), a growing number of scholars have emphasized the importance of evaluating the quality of L2 speech based on criteria that relate more to successful L2 communication in real-life settings (e.g., Ortega, Reference Ortega2018). This realistic, fundamental goal for adult L2 speech learning has motivated a great deal of research into the construct of comprehensibility, defined as the amount of effort that listeners need to make to understand the content of foreign-accented speech (Derwing & Munro, Reference Derwing and Munro2015).
The notion of L2 comprehensibility has been extensively discussed as one key element of L2 oral proficiency scale in acquisition (Nagle, Reference Nagle2018; Saito, Reference Saito2015), assessment (Isaacs, Trofimovich, & Foote, Reference Isaacs, Trofimovich and Foote2018), and teaching literature (Gordon & Darcy, Reference Gordon and Darcy2016; Saito & Saito, Reference Saito and Saito2017). For example, in comprehensibility research, native-speaking listeners are typically recruited to listen to and rate the comprehensibility of speech samples produced by L2 users with various proficiency levels. Previous research has shown that listeners likely attend to particular linguistic features to grasp the overall message of the samples, including segmental contrasts with high functional load and several minimal pairs (e.g., Munro & Derwing, Reference Munro and Derwing2006; Suzukida & Saito, in press), prosodic accuracy and fluency (e.g., Kang, Rubin, & Pickering, Reference Kang, Rubin and Pickering2010), and lexical appropriateness and complexity (e.g., Appel, Trofimovich, Saito, Isaacs, & Webb, Reference Appel, Trofimovich, Saito, Isaacs and Webb2019; Saito, Webb, Trofimovich, & Issacs, 2016). The features that factor most heavily into judgments are known to differ according to a number of variables such as the proficiency level of speakers in the samples (low- vs. mid- vs. high-level comprehensibility) (Saito, Trofimovich, & Isaacs, Reference Saito, Trofimovich and Isaacs2016) and the type of speaking task (interview vs. picture descriptions) (Crowther, Trofimovich, Isaacs, & Saito, Reference Crowther, Trofimovich, Isaacs and Saito2015).
In addition to these, there is evidence showing that the background profiles of listeners can also affect L2 speech ratings. Listeners tend to be more lenient when they are more familiar with the accent varieties of the speech that they are judging (e.g., Bradlow & Bent, Reference Bent and Bradlow2003; Winke, Gass, & Myford, Reference Winke, Gass and Myford2013) or have language teaching experience (e.g., Kennedy & Trofimovich, Reference Kennedy and Trofimovich2008; Saito, Trofimovich, Isaacs, & Webb, Reference Saito, Trofimovich and Isaacs2016). For example, a recent study by Saito and Shintani (Reference Saito and Shintani2016) compared factors affecting the judgments of multilingual and monolingual listeners (Singaporeans vs. Canadians), finding that the former group assigned more lenient scores than the latter. Detailed analysis of the findings showed that the multilingual listeners considered all linguistic information in their judgments while the monolingual listeners were particularly influenced by phonological accuracy.
One gap in our current understanding of L2 comprehensibility judgments is that the majority of studies have relied on the judgments of L1 listeners alone. Accordingly, a growing amount of attention has been given to exploring the generalizability of findings from L1-listener research to other L2 users of English—that is, exploring how L2 users understand each other’s accented speech. This is a particularly pertinent extension of comprehensibility research given the status of English as a lingua franca in many places in the worldwide, and the fact that the majority of English speakers are L2 users (Pennycook, Reference Pennycook2017). To date, however, there has been little conclusive research indicating whether there are actual differences between how L1 and L2 listeners perceive the comprehensibility of L2 speech.
For instance, some studies have found L2 listeners’ assessment patterns differ from those of L1 listeners especially when they evaluate familiar accents (produced by L2 speakers with the same and/or similar L1 profiles) (e.g., Foote & Trofimovich, Reference Foote and Trofimovich2018; Ludwig & Mora, Reference Ludwig and Mora2017). In contrast, others have failed to find any advantage for familiarity at all, pointing out that both L1 and L2 listeners likely arrive at very similar L2 comprehensibility ratings (e.g., Crowther, Trofimovich, & Isaacs, Reference Crowther, Trofimovich and Isaacs2016; Munro, Derwing, & Morton, Reference Munro, Derwing and Morton2006). This inconsistency suggests that L2 users’ understanding of foreign-accented speech may be a multifaceted phenomenon that is intricately tied to a range of listener background factors, such as L2 proficiency level (e.g., Eger & Reinisch, Reference Eger and Reinisch2018; Ludwig & Mora, Reference Ludwig and Mora2017), quantity/quality of experience with the target language (e.g., Harding, Reference Harding2012; Hayes-Harb, Smith, Bent, & Bradlow, Reference Hayes-Harb, Smith, Bent and Bradlow2008), and their attitudes, awareness, and metacognition of foreign-accented speech (e.g., Derwing, Munro, & Rossiter, Reference Derwing, Munro and Rossiter2002).
To shed light on the complex mechanisms underlying L2 users’ comprehensibility judgments, the current study took an exploratory approach toward examining how a total of 120 L2 (n = 110) and L1 (n = 10) users differentially assessed the comprehensibility of 50 beginner-, intermediate-, and advanced-level L2 speech samples. By comparing responses on the listener background questionnaire with comprehensibility ratings, we aimed to reveal which listener factors—L1 profiles, L2 proficiency, age, quantity and quality of experience, and familiarity and metacognition of foreign accented speech—are relatively crucial for explaining individual variability in L1 and L2 speech ratings.
METHOD
L2 LISTENERS
Backgrounds
To capture a wide range of listener backgrounds, we recruited a total of 110 L2 speakers in London. London can be considered as an ideal site for accessing a number of L2 users with highly diverse ethnic, linguistic, experiential, and sociopsychological backgrounds given the relatively high number of residents using a language other than English as their main form of communication (20% of residents compared to less than 5% nationwide) (UK Census, Reference Census2011). To recruit as many L2 listeners as possible, flyers were circulated at various locations (universities, language schools) and on social media. All the participants were considered as late learners who were first exposed to L2 English after 16 years of age. As described in the following text and summarized in Table 1, these L2 listeners differed substantially in terms of their backgrounds.
1. L1 Profiles (2 variables): The listeners’ L1 profiles comprised eight groups—German/Romance (n = 26), Altaic (n = 25), Slavic/Baltic (n = 18), Mandarin Chinese (n = 15), Austro-Asiatic (n = 12), African (n = 10), Indo-Iranian (n = 3), and Arabic (n = 1). Two ordinal scales were devised to measure the impact of L1 profiles on rating score: distance to Japanese-accented English (i.e., accent of the speech samples they were being asked to assess for L2 comprehensibility: “2” = Japanese, “1” = Korean, Turkish, Chinese,Footnote 1 “0” = other languages) and whether their L1 was from the Indo-European language family (“1” = Indo-European, “0” = non-Indo European).
2. L2 Proficiency (2 variables): Previous research has indicated that L2 users’ speech judgments tend to be influenced by their actual (e.g., Eger & Reinisch, Reference Eger and Reinisch2018) and self-perceived proficiency levels (e.g., Ludwig & Mora, Reference Ludwig and Mora2017). To measure this, the listeners first engaged in the same speaking task they were being asked to rate (i.e., timed picture description; see “Material Preparation”). Thirty seconds of each sample were extracted as a single WAV file and rated by two native speakers of British English on a 9-point scale (1 = difficult to understand, 9 = easy to understand). The high interrater reliability of the raters (Cronbach α = .95) led us to calculate an average score for each participant across the raters (Range = 1–9). As an additional measure of L2 proficiency, the participants were asked to rate their own comprehensibility in general using the same 9-point rubric (Range = 1–8).
3. Age (2 variables): Age-related factors have been found to exert a strong influence on various dimensions of L2 speech learning (e.g., Abrahamsson & Hyltenstam, Reference Abrahamsson and Hyltenstam2009 for the age of arrival vs. nativelike L2 pronunciation attainment; Pichora-Fuller & Souza, Reference Pichora-Fuller and Souza2003 for aging vs. perceptual acuity). Given that L2 listeners’ representation, processing, and proficiency is directly relevant to their L2 speech assessments (Eger & Reinisch, Reference Eger and Reinisch2018), it is reasonable to consider age as a possibly influential background factor. To this end, the participants were interviewed to uncover their first intensive exposure to L2 English, operationalized as age of arrival in English speaking countries (e.g., the United Kingdom, the United States, Australia) and their chronological age at the time of testing.
4. Quantity and Quality of Experience (9 variables): Following research standards in L2 speech literature (Flege, Reference Flege2016), the quantity of the participants’ L2 experience (defined as sufficient, naturalistic, and interactive exposure to the target language) was estimated based on total length of residence in English-speaking countries (e.g., the United Kingdom, the United States). To further examine the quality of experience, the interview also elicited details about any L2 English teaching experience or linguistics classes they had taken in the past. Using the Language Contact Profile scheme (Freed, Dewey, Segalowitz, & Halter, Reference Freed, Dewey, Segalowitz and Halter2004), the participants were also asked to report on the details of their recent L2 experience by estimating the ratio of their L1 and L2 use over the past few years in three different settings (work, social settings, home).Footnote 2
5. Familiarity (4 variables): Similar to previous literature (e.g., Winke et al., Reference Winke, Gass and Myford2013), the participants’ familiarity with different kinds of accented speech was elicited based on self-reports on a 9-point scale (1 = not familiar at all, 9 = very much familiar). These items included (a) foreign-accented English in general, (b) Japanese-accented English, (c) Received Pronunciation English, and (d) General American English.
6. Metacognition of L2 Speech (5 variables): Metacognition refers to the conscious awareness of one’s own mental processes (Flavell, Reference Flavell1979). In this study, metacognition was operationalized as listeners’ explicit understanding and awareness of the linguistic characteristics of foreign-accented speech. Metacognitive awareness of accented speech properties has been previously found to enhance listeners’ understanding, confidence, and attitudes in L2 speech judgments (e.g., Derwing et al., Reference Derwing, Munro and Rossiter2002 for L1 listeners’ intelligibility assessment of Vietnamese-accented English). To tap into the participants’ metacognitive awareness, they were asked to use a 9-point scale (1 = not important, 9 = very important) to give their opinion on how important they thought five different aspects of language were for successful communication: (a) speaking English without any accent like a native speaker, (b) speaking comprehensible English regardless of accentedness, (c) good pronunciation, (d) appropriate vocabulary/grammar, and (e) idiomatic and sophisticated expression.
Summary of L2 listener background variables

The entirety of the data collection (interview, speech assessment/recording) took place in a quiet room at the researchers’ residences, universities, and community centers (see Supplementary Information-A and IRIS for the questionnaire that we used during the interview).
Reduced categories
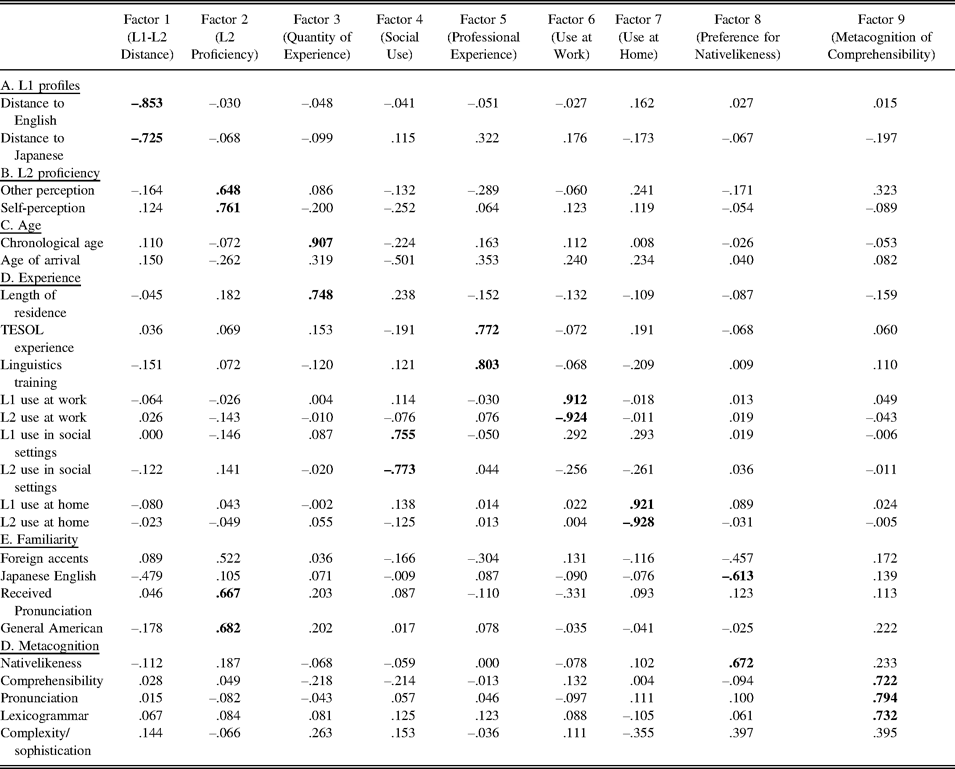
Whereas the raw categories covered a total of 24 listener background variables, it is possible that some may have overlapped considerably (especially within the same thematic categories), resulting in multicollinearity problems. Because of this, we conducted a factor analysis to capture the latent categories underlying individual variability in the background characteristics of the 110 listeners. All raw background scores were submitted to a factor analysis with varimax rotation. Following Loewen and Gonulal’s (2015) field-specific guidelines, the factorability of the dataset was considered relatively high as shown by Bartlett’s test of sphericity (χ Footnote 2 = 1486.07, p < .001) and the Kaiser-Meyer-Olkin measure of sampling adequacy (.509). Using the maximum likelihood method, the model identified nine factors with eigenvalues beyond 1, accounting for 74.76% of variance. A value of .6 was used as the threshold coefficient for practically significant factor loadings. Each factor is summarized in Table 2 and was interpreted as follows:
Factor analysis of the listener background variables

Note: All loadings > .6 were highlighted in bold.
Factor 1 was “L1-L2 Distance,” as items with the highest loadings pertained to participants’ L1 profiles relative to English and Japanese. Factor 2 was “L2 proficiency,” as the relevant items reflected the degree to which participants spoke comprehensible L2 English and demonstrated familiarity with various kinds of L2 English. Items related to experience were factored into five separate groups: Factor 3 for “Quantity of Experience,” Factor 4 for “Social Use,” Factor 5 for “Professional Experience,” Factor 6 for “Use at Work,” and Factor 7 for “Use at Home.” Interestingly, the items related to metacognition appeared to tap into two different dimensions of listeners’ orientations toward L2 speech assessment. Factor 8 was called “Preference for Nativelikeness” because the items pertained to the degree to which listeners believed in the importance of nativelike L2 oral proficiency with little familiarity with Japanese-accented English (the accent used in the rating materials). Factor 9 was designated as “Metacognition of Comprehensibility” because the items corresponded to listeners’ unified notion of the importance of “comprehensible” pronunciation and lexicogrammar.
COMPREHENSIBILITY JUDGMENTS
Material preparation
The stimuli for the comprehensibility judgments were 50 spontaneous speech samples representing a range of L2 speaking proficiency (Saito & Shintani, Reference Saito and Shintani2016). The dataset comprised the timed picture descriptions of L1 Japanese speakers that were carefully selected from the researchers’ unpublished corpus of audio recordings of 200+ Japanese learners of English in Calgary, Montreal, and Vancouver (deposited in IRIS; Marsden, Mackey, & Plonsky, Reference Marsden, Mackey, Plonsky, Mackey and Marsden2016). The talkers’ L2 experience profiles were equally distributed in terms of age of arrival (M = 27.8, Range = 19–40) and length of residence in Canada (M = 2.7 years, Range = 1 month to 11 years). In the task, the talkers described seven pictures depicting various scenes with three seconds of planning time per picture. The first four picture descriptions served as practice, while 10 seconds from each of the remaining three descriptions were extracted and used to generate the final speech samples. The length of each sample (30 seconds) is comparable to similar studies on L2 comprehensibility (e.g., Isaacs et al., Reference Isaacs, Trofimovich and Foote2018).
Procedure
First, each listener received a briefing on the purpose of the research and an explanation of L2 comprehensibility. Next, the listeners familiarized themselves with the three picture prompts and practiced the rating procedure using three samples not included in the main dataset (for training scripts and onscreen labels, see Supplementary Information-B). All speech samples were then randomly ordered and presented to the listeners using Praat (Boersma & Weenink, Reference Boersma and Weenink2018), and rated for comprehensibility using a 9-point scale (1 = difficult to understand, 9 = easy to understand). Each session lasted approximately 60 minutes.
PRONUNCIATION, FLUENCY, AND LEXICOGRAMMAR ANALYSES
Measures
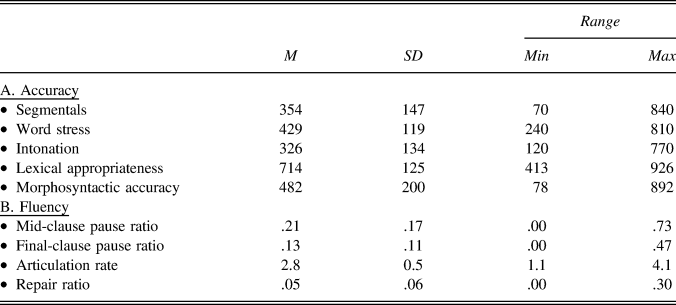
To illustrate how L1 and L2 listeners’ comprehensibility ratings related to the linguistic qualities of the speech samples, we recruited five L1 English graduate students in applied linguistics to carry out a set of accuracy and fluency analyses (for a summary of the results, see Table 3). After receiving training, which was developed and validated in Saito, Trofimovich, and Issacs (Reference Saito, Trofimovich and Isaacs2017), the raters carefully listened to each audio file using a custom MATLAB-based computer program, and provided holistic judgments of three specific aspects of L2 pronunciation proficiency (the correct use of segmentals, word stress, intonation). For each rating, a moving slider was used to record judgments on a 1,000-point scale (0 = nontargetlike, 1,000 = targetlike). Using the same procedure, they then read written transcripts of the samples and rated them for two specific aspects of L2 lexicogrammar proficiency (appropriate use of vocabulary and morphology). Given the raters’ high interrater reliability (α > .80), the scores were combined to generate a single average score for each sample and category.
Descriptive results of pronunciation, lexicogrammar, and fluency measures

For the fluency analysis, two researchers used Praat (Boersma & Weenink, Reference Boersma and Weenink2018) to separately analyze each sample for three key elements of L2 fluency—that is, breakdown, speed, and repair (Kormos, Reference Kormos2012). For breakdown fluency, we counted the number of filled (e.g., ah, oh, eh) and unfilled (> 250ms of silence) pauses, and divided them by the total number of words. Following Kormos’s (2012) suggestion that the location of pauses should mirror the different cognitive processes involved in speech, we calculated pauses at the end of clauses (representing speakers’ conceptualization of what to convey) and in the middle clauses (representing speakers’ ongoing linguistic encoding of how to say it). For speed fluency, we divided the total number of syllables by the total phonation time (without any filled pauses) (i.e., articulation rate). For repair fluency, we divided the number of repetitions and self-corrections by the total number of words.
Reduced categories
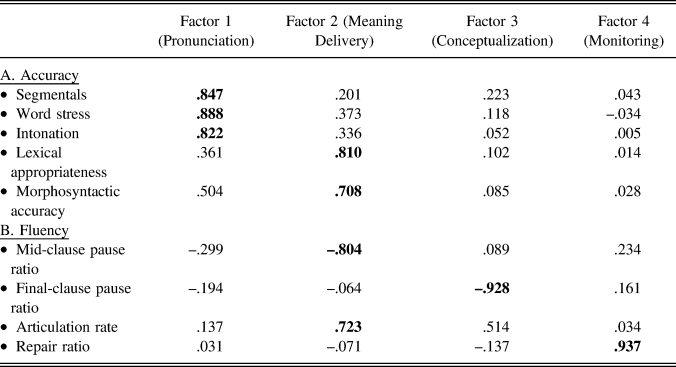
To control for the potential overlap between the nine accuracy and fluency measures, all linguistic scores were submitted to a factor analysis with varimax rotation. The factorability of the entire dataset was confirmed using two tests: Bartlett’s test of sphericity (χ Footnote 2 = 262.17, p < .001) and the Kaiser-Meyer-Olkin measure of sampling adequacy (.781). Adopting the maximum likelihood method, the analysis identified four factors with eigenvalues beyond 1 (summarized in Table 4), which accounted for 84.6% of the variance in the linguistic measures. Factor 1 was labeled as “Pronunciation” because it encompassed all the pronunciation scores (segmentals, word stress, intonation). Factor 2 was labeled as “Meaning Delivery” because it captured how fluently the speech carried the meaning of the utterances (regardless of phonological accentedness). Final-clause pause ratio and repair ratio were loaded separately onto Factors 3 and 4, respectively. In conjunction with Kormos’s (2012) fluency framework, these two factors were labeled according to the type of cognitive processing they were presumed to represent—Factor 3 as “Conceptualization” and Factor 4 as “Monitoring.”
Factor analysis of the pronunciation, lexicogrammar, and fluency measures

Note: All loadings > .6 were highlighted in bold.
BASELINE DATA (L1 LISTENERS’ COMPREHENSIBILITY RATINGS)
To provide a point of comparison for L2 listeners’ assessment patterns, we adopted the same L1 listeners and L2 comprehensibility ratings reported previously in Saito and Shintani (Reference Saito and Shintani2016) with the same dataset (i.e., 50 picture description narratives). In the original study, the listeners were carefully selected to represent relatively homogeneous listener backgrounds. All of them were undergraduate students majoring nonlinguistics subjects (e.g., business, psychology) at a university in Vancouver, Canada without any prior ESL/EFL teaching experience. They self-reported as monolinguals who had English as a main language of communication throughout their lives (their parents were L1 English speakers) and showed a minimal degree of familiarity with Japanese-accented English speech (M = 1.3 on a 6-point scale). Given the high interrater agreement of these baseline raters (α = .95), their scores were combined to generate a single average rating for each sample and category.
RESULTS
The first objective of the statistical analysis was to explore whether it was possible to categorize the 110 L2 listeners into smaller groups based on their comprehensibility ratings. To this end, the L2 users’ ratings were submitted to hierarchical cluster analysis using Ward’s method of minimum variance with Euclidian square distance intervals. A visual inspection of the dendrogram (see Figure 1) points to two large groups of relatively homogeneous listeners: Group A (n = 64) and Group B (n = 46). Because both of the groups demonstrated relatively high interrater agreement (α = .90, .89, respectively), their comprehensibility scores were averaged for each speech sample and compared to those of the L1 baseline group. According to a one-way repeated-measures ANOVA, comprehensibility ratings significantly differed across the three groups, F (2, 98) = 108.648, p < .01, Partial η p2 = .699. A post-hoc multiple comparison analysis demonstrated that Group A (M = 5.9, SD = 1.6) assigned significantly higher and more lenient scores to the 50 samples than the L1 Baseline (M = 5.2, SD = 1.4) with small-to-medium effects (d = 0.46); while the L1 Baseline assigned significantly more lenient scores than Group B (M = 4.6, SD = 1.6) with small-to-medium effects (d = .039). Based on this analysis, Group A was designated as L2 Lenient and Group B as L2 Strict.
Dendrogram tree of hierarchical clusters based on listeners’ comprehensibility scores.

The next objective of the analysis was to examine the extent to which the three listener groups (L2 Lenient, L2 Strict, L1 Baseline) differentially weighted pronunciation, fluency, and lexicogrammar information in their comprehensibility judgments. Following the same methodology and justifications presented in our original research (Saito & Shintani, Reference Saito and Shintani2016), the decision was made to run three different sets of multiple regression analyses with each group’s comprehensibility ratings as the dependent variable and the four linguistic factor scores as predictor variables (i.e., Pronunciation, Meaning Delivery, Conceptualization, and Monitoring). Given that our approach here was exploratory, we chose the “stepwise” method.
To determine the suitability of conducting multiple regression analyses, several necessary conditions were carefully checked. First, as explained in the manuscript, the nine predictors originally included in the linguistic analyses (pronunciation, fluency, and lexicogrammar) were reduced to four predictors through factor analyses. Second, the normality of each dependent variable (three groups’ averaged comprehensibility ratings) was confirmed by Kolmogorov-Smirnov tests (p > .05).
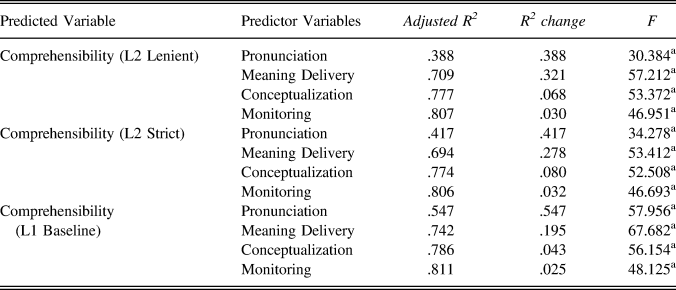
As summarized in Table 5, all the regression models appeared to account for roughly similar amounts of variance in L2 comprehensibility judgments across the three listener groups—80.7% for L2 Lenient, 80.6% for L2 Strict, 81.1% for L1 Baseline.Footnote 3 However, the relative weights of pronunciation, meaning delivery, conceptualization, and monitoring factors, differed to some degree. Specifically, we noted that the L1 listeners’ comprehensibility ratings were more strongly influenced by phonological accuracy (54.7%) compared to ratings of the L2 listeners (38.8% for L2 Lenient, 41.7% for L2 Strict). Among the L2 listeners, the lenient L2 listeners appeared to be more capable of attending to meaning delivery (the appropriate and fluent use of lexicogrammar) than the strict L2 listeners (32.1% vs. 27.8%).
Results of multiple regression analyses using the linguistic factors as predictors of comprehensibility

Note: ap value was below .001. The variables entered into the regression equations included Pronunciation, Meaning Delivery, Conceptualization, and Monitoring.
The final objective of the analysis was to explore which listener background factors could distinguish between the two L2 listener groups. To this end, a binary logistic linear regression was performed with listener group as the dichotomous dependent variable (Lenient, Strict) and the nine listener background factors (L1-L2 Distance, L2 Proficiency, Quantity of Experience, Social Use, Professional Experience, Use at Work, Use at Home, Preference for Nativelikeness, Metacognition of Comprehensibility) as independent variables. Using the forward stepwise method, the model was shown to be significant (χ2 = 4.285, p = .038) with three predictors—(a) Metacognition, B = –.584, Exp (B) = .589, p = .014; (b) Use at Work, B = .523, Exp (B) = 1.687, p = .013; and (c) L1-L2 Distance, B = –.431, Exp (B) = .650, p = .042—and explained a total of 19.8% of the variance in rating scores. The results of Nagelkerke r-squared measure demonstrated that the three listener background factors differentially contributed to the group distinction between the lenient and strict groups—Metacognition (8.6%), Use at Work (6.7%), and L1-L2 Distance (4.5%).
DISCUSSION
The current study set out to examine the sources of individual differences in L1 and L2 listeners’ comprehensibility ratings of foreign-accented speech. The L2 listeners widely differed in terms of their L1 profiles; L2 proficiency; prior teaching/linguistics experience; amount of L2 use at work, socially, and at home; and the degree of their awareness, attitude, and metacognition of foreign-accented speech. In terms of product (what compressibility scores listeners eventually provided), compared to a baseline group (n = 10 monolingual L1 listeners), these listeners were readily divided into two groups: (a) L2 listeners who assigned higher comprehensibility scores than the L1 Baseline (L2 Lenient) and (b) L2 listeners who assigned lower comprehensibility scores than the L1 Baseline (L2 Strict).
When it comes to process (how listeners arrived at such ratings), results showed that the L1 listeners’ judgments were strongly tied to pronunciation accuracy. L2 listeners, however, seemed to equally weigh different areas of language (pronunciation, fluency, lexicogrammar) in their judgments. This finding is line with previous research indicating differences in how inexperienced (monolingual) and experienced (multilingual) L1 listeners react to L2 speech (e.g., Saito & Shintani, Reference Saito and Shintani2016). Among the L2 listeners, however, the more lenient group appeared to give more weight to lexical appropriateness and fluency in their judgments. In addition, three background factors were found to distinguish between the ratings of the two groups: (a) metacognition (how much aware they were of the importance of “comprehensible” pronunciation and lexicogrammar), (b) experience (how much they were regularly using L2 English especially in professional [business, school] settings), and (c) L1-L2 distance (L1 distance from Japanese and English).
The findings for these three background factors can be interpreted with reference to psycholinguistic views on the role of experience in sound and word recognition. According to the well-known notion in psycholinguistics, perceptual adaptation (see Witteman, Weber, & McQueen, Reference Witteman, Weber and McQueen2013 for a comprehensive review), first language listeners have the capacity to adjust, revise, and develop their existing representations when exposed to systematic and novel deviations from familiar linguistic regularities. After a sufficient amount of experience, listeners become not only better at recognizing a range of unfamiliar sounds (e.g., Norris, McQueen, & Cutler, Reference Norris, McQueen and Cutler2003) but also at understanding foreign accents (e.g., Bradlow & Bent, Reference Bradlow and Bent2008). The findings of the current study can be interpreted as providing some of the first evidence for the occurrence of this phenomenon among second language listeners.
For example, we found that more lenient L2 listeners were more conscious of the important roles that comprehensible pronunciation and lexicogrammar (instead of nativelikeness) play in successful communication. These comprehensibility-oriented L2 listeners may in turn have been more willing to accommodate particular varieties of accented-speech (e.g., Japanese speakers’ spontaneous speech in English) (e.g., Derwing et al., Reference Derwing, Munro and Rossiter2002) and strive to robustly develop their L2 comprehension skills by making the most of opportunities to interact with L1 and L2 interlocutors alike (see Leow, Reference Leow2000 for the roles of awareness in general L2 learning). This latter interpretation stems from the finding that lenient listeners reported using L2 English very frequently in business and school settings with interlocutors from multiple language backgrounds—a key condition for successful perceptual adaptation (Sidaras, Alexander, & Nygaard, Reference Sidaras, Alexander and Nygaard2009).
In addition, we found that L2 listeners assigned higher comprehensibility scores when they had certain L1 profiles (L1 proximity to English and Japanese) that were similar to the target speech samples—Japanese-accented English. This proximate L1-L2 distance may have helped promotes the listeners’ perceptual adaptation—a phenomenon referred to as “the interlanguage speech intelligibility benefit” (Hayes-Harb et al., Reference Hayes-Harb, Smith, Bent and Bradlow2008). All the factors listed here led L2 listeners to accumulate more experience with various types of English speech and by extension modify their phonological representations to better comprehend the foreign-accented samples.
Two findings that run contrary to previous literature is the lack of relationship between L2 proficiency, familiarity, and the lenient versus strict distinction. First, it is important to remember that we here operationalized L2 proficiency according to the groups’ performance on the same listening task (picture narrative judged by L1 listeners). One possible explanation for the lack of any effect could be that L2 users’ production abilities may not necessarily index the way they process foreign-accented speech, which concurs with theoretical and empirical evidence in L2 speech research. Whereas many major theories agree that perception and production are essentially interlinked (e.g., Flege, Reference Flege2016), the former may precede and not necessarily chronologically align with the latter (Baker & Trofimovich, Reference Baker and Trofimovich2006). The relationship between L2 users’ proficiency and their L2 speech assessment thus needs to be demonstrated in replication studies, especially those that include more outcome measures that reflect various dimensions of L2 users’ proficiency on both the perception and production levels (cf. Ludwig & Mora, Reference Ludwig and Mora2017).
Second, the current study did not identify L2 users’ familiarity with Japanese-accented English as a significant predictor of their individual differences in comprehensibility judgments. These results are discordant with existing literature that has evidenced the role of familiarity in distinguishing between L1 and L2 speech assessment (e.g., Winke et al., Reference Winke, Gass and Myford2013). The lack of familiarity effects in the current study may be attributable to the greater importance of metacognition, experience, and/or L1-L2 distance in comprehensibility judgment; that is, the L2 listeners’ familiarity with Japanese-accented English may have been indirect at best, if their L1 profiles were far from English/Japanese, they did not use English on a daily basis, or/and they were not highly awareness of comprehensibility as a crucial goal of L2 communication.
SUPPLEMENTARY MATERIAL
To view supplementary material for this article, please visit https://doi.org/10.1017/S0272263119000226