The international monetary system is not like Robert Lucas's archipelago of even island-economies. A more apt metaphor would be to compare it to Orwell's Animal Farm, where some individuals are “more equal than others.” To use the words of political scientist Jerry Cohen, there is a “geography of money,” and this geography is characterized by a highly hierarchical order cascading down from “top” currencies to “pseudo-currencies” at the bottom of what he describes as a “currency pyramid.”1
Cohen, Future, chapter 1.
In the language of monetary historians, this hierarchy is referred to in terms of “core vs. periphery.” For instance, conventional descriptions of the late-nineteenth-century international monetary system contrast the North Western European “core” countries and the “peripheral” ones of South Eastern Europe, Asia, and Latin America.
2 Eichengreen and Flandreau, Gold Standard.
Yet we do not know what we mean by “core” and “periphery.” This is because nobody cares to discuss relevant criteria. Like the blind man with the elephant, we are limited to knowledge of some parts of the beast. If asked to place late nineteenth century Britain and Argentina in the “core” or “periphery,” most economic historians would likely concur that Britain was in the core, and Argentina in the periphery. But if the same question is asked about Portugal, Sweden, Japan, the Netherlands, Canada, Russia, Austria-Hungary, Italy, Chile, or the United States of America, we should expect disagreement.
This may not matter: “core” and “periphery” may just be heuristic concepts, better used rhetorically than theoretically, meaning “not everybody is alike.” But authors using this language usually do so in reference to some specific issue. People dealing with development put rich countries in the core and poor ones in the periphery. People dealing with financial crises put crisis-proof countries in the core, and crisis-prone countries in the periphery. People dealing with monetary policy put credible countries in the core and noncredible countries in the periphery. Then of course, talking of core and periphery is tautological.
In practice, testing propositions about different macroeconomic behaviors in groups of countries requires agreed-upon groupings. In this article we provide a formal procedure to identify country groups in the late nineteenth century. Our approach is related to the recent research of international macroeconomists such as Barry Eichengreen and Ricardo Hausmann, who emphasize the cross-section heterogeneity of financial vulnerability in modern economies. It is also consistent with the early work of Alec Ford on the operation of the nineteenth-century international monetary system.3
Eichengreen and Hausmann, Other People's Money; and Ford, Gold Standard.
Our basic intuition is that systematic differences of macroeconomic behavior can be traced to differences of monetary structures: national currencies vary in terms of their international circulation, so that countries face varied external adjustment constraints.
MISSING MARKETS MATTER: CORE, PERIPHERY, AND THE ADJUSTMENT MECHANISM
Our purpose is not to review the substantial literature that has used the concepts of “core” and “periphery.” This notion, for all its vagueness, has been used by Neo-classical and Marxist authors alike, suggesting that appeal has not been tarnished by imprecision. In broad terms, we understand that people thinking in such terms believe that structures do matter.
To talk rigorously of core vs. periphery, one has to address three related and difficult questions, in the following order: Can we map the geography in the international monetary system?; Can we explain it?; and Does it matter? This article deals solely with the first question, in the context of the late-nineteenth-century international monetary system. The starting point is the classic discussion of the adjustment mechanism in a two-country world. Following David Hume and David Ricardo, the Cunliffe Committee's First Interim Report of 1918 emphasized the role of monetary policy in restoring external balance.4
Hume, Balance of Trade; Ricardo, Principles. On the First Interim Report, see Eichengreen and Flandreau, Gold Standard.
Consider a two-country world. Monetary authorities in country A may respond to rising trade deficits caused by domestic price increases by raising the interest rate. This policy encourages moderation in A and brings A prices in line with B prices. It also has the short-run effect of helping finance A's deficit by attracting capital from B.
Suppose now that we change the setting in one critical dimension: the two countries differ in the international status of their currency. Investors of country B do not hold balances (time deposits, short-term credits, long-term debt, and their likes) denominated in currency A. By contrast, residents of both countries hold assets denominated in currency B. As a result, a rise in the interest rate by the central bank of country B will induce both residents and foreigners to increase their holdings of currency B. But a similar move by the monetary authorities of country A will have no effect on foreigners and can only work through the repatriation of foreign balances by residents of country A: And thus the asymmetry in external adjustment.
The structural ingredient we have considered is also a prominent feature of the pre-1914 international monetary system. A stands for Argentina, B for Britain and, as monetary historians know, there was no peso market in London. By contrast, in the returns of the Buenos Aires stock exchange we find plenty of evidence of a large and liquid market for sterling. A key theme of Alec Ford's classic book on the pre-1914 gold standard is that the international adjustment mechanism did work differently in different countries.5
Ford, Gold Standard. See also Eichengreen, “Gold Standard.” Today similar issues are at the heart of discussions of the U.S. current account “problem.” Those who argue, as Dooley, Folkerts-Landau, and Garber, “Bretton Woods,” that these disequilibria are not a concern emphasize the unique position of the U.S. dollar at the “core” of the international monetary system.
Ford emphasized that external adjustment was easier in the “center” (Britain) and more difficult in the “periphery” (Argentina).
6 Ford provided a different diagnosis however, emphasizing the role of terms of trade shocks.
We have just argued that there were good reasons for that.
WHO'S QUOTING WHOM?
In this section we document the international status of the various currencies in the late nineteenth century. As noted long ago by Peter Lindert, this cannot be done by computing aggregate statistics of private foreign holdings: such data are lost.7
One is reminded of Bloomfield, Capital Movements; and Lindert, Key Currencies. For a recent discussion, see Flandreau and Gallice, “Paribas.”
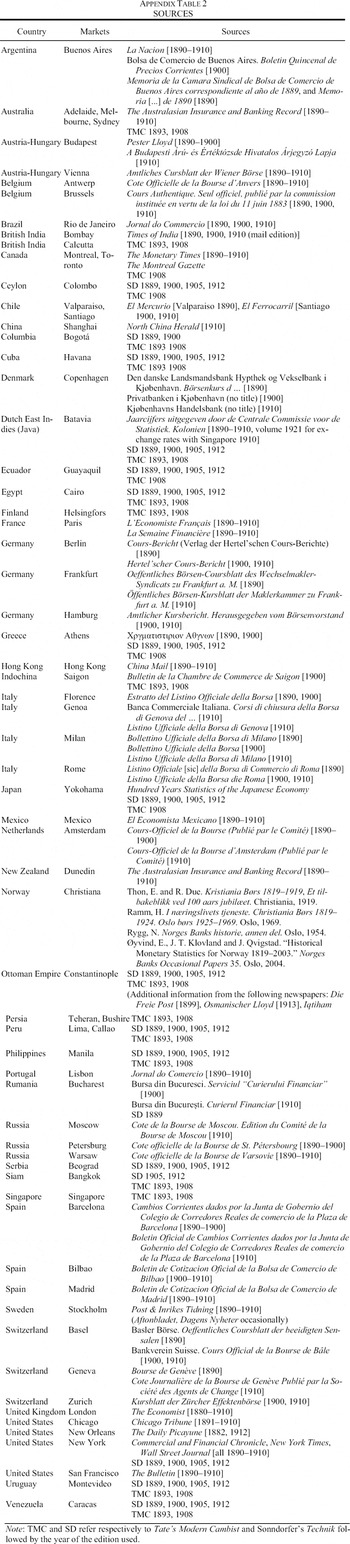
We suggest taking an indirect route. We use individual countries' “course of exchange” bulletins to collect information on the availability of every single currency in every single foreign exchange market.
The “Course of Exchange” as a Primary Source
The late nineteenth century saw the apogee of a foreign exchange system that had developed towards the end of the Middle Ages: international trade transactions were achieved through the use of “bills of exchange.” These were essentially negotiable bank overdrafts. They were issued to finance trade between distant places. Shipping commodities between two centers entailed a waiting period between the time when the exporter sent the goods and the time cash rolled in. Bankers enabled importers to draw on them a “bill of exchange” in order to settle purchases. Such bills could then be traded: Genoa holders of, say, bills payable in Barcelona, could sell them to Genoa debtors of Barcelona. The local existence of a supply and demand for bills payable in a foreign center created foreign exchange markets.8
According to de Roover, L'éevolution, the development of international money markets (i.e., foreign exchange markets) was a device to circumvent usury laws and, as a result, predated the development of domestic money markets.
The movement accelerated in the late Middle Ages. As argued by Raymond de Roover, in most banking places the merchant bankers had a meeting place where they congregated each working day at an appointed hour to negotiate bills and set the exchange rate.9
De Roover, L'évolution, p. 27.
Gradually, information on foreign exchanges quotations began to be recorded and circulated. As detailed by John McCusker and Cora Gravesteijn, the number of mercantile and financial journals increased during the early modern period.
10 McCusker and Gavesteijn, Beginnings. See also McCusker, Money and Exchange; and Neal, “Financial Press.”
In London, the “Course of Exchange” became an established institution in the late seventeenth century.
11 The “Course of Exchange” was the primary source for Larry Neal's path-breaking Rise.
By the late nineteenth century, virtually all countries had publications in which foreign exchange quotes were recorded: in some cases foreign exchange transactions were recorded in official Stock Exchange listings. In other cases, they were reported in semi-official leaflets, and then reproduced in the main local business and finance newspapers.
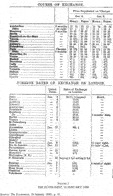
Figure 1 presents London's “Course of Exchange” table as it is given in The Economist, a British business and finance newspaper, on the second week of 1880.12
The Economist, first published in 1844, established itself as a source for quotations in the London market, replacing former publications by foreign exchange brokers such as Castaing and Wetenhall. During the 1850s and early 1860s there was a competition between the numbers provided by Wetenhall and those of The Economist (see Flandreau, Glitter).
The table comprises two parts. The upper part recorded the official quote
in London, in other words the prices for the two trading days of the Stock Exchange that intermediaries communicated to the journal. This was the London
Course of Exchange properly speaking, meant to reflect faithfully the situation in the London foreign exchange market. The lower part was unofficial in nature: it was established by
The Economist for the benefit of its readers, and made no claim to exhaustiveness or accuracy. It recorded from various sources the last known exchange rate quote
on London as it was set in a number of
foreign financial centers. For some centers the information could be up-to-date (e.g., from the same day in the case of New York, suggesting that the New York price of sterling bills was cabled to London), but quite old for others (four weeks for Buenos Aires).
13 For some centers, there was no information, and there were also centers that were simply just not included in the list.
FIGURE 1 THE ECONOMIST, 10 JANUARY 1880
Except for a notable chapter by Oskar Schwarzer and collaborators, previous researchers have not paid attention to these structural aspects of the exchange rate tables.14
Schwarzer, Denzel, and Zellfelder, “Das System.”
Yet their inspection reveals intriguing asymmetries. Some foreign centers, such as Paris, are listed in both parts of the table. But others, such as Buenos Aires, are listed in the bottom part only. This illustrates our earlier point that in London agents held no peso balances.
Of course, similar information exists for every single market. Therefore, by going to individual countries' listings and systematically collecting information as to whether each given center was quoted or not in other centers, one can construct “network matrices” that document global monetary relations. Let's call Xt the matrix of foreign exchange relations at date t. This matrix has dimension N × N (where N is the number of countries in the world), and comprises elements xij (i ≠ j), where xij = 1 if currency j is listed by country i, and xij = 0 otherwise. Consider for instance the miniworld comprising Argentina, Britain, and France in this order. Each row presents information from the listings in Buenos Aires, London, and Paris, respectively. A country quoting its own currency not making any sense, diagonal elements are “*.” Because in 1900 Paris quotes London, London quotes Paris, and Buenos Aires quotes Paris and London, we get the following matrix whose asymmetry reflects that of international monetary relations:
“Quoted” Means “Liquid”: A Detour via Lisbon
Modern studies of liquidity in foreign exchange markets rely on a measure known as the “bid-ask spread.” This spread measures the distance between the buying and selling prices in a dealers' market.15
See Hartmann, Currency Competition.
A narrow market has few dealers. This reduces competitive pressure and leads to a broadening of spreads. Such an “ideal” measure is not available for the late nineteenth century, except for a few instances.
16 The quotes of The Economist, however, must have been an example of bid-ask spreads, because “money” prices were the bid prices, the prices at which people were willing to buy foreign exchange and offering local money, whereas “paper” prices were the ask prices at which people were offering to sell the bills. Another example is Vienna, which recorded “Geld” (money) and “Waare” (paper) prices.
But the network matrices provide a proxy for liquidity: evidence of active trade reveals the existence of a sufficiently large demand and supply to warrant the posting of prices. Our dummy variable quoted/not quoted is therefore essentially an index of the bid-ask spread, and thus a measure of liquidity.
We got a strong sense of this while examining the data. For any given market the precise list of foreign currencies changed over time: some currencies were dropped, others were added. The disappearance of a given currency from the “Course of Exchange” listings usually followed a period when reported quotes had become occasional, suggesting a fading market.17
Alternatively, posted prices did not change, while all other rates were moving. This is a sure indication that no transactions were taking place: market authorities were just copying the latest available transaction on and on.
Such was the case, for instance, of the Brazilian currency, quoted in London in the 1840s, 1850s, and 1860s, which disappeared afterwards. Conversely, the emergence of a new currency in the list generally followed a period for which we found occasional references outside the “Course of Exchange” (i.e., in the press or in contemporary handbooks) to the availability of the said currency.
18 In 1900 the list given by The Economist does not include the U.S. Dollar. A foreign exchange handbook for the same year mentions the dollar, but adds: “This rate is only rarely quoted as the London rate in New York is almost always the only relevant rate for transactions between the United States and England.” (Sonndorfer, Technik, 1900 edition). Tate's Modern Cambist provides similar evidence.
In sum, the existence of an active quote for a given currency is a reliable indicator of the existence of a liquid underlying market.
This can be proven using evidence from the Lisbon foreign exchange market. In the Crédit lyonnais archives we found information on the buying and selling prices for foreign bills as they were posted in Lyonnais' Lisbon subsidiary, the Crédit Franco-Portugais. These were the over-the-counter prices at which the bank would sell or buy foreign drafts. As any bank, the Crédit Franco-Portugais could draw on, or remit in, any imaginable center. For instance, Crédit lyonnais, which had a branch in Saint-Petersburg, could easily sell a Russian bill to a Portuguese customer. For other centers, it could do the same using foreign correspondents.
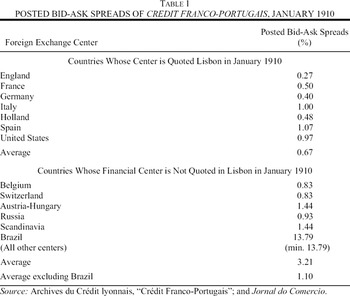
Comparing the bid-ask spreads posted by the Crédit Franco-Portugais for drafts on centers quoted in the Lisbon market and on centers not quoted there provides a test of our main proposition (Table 1). Our source for the Lisbon foreign exchange market is the Jornal do Comercio, the main business journal. As can be seen, the lowest bid-ask spreads (less than 0.5 percent for bills on London, Paris, Berlin, or Amsterdam) were precisely for the centers that featured in the foreign exchange market listings. Countries that were not part of the foreign exchange market listings had typically higher spreads (above 1 percent and much higher). Quotation is therefore a predictor of a narrow bid-ask spread.
Table 1 also shows that, on the margin, variations across posted spreads reflected Crédit lyonnais' competitive position as we know it from the work of historians such as Jean Bouvier: its branch in Russia, its tight links with Scandinavia as well as Belgium and Switzerland, are associated with lower bid-ask spreads despite these countries' currencies not being quoted in the Lisbon foreign exchange market.19
Bouvier, Crédit lyonnais.
Conversely, lack of direct connections with the United States, Spain, and Italy explain the relatively high posted spreads. The same mechanism must have operated for
Crédit Franco-Portugais's local competitors. In aggregate, currencies supplied by many competitors must have had low bid-ask spreads and found their way in the
Jornal do Comercio. In other words, viewing liquidity as an underlying unobservable variable, we can think of the observable variable “does quote/does not quote” as an index that takes value one when liquidity in a given market reaches a certain critical “liquidity threshold” and zero otherwise: “quoted” is synonymous for “liquid in that center.” Network matrices provide a bitmap image of the grayscales of international liquidity.
Data Collection
We then set to investigating individual countries' listings. The discovery of a huge collection of stock exchange listings and business newspapers corresponding to the period 1870–1920, and implausibly kept by Crédit lyonnais near Bayeux in Normandy, more famous for Queen Mathilde's Tapestry and apple brandy, enabled us to compile information for a fairly large number of markets. We then searched missing countries one after the other. The material was also checked against secondary sources such as contemporary foreign exchange handbooks: in the English language, Tate's Cambist; in French, Ottomar Haupt's Arbitrages et parités; and in German, Rudolf Sonndorfer's Technik des Welthandels.20
In the later part of the nineteenth century, Tate's Cambist was taken up by a number of different editors: Schmidt for the 1893 edition; Easton for the 1908 edition.
The handbooks were found to be less reliable than primary listings, but for the idiosyncratic centers with no identifiable foreign exchange lists (such as Colombo) they could not be surpassed. The resulting database spans almost the entire world.
Data collection only raised two substantive points. The first was to decide how restrictive our definition of “liquidity” should be. As seen in Figure 1, the U.S. dollar was not listed in the 1880 London “Course of Exchange.” Nor was it listed in 1890, 1900, or 1910. In 1912 Rudolf Sonndorfer argued that “little transactions in US dollars are taking place in London.”21
Sonndorfer, Technik, 4th edition, p. 246. The Economist began reporting a line for New York as early as in the 1850s, but it remained consistently empty for decades. In Paris, the U.S. dollar starts being listed in 1880, but there again, no transactions are reported until the 1890s when a moderately active market seems to be emerging.
Clearly, the dollar was not in these years a very liquid currency in London, and our dichotomous variable accounts for that. But there were less obvious cases as well, with currencies occasionally quoted. This was the case, for instance, for the dollar in London before 1880. Our strategy was to construct two “nested” databases. A narrow database is defined to include only those currencies for which we have evidence of an active market. A broad database includes all currencies for which we have traces of transactions. The narrow database is superior, but using the large database does not make a big difference for empirical results in large part because the two databases only differ on the margin. The rest of the article focuses on the narrow database. Both databases are available upon request.
The second issue was to decide how to deal with countries with several foreign exchange centers, such as Belgium (Antwerp and Brussels), Germany (Hamburg, Berlin, and Frankfort), Italy (Milan, Genoa, Rome, Turin, and Florence), or the United States (New York, New Orleans, Chicago, and San Francisco.) One possibility would have been to identify centers rather than countries. However, this was not feasible because a number of listings aggregated foreign regional markets: instead of quoting, say, “Antwerp” or “Brussels” they reported “Belgian centers” (most probably because of nationwide clearing arrangements that made regional centers close substitutes to one another for foreign dealers.) Given this situation, aggregating along national lines was the only option.
THE NETWORK OF INTERNATIONAL EXCHANGE, 1890–1910
The main features of networks can be summarized through a set of descriptive statistics: measures of average distances, measures of centrality, and groupings.22
Wasserman and Faust, Network Analysis.
The Four “Ds”: Dyads, Density, Distribution, Distance
The basic unit of analysis in a network is the “dyad.” Dyads record relations between two individuals in a pair. They take three possible forms—zero connection, one connection, or two connections—and are denoted as “(0, 0),” (“(1, 0)” or “(0, 1)”), and (1, 1).” In 1900 for instance, the dyad “Britain and Argentina,” is equal to (0,1).
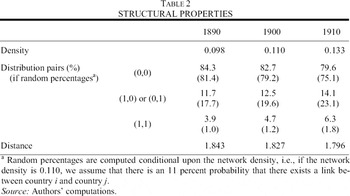
Density refers to the number of links in the network (number of times xij= 1), compared with the number of possible links (N × (N – 1)). Suppose that the likelihood of having a link between two countries is 50-50. The density ratio is then 0.5. As shown in Table 2, about 90 percent of the possible links were zeros: pre-1914 international monetary relations formed a highly parsimonious network.
Distribution of the dyadic links is another important variable. Their distribution across the three groups (0, 0), ((1, 0) or (0, 1)), and (1, 1) can be compared with what would obtain if links were drawn randomly (given the network density, which tells the probability to have a link between i and j). Table 2 shows that our network has less (0,1) and (1,0) but more (0,0) and almost four times as much (1,1) than implied by a random drawing. This suggests a greater tendency, ceteris paribus, towards reciprocal links.
Distance measures the average minimum number of “stops” that one needs to make in order to go from one country to another. This measure is taken regardless of the direction of the connection. In 1890 going from Argentina to China involved two possible shortest routes, each two stops long.23
These were (a) Buenos Aires-London and London-Shanghai and (b) Buenos Aires-Paris and Paris-Shanghai.
Distance thus measures the “closeness” of agents in the network. As seen in
Table 2, the average distance is around 1.80, meaning that on average it takes less than two stops to go from one currency/financial center to another one: all countries are either directly connected, or more often, connected via a third one. This points towards a highly hierarchical system.
“In-” and “Out-” Degrees
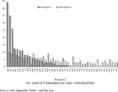
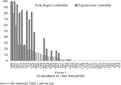
This brings to the fore the question of centrality. Network statisticians study centrality by focusing on the individual level. There are two ways an individual can relate to others: he or she can “send” or “receive” links. The corresponding links counts are known respectively as “out-degrees” and “in-degrees” or more informally “expansiveness” (propensity to “name” others) and “popularity” (tendency to be “named” by others). Figure 2 presents the in- and out-scores. The ranking is made according to the in-degrees, because “popularity” is the relevant criterion to judge the extent of foreign circulation of a given currency. Out-degrees by contrast probably reflect in part the heterogeneity of data sources, in part local foreign exchange market arrangements which caused some “Courses of Exchange” to report systematically more currencies than others, and in part structural characteristics leading some countries to diversify over a larger range of foreign currencies.
FIGURE 2 IN- AND OUT-DEGREES IN 1900: UNWEIGHTED
As seen, in 1900 three senior centers stand out: London, Paris, and Berlin/Germany in descending order. On the other end of the spectrum, we get a long list of countries that are quoted almost nowhere, such as Uruguay (only quoted by Argentina). This group comprises Latin American and Pacific Asian nations but also Canada and parts of Europe. Another important feature is the existence of a fairly large “middle class” between the two extremes. This class contains the United States and the North-Western European centers (Netherlands, Belgium, and Switzerland). It also reveals some surprises: Austria-Hungary, Italy, Spain, and to an extent Russia.
A possible limitation of the in-degrees as a measure of centrality is that they fail to weigh individual quotes according to the importance of those from whom they come. That Montevideo is quoted in Buenos Aires is not the same thing as being quoted in London. One can think of many different exogenous variables to weigh a quote in Argentina against a quote in Great Britain. We propose here an approach that is based on the intrinsic characteristics of the network, relying on the work of Stanley Wasserman and Katherine Faust, who present a whole family of status or “rank prestige” measures. The general idea is that the prestige of an actor depends not only on the number of times he or she is chosen but also on the prestige of those who choose him or her. An actor chosen by a lot of prestigious actors should also enjoy a high prestige, while someone selected by low ranked actors only should not. The interpretation for our monetary network is simple: a currency is more central if it is quoted in markets that are themselves home to a central currency. The result is an alternative centrality criterion, known as “eigenvector centrality.”24
For the derivation of the eigenvector centrality measure see Appendix 2.
Figure 3 contrasts “eigenvector centrality” in 1900 with the earlier “popularity” index. The hierarchy within the leading trio of pound, franc, and mark disappears: that the pound is quoted everywhere no longer makes a difference as franc and mark are quoted in all “relevant” places. By the same account, the centrality of the Belgian and the Swiss franc, the lira, and the Austrian crown increases significantly, reflecting the fact that these currencies are quoted in markets that are themselves relevant. The same is to a lesser extent true for the currencies of the Scandinavian nations, which benefit from being quoted in Berlin. The big loser, on the other hand, is the U.S. dollar, because it is mainly quoted in North and South America and East Asia, and not in the European centers.
FIGURE 3 IN-DEGREES IN 1900: WEIGHTED
These results are suggestive: By discriminating between more and less weighty markets, eigenvector centrality captures perhaps more closely the idea of a currency's “catchment area.” We can thus identify a tightly knitted group of countries around London, Paris, and Berlin, which includes Belgium or the Netherlands but also Italy and Austria-Hungary. In a second row we find the Iberian and Scandinavian countries, as well as Russia. These manage to extend their reach through listing in some leading foreign exchange market. It is to this second row that the United States can be compared, as a result of the “junior” status of the quotes it receives.
Cliques
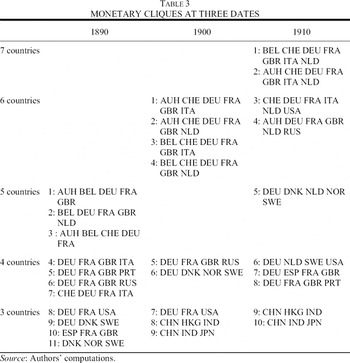
The previous discussion leads to another way of looking at inter-connectedness. The idea is to identify “cliques,” that is, groups of countries that have fully symmetrical relations. Members of a given “clique” do quote and are quoted by every other members of the same clique. Of course, any subgroup of a given clique is a clique, so that in practice it is enough to report the largest possible cliques. Results are presented in Table 3. Cliques tend to be predominantly European. Within Europe, some regional subgroups are also discernible, such as the North Western European groups, the German-Scandinavian group, etc. Importantly, the size of European cliques increases over time, culminating with seven-country cliques in 1910. This is evidence of Europe's tight and tightening financial integration. We also have some smaller (three-member) cliques emerging after 1900 in Asia (the Hong Kong, Shanghai, Bombay, and the Tokyo, Shanghai, Bombay triangles). This is in striking contrast with the Latin American world.
1900: A Map
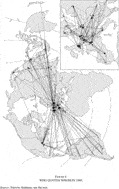
To conclude, we provide a map for 1900 (Figure 4). Arrows represent foreign exchange relations: for instance an arrow pointing from Portugal to Spain means that the Spanish currency is available in Lisbon. We have divided the map in two parts. The upper left part represents links between European and non-European nations. The bottom right part represents links among European nations. As seen, there are heavy links towards and within Europe, virtually no links within Latin America, and some links within Asia. The only non-European “hub” is the United States.
FIGURE 4 WHO QUOTES WHOM IN 1900
IDENTIFYING CURRENCY GROUPS: A MODEL
We have seen that some countries have similar ways to interact with one another and with third parties. For instance, France and England quote each other and are quoted by almost all non-European nations. It would be very useful, therefore, to generalize the concept of “cliques” and put together individuals in “classes” defined by homogeneous intraclass and interclass patterns. We do this by applying “block-modeling,” a network analysis method that groups actors by identifying classes of countries (or “actors”) with similar relational patterns.
In an ideal case, a class would fully determine its members' relational patterns: countries in the same class would be tied to other countries in exactly the same way: they would be said to be “structurally equivalent.” Description of a network comprising many agents then boils down to specifying relations among a few groups of individuals. Imagine for instance that our monetary network only has two types of countries. “C” countries would always quote each other and never quote “P” countries. “P” countries would never quote each other but always “C” countries. One could then refer to “C” countries as core countries, characterized by supremacy over the “P” nations, whereas “P” countries would be adequately termed peripheral, as they would hobnob to the international monetary system via the intermediation of “C” countries. Such a perfect equivalence, if it did exist, would be empirically easy to identify. Of course, our monetary network does not display this very appealing feature.
However, we can look for “near structural equivalence.” This means putting the analysis into a stochastic framework, and assuming that network links across groups are drawn from probability distributions: if they belong to the same class, countries i and j have the same ex ante probability to quote currency k. Ex post, they may end up with different realized links with k. But on average they will quote k just as often. The idea is therefore to back up the network structure from the realized (a posteriori) observed links. In the end, block-modeling identifies the structure that fits the data best.25
See Wang and Wong, “Blockmodels”; and Nowicki and Snijders “Estimation and Prediction.”
Here is how the program works: it seeks to infer from the data how many different (latent) classes of actors can be distinguished and to which class each actor belongs. It does so by estimating the posterior probability distribution of a given class structure. Membership of the actors in certain classes and the probabilities of ties between and within the classes are determined in an iterative procedure that seeks to maximize the likelihood of the observed patterns. Block-modeling then provides goodness-of-fit statistics to assess a particular partition of actors into classes, as well as the probabilities that two countries are in the same group (i.e., “structurally equivalent”). This is a powerful way to provide firm statements about the geography of money.
A Three-Tier World
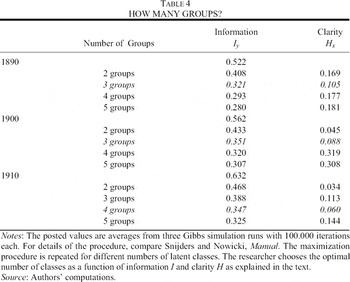
Identifying the number of groups requires trading off detail (summarized in the “Information” statistic, or Iy) against relevance (measured by the “Clarity” statistic or Hx).26
Computations were performed using StOCNET, a popular open software program to deal with block-models. See Boer et al. StOCNET and http://stat.gamma.rug.nl/stocnet/. The procedures are explained in Snijders and Nowicki, Manual.
Information and Clarity are maximized when their corresponding statistics are minimized. The intuition for why there should be two statistics rather than one is the following: just like the
R2 is improved in standard regressions by adding new explanatory variables, Information is always improved by adding new categories: there is therefore a need to adjust the amount of “Information” provided by increasing categories by the amount of “Clarity” this yields. However, unlike what happens in standard regression analysis, there does not exist at this stage any statistic to weigh Information against Clarity, so that output must be interpreted carefully.
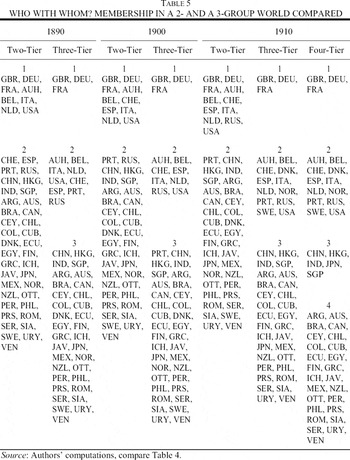
Results are reported in Table 4. A big gain in terms of Information is always obtained by going from two to three groups. This result is confirmed by the Clarity criterion, which is minimized for three groups in 1890 and for two or three groups in 1900. For 1910 the results are less obvious, with four groups being a possibility. However, as we shall see later, the four groups are really embedded in a three-groups system. The overall conclusion, therefore, is that the three-tier structure is the one that fits the data best. There were three, not two, groups of countries in the international monetary system of the late nineteenth century, and rather than describing it in terms of “core” and “periphery,” we should refer to “key,” “intermediate,” and “peripheral” countries.
Let's now consider the composition of each group (Table 5). We focus on the three-tier grouping. The key currency group is the most clearly identified.27
The probability for the three currencies to be in the same group is always higher than 90 percent, and the probability for all other currencies to be among the key group inferior to 10 percent.
It comprises, for all periods, the pound, the franc, and the mark. This matches Peter Lindert's identification of these very three as the leading currencies in the late nineteenth century. Note that Lindert's conclusions rested on evidence that these “key” currencies were held by foreign central banks.
28 Of course, for foreign exchange market intervention one prefers a currency with a liquid market, which squares nicely with our starting assumption.
The second group of intermediary currencies mostly comprises European nations. The surprise is that in this category we do find, besides the United States, both the likes of Switzerland, Belgium, or the Netherlands and countries such as Austria-Hungary, Russia, Italy, and Spain. However, this finding is in line with recent work, which has found evidence for supposedly “peripheral” countries, such as Austria-Hungary, of exchange rate management techniques that have conventionally been associated with “core nations.” Unlike “genuine” peripheral countries, such nations seemingly had a “European” (if not an international) circulation for their currency that made them more similar to their North-Western European counterparts.29
Standard accounts of “core” countries exchange rate management techniques may be found in Eichengreen and Flandreau, Gold Standard; Flandreau and Komlos, “Target Zones,” argue that Austro-Hungarian monetary policy relied on stabilizing foreign exchange speculation.
Due to their links with Germany and their close connections among each other, Scandinavian countries (Denmark, Norway, and Sweden) are found at the margin of this European club in 1910.
30 Although grouped with the European club in 1910, all three have probabilities between 30 and 40 percent to be in fact with the peripheral group.
Finally, the periphery regroups those nations whose currencies are nowhere to be found apart from their domestic market and maybe one neighboring country. These include Latin America (Mexico, Argentina, Brazil, Chile, Colombia, Cuba, Venezuela, Ecuador, and Uruguay), some Colonial or Commonwealth nations (Canada, Australia, New Zealand, the Dutch East Indies, Ceylon, French Indochina, Egypt, and the Philippines) and the European South-East border (Turkey, Greece, Romania, and Serbia). Highly interesting is the Asian subgroup within the periphery, consisting of China, Hong Kong, British India, Japan, and the Strait Settlements (Singapore).31
The blockmodel suggests this fourth cluster as optimal for 1910 only, but the group appears in 1890 and 1900 as well, as soon as a four-tier structure is allowed.
Although these countries are clearly peripheral in their relations with the key and the intermediate group, they differ from the other peripheral countries by being connected among themselves. This fabric is much less densely woven than in Europe, but it marks a clear contrast to Latin America, Australasia, or the Balkans, which are exclusively oriented towards Europe.
Group membership is stable, but there are exceptions. In a similar exercise for 1880, based on substantially fewer countries and therefore not reported here, we found the Dutch Guilder and the Belgian Franc in the key currency group. They decline afterwards. The fate of the United States dollar did experience an opposite trend. In 1880, one could not reject its membership in the periphery. In 1890 we find it in the intermediate category and in 1900 it was still probably more on par, as far as international circulation is concerned, with such currencies as the Dutch guilder or the Belgian franc than with the British pound, French franc, or German mark. It is only in 1910 that we find it emerging on the top of the intermediary league.32
“The top of the intermediate league” means the following: at that date, while clearly in the intermediate group, it has the largest probability in its class to be part of the key currencies.
This rapid rise distinguishes it from any other country in the world. At the same time, this ascendancy seems somewhat delayed given that by 1910 the U.S. economy had already taken over in many areas. This is undoubtedly something that future research should focus on.
Finally, if we restrict the software to grouping countries on the basis of a two-tier system, we inevitably fall back on a list of “core” countries that essentially pools the list of “key” and “intermediate” countries: thus, if we really want to picture global monetary relations as a dual system, then we should be prepare to grant seniority to a much larger pool of nations than research has so far acknowledged. The superior alternative is to recognize that there were really three groups.
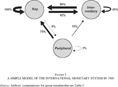
It is now time to provide a simplified characterization of the international monetary system. This is done in Figure 5. A straight arrow from group A to group B does mean “members of group A do quote members of group B with probability x” (reported near the arrow). Reflexive arrows mean “members of group A do quote counterparts in group A with probability x” (reported near the arrow). As seen, key countries always quote each other's currency (100 percent). They generally quote intermediate countries (92 percent) but barely any peripheral countries. Intermediate countries almost always quote key currencies (96 percent), and fellow intermediate currencies half of the time (45 percent). They never quote peripheral currencies. Finally, peripheral countries almost never quote each other (3 percent), rarely the intermediate currencies (10 percent), and most of the key currencies (75 percent).
FIGURE 5 A SIMPLE MODEL OF THE INTERNATIONAL MONETARY SYSTEM IN 1900
Two conclusions are in order. First, as is apparent in Figure 5, the pre-1914 international monetary order exhibited much hierarchy. Second, key countries and intermediary countries had almost symmetrical relations so that in a world restricted to these two groups, there would be no real point opposing one group to the other one. In effect, it is the periphery that enables one to discriminate between the two top groups, through the sharp contrast between the relationships it entertained with each category. In other words, it is the periphery that permits us to tell the key and intermediary groups apart.
CONCLUSIONS
This article started from the premise that any country's adjustment mechanism depends heavily on the degree of the international circulation of its currency. We identified an indicator of international liquidity, captured by a dichotomous variable reflecting the existence of directional relations between countries' financial markets. Such variables are amenable to modern network analysis techniques, and we provided a procedure for automatically identifying “core” and “peripheral” nations around 1890–1910.
This procedure yielded a striking result. The monetary order of the late nineteenth century is best described as having been made up of at least three groups, rather than the two groups generally referred to. Specifically, we found, between Peter Lindert's “key currencies” (pound sterling, franc, and mark), and the currencies in Alec Ford's “periphery” (the Argentine peso being the archetype), a middle class, mostly made up of the currencies of European nations, but through which the United States dollar passed on its way to the top. Alternatively, if only two groups are to be identified, then we are bound to call “core” nations a much broader group than is conventionally considered. Most strikingly, such countries as Italy, Russia, Spain, or Austria-Hungary were definitely not peripheral. Their currencies enjoyed a regional circulation and were known to bankers in a number of leading European centers.
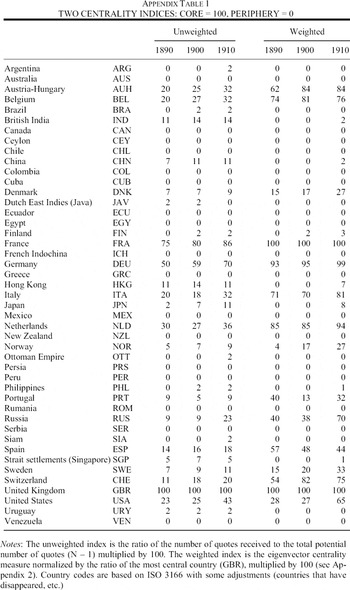
We hope that these findings will provide a firmer basis for future empirical work seeking to contrast economic performances in alternative groups of countries. The classifications reported in Table 5 can motivate more rigorously the use of separate regressions for different groups. Similarly, the indices of centrality that we constructed can be used as controls of the influence of centrality in econometric work. For the convenience of future research, the readers can find in Appendix Table 1 two brands of monetary geography indices.
Future research will need to explain the emergence of the structure we identified, and to measure carefully how much it did matter. The first question is Terra Incognita. On the second issue, research is also needed, but there is already evidence that the structure identified did matter. For instance, we know that “core” and “intermediate” countries were able to circulate debts denominated in their own currency on foreign markets, whereas members of the periphery were not.33
Flandreau and Sussman, “Old Sins.”
Similarly, recent research has reported evidence of a greater contribution of exchange rate movements to external adjustments in countries belonging to our “periphery”—unsurprisingly given that they could not borrow so easily abroad.
34 Catao and Solomou, ”Exchange Rates.”
More work is needed to go beyond these general remarks. But we believe our findings might open new perspectives. These perspectives should, at the very least, have the potential to free us from the conventional reference, when it comes to explaining the pre-1914 international monetary order, to those famous “rules of the game” of which it is only known that they never existed.
Appendix 1: Indices and Sources
Appendix 2
Following Wasserman and Faust,
35 Wasserman and Faust, Network Analysis
we take the network matrix
X and define
p to be a vector of rank prestige measures
pi (
i ε [1,
n]),
pi is the sum of the
pj's of all actors choosing
i. Calling
xji the variable that indicates whether actor
j quotes
i or not, we get for all
i:
Or matrix notation:
To solve for p, note that p is the eigenvector of the transpose XT corresponding to an eigenvalue of 1. In general, XT will not have an eigenvalue of 1. What we do here is choose as p the eigenvector corresponding to the largest eigenvalue.36
For alternatives see Wasserman and Faust, Network Analysis. Bonacich and Lloyd, “Measures of Centrality,” compare a number of eigenvector-like measures of centrality and show that these are equivalent under the assumption or rule, also adopted here, that actors not chosen by anyone have a rank of zero and can thus not contribute to the rank of the actors they choose.
To render the rank prestige measure comparable with the indegree popularity, we normalize by dividing through the rank of the highest ranked country, which is Britain in our case. Multiplying by 100 gives the weighted centrality measure depicted in
Figure 3 and tabulated in
Appendix Table 1.
The authors are grateful to Roger Nougaret of the Crédit lyonnais archives for dedicated assistance. We also thank, for their generous help with collecting or double checking information from local sources: Andrés Regalsky for Argentina, Carlos Marichal for Mexico, André Villella for Brazil, Jaime Reis for Portugal, John James for the United States, Anders Ögren for Sweden, Camilla Brautaset, Lars Fredrik Øksendal, and Jan Tore Klovland for Norway, Ignacio Briones for Chile, and Rumen Avramov for Bulgaria. For Japan, the help of Mariko Hatase, from the Bank of Japan's Institute for Monetary and Economic Studies, is gratefully acknowledged. Advice from Ian MacLean for Australasia, Larry Schembri and Greg Smith for Canada, Edhem Eldem and Sevket Pamuk for Turkey, and Amiya Bagchi for India, helped to identify the relevant source for foreign exchange quotations. John Tang, a graduate student at UC Berkeley scanned material for China. Ignacio Munoz collected the material for Chile. Juan Flores kindly collected additional material in London, and David Khoudour-Castéras in Berkeley. Flandreau thanks the University of California at Berkeley and Barry Eichengreen for hospitality in the Fall of 2003. Comments on earlier drafts during presentations at New York University (April 2004), at the Business History Conference on Networks in Le Creusot, France (June 2004), at the European University Institute in Fiesole (June 2004), at the 2004 Economic History Berlin Colloquium, and at the IMF research department (November 2004) were very useful. The suggestions of the editor and the anonymous referees, as well as those of Jorge Braga de Macedo on the final draft are gratefully acknowledged. We finally thank Emmanuel Lazega and Chris Ansell for their advice on network analysis. The responsibility for errors and misinterpretations remains ours.