To what extent do political parties influence citizens’ opinions about policy issues? The answer to this question has implications for our understanding of citizens’ political psychology and participation, and, by extension, for descriptive and normative theories of democracy. It is thus unsurprising that a large body of work has been dedicated to studying the influence of political parties on citizens’ policy opinions (for recent reviews, see (Bullock Reference Bullock2011, Reference Bullock2020; Tappin Reference Tappin2020)). The results of this work speak in a clear voice: When parties take positions on issues, citizens update their opinions toward the positions of preferred parties, and away from those of dispreferred parties on average.
Supporting this conclusion are dozens, and perhaps even hundreds, of studies using survey experimental designs in which exposure to the policy positions of parties is randomized. These survey experiments avoid the challenges to causal inference that arise when studying observations of party position-taking in the real world (Slothuus and Bisgaard Reference Slothuus and Bisgaard2020). For example, among other challenges, it is often difficult to completely rule out unobserved confounders – variables that affect both the party position and citizens’ opinions, inducing a spurious, non-causal association between the two – as well as reverse causation; the possibility that party position-taking was influenced by citizens’ existing (or projected) opinions, rather than the other way around (Zaller Reference Zaller2012).
The strengths and weaknesses of survey experiments are well documented (Barabas and Jerit Reference Barabas and Jerit2010; Gaines, Kuklinski, and Quirk Reference Gaines, Kuklinski and Quirk2007; Mullinix et al. Reference Mullinix, Leeper, Druckman and Jeremy2015). In particular, while they allow for clearer causal inferences, this can come at a cost to external validity; the extent to which the results can be accurately generalized to explain or predict observations in other contexts, such as the dynamics of public opinion observed in the real world. In this respect, one of the foremost limitations of the prototypical survey experiment may be its transience, given that “background information, experimental treatments, and outcomes [are recorded] all in the space of a few minutes” (Coppock Reference Coppock2021, Ch.6). For example, if opinion change observed in survey experiments dissipates as soon as the survey is over, scholars might reasonably ask “in what real-world scenario would such effect[s] matter?” (Gaines, Kuklinski, and Quirk Reference Gaines, Kuklinski and Quirk2007) and conclude that the effects are mostly laboratory curiosities (Coppock Reference Coppock2021, Ch.6).
Survey experiments on the influence of party cues do not escape these concerns. In the overwhelming majority of such survey experiments, policy opinions are measured in the same survey as the party cue treatment is delivered; in many cases, even on the same survey page as the party cue treatment. Indeed, we are aware of just one party cues survey experiment in which respondent’s policy opinions were collected in a later survey conducted sometime after the initial survey (Coppock Reference Coppock2021, Ch. 6, Study 6). As a result, the question of whether and to what extent party cue effects persist beyond the typical survey treatment remains unclear. The answer to this question has implications for our understanding of the scope, and likely mechanism, of party influence as it occurs in the real world.
For example, whether party cues constitute powerful or marginal influences on citizens’ policy opinions is a topic of long-standing interest. However, it has been difficult to draw general conclusions about the magnitude of party cue influence because of the substantial variation between different studies’ estimates (Bullock Reference Bullock2011, Reference Bullock2020; Tappin Reference Tappin2020). Studying the extent to which party cue influence persists may provide new insight into whether party cues constitute powerful or marginal influences on citizens’ policy opinions. If large initial effects mostly dissipate 10 min after the survey has ended, this puts pause to the inference that party cues are powerful shapers of citizens’ policy opinions; an inference that could have otherwise readily been made on the basis of the large initial effects.
Furthermore, identifying the persistence of party cue effects can help to advance scientific understanding of the relative influence of party cues versus substantive policy information on people’s opinion formation (Bullock Reference Bullock2011; Cohen Reference Cohen2003). In particular, while studies estimating the persistence of party cue effects are generally lacking, there are numerous studies that estimate the persistence of substantive information. Kuziemko and colleagues (Reference Kuziemko, Norton, Saez and Stantcheva2015), for example, conducted survey experiments in which they exposed people to detailed, interactive information regarding US income inequality and measured people’s attitudes toward inequality and preferences for redistribution. They found that some effects of the information persisted at similar magnitudes 1 month later. Coppock and colleagues (Reference Coppock, Ekins and Kirby2018) conducted survey experiments in which they exposed people to lengthy, newspaper opinion editorials on a variety of policy issues, finding that initial changes in attitudes persisted up to 1 month later at around 50% of the magnitude. These and numerous other studies suggest that opinion change due to information treatments generally persists, sometimes for a considerable length of time (Coppock Reference Coppock2021, Ch.6). In contrast, perhaps party cue effects much more quickly dissipate, despite sometimes causing a larger initial change in opinions than substantive information. This notion is suggested by prominent theoretical accounts of party cue effects, which posit that cues are processed “heuristically” rather than systematically (Bullock Reference Bullock2020; Mondak Reference Mondak1993; Tappin and McKay Reference Tappin and McKay2021); thus, their influence may wane faster than that of substantive information. If this is the case, it would paint a more nuanced picture of the relative influence of party cues versus substantive policy information on people’s opinion formation.
Finally, studying the persistence of party cue effects in survey experiments can also offer insight into the likely mechanism by which party cues shape public opinion in the real world. For example, suppose that influence due to a single exposure is typically fleeting, dissipating soon after the survey has ended. This would imply that, for real-world party cues to meaningfully shape public opinion as measured in polls and at the ballot box, exposure may have to be repeated or be delivered via specific channels such as trusted news media or one’s social network; channels that may enhance persistence. Subsequent survey experiments could investigate such ideas. Before then, however, comes the task of estimating persistence of party cue influence in the prototypical survey experiment. We take up that task here.
Our experiment
We conduct a panel survey experiment in which, during an initial survey, American adults are randomly exposed to party cues (or not) on five contemporary US policy issues, and we collect their opinions on the issues. Respondents are then re-contacted 3 days later, at which point we collect their opinions on the five policy issues again. This is a standard panel survey experiment design for estimating the persistence of treatment effects. However, in the spirit of enhancing the external validity of our persistence estimates, we also include a slight modification of this standard design by randomizing whether respondents give their opinions in the initial survey or not (irrespective of this randomization, all respondents give their opinions in the follow-up survey). The logic of this design modification is that, when people are exposed to party cues in the real world, they are typically not required to report their opinion on the policy in question at the same time. Rather, their opinion may be polled at a later time; in conversation with friends, while posting on social media, and so on. Asking survey respondents to report their opinions immediately posttreatment may “crystallize” the treatment effect, boosting its persistence, but in a manner that does not reflect the dynamic between real-world party cues and opinion formation. Concretely, we thus expected that respondents who report opinions at both initial and follow-up survey (the standard design) would exhibit stronger persistence than those who only report opinions at follow-up.
To preview our results, we find that party cue influence persists at approximately 50% magnitude 3 days later. Contrary to our expectations, however, we find no evidence that persistence is weaker among those who only report opinions at follow-up.
Methods
Design
Respondents entering the survey were informed that this was a two-part survey, and that people who completed both parts would receive an additional 10% bonus payment. After providing informed consent by clicking through the consent form, they answered pretreatment demographics questions before proceeding to the policy rating segment of the survey. In the policy rating segment, respondents saw five contemporary US policy issues in randomized order (one per survey page) and, on each issue, were randomly assigned to receive either a party cue or no cue. The issue questions were
-
1. Should an in-state sales tax apply to online purchases of in-state buyers from out-of-state sellers?
-
2. Should pension payments be increased for retired government workers?
-
3. Should the Federal Reserve Bank be audited by Congress?
-
4. Should the US increase or decrease foreign aid spending?
-
5. Do you support a single-payer healthcare system?
These issue questions and their corresponding party cues were sourced from the website www.isidewith.com, an online encyclopedia that collates and provides Americans with information about the policy positions of dozens of political candidates and leaders. The encyclopedia professes to be non-partisan and not affiliated with any candidate, political party, corporate sponsors, investors, or interest groups. These issues were chosen on the basis of recent research which found at least moderately sized party cue effects on the issues when opinions were collected immediately posttreatment (Tappin Reference Tappin2020). Part of our rationale for selecting the issues this way was to maximize the immediate posttreatment effects, thereby facilitating our chances of statistically detecting persistence at follow-up. The party cues consisted in the positions of Donald Trump and Barack Obama on each issue, as documented by the analysts at isidewith. For all issues, the positions of Trump and Obama were always in opposition, and respondents assigned to the party cue treatment always saw both leaders’ positions. The delivery of the party cue treatment is illustrated in Figure 1. There was no deception used in the party cue treatments or survey as a whole, negating the need to debrief respondents. The experiment reported in this article is under the approval of the Committee on the Use of Humans as Experimental Subjects at Massachusetts Institute of Technology.
Illustration of the party cue treatment in our design.

Prior to starting the policy rating segment, respondents were randomly assigned to either report their policy opinions at both initial and follow-up surveys – the standard persistence design – or only at follow-up. Respondents in the latter condition were not asked to give their opinion on any of the policy issues in the initial survey, whereas, those in the former condition were asked to do so. Three days after the initial survey was fielded, respondents who completed the survey were re-contacted and invited to complete the follow-up survey. We closed the follow-up survey after it had been in the field for 2 days. In the follow-up survey, respondents saw the five policy issues again (in randomized order) and all respondents were asked for their opinion on each issue. In both initial and follow-up surveys, opinions were given on a seven-point Likert scale, anchored from “Definitely No” (1) to “Definitely Yes” (7) for issue questions 1, 2, 3, and 5; and from “Definitely Decrease” (1) to “Definitely Increase” (7) for question 4. The full survey instrument is available online at https://osf.io/t7qdr/.
For our analysis, we recode policy opinions such that higher values indicate greater agreement with the in-party cue. For example, a Democrat respondent who strongly supported the “Bank audit” policy – originally a score of 7 on the opinion scale – would receive a score of 1, since the in-party cue (Obama’s position) is to oppose this policy. In contrast, a score of 7 from a Republican respondent would retain its original coding, since the in-party cue (Trump’s position) is to support the policy. (And vice versa for issues where the cue direction is reversed.) Accordingly, the expected sign of the party cue treatment effect is positive for all respondents and issues. (We report results separately for Democrats and Republicans in the Appendix.) Respondents’ partisanship is determined by their party preference using a pretreatment party ID question. Those who identified as Independents were asked who they would prefer to be in power in the USA – the Democratic or Republican Party – in a binary forced-choice question, and this is treated as their party preference for the outcome re-coding. (We also analyze the data excluding Independents in the Appendix; the results are the same).
Sample
We aimed to recruit 850 American adults from the survey provider Prolific, which would correspond to a total of 4,250 observations given our design (850 * 5). A total of 879 respondents started the initial survey; 854 completed the initial survey; and 773 completed both the initial and follow-up surveys. In the Appendix, we report the results of a frequentist sensitivity power analysis, illustrating the size of party cue effects we can reliability detect with our sample and design. Under reasonable assumptions about the data generating parameters, this analysis indicates that our sample and design can detect a standardized party cue ATE of between 0.15 and 0.20 with >80% power. That is, an effect size that is conventionally considered small.
Samples recruited via Prolific are convenience samples, not representative of the general US population. For example, they tend to skew more educated and Democrat. However, a growing body of evidence suggests this does not particularly compromise the generalizability of our estimates: formal comparisons between treatment effects estimated in convenience samples versus those in national samples indicate the two often correspond quite closely (Coppock Reference Coppock2019; Mullinix et al. Reference Mullinix, Leeper, Druckman and Jeremy2015). The initial survey was fielded on January 14, 2021.
Attrition
A total of 106 respondents dropped out of the panel survey (879–773). Of these losses, 14 occurred pretreatment and 11 during the posttreatment policy rating segment of the initial (t0) survey. The remainder were lost between the two survey waves (i.e., panel attrition), with 81 of 854 respondents (∼9%) failing to complete the follow-up (t1) survey after completing the initial survey, making for a sample return rate of approximately 91% (N = 773). All panel attrition is by definition posttreatment in our design. While low, this rate of attrition is not negligible, and so we follow others in only analyzing data from respondents who completed both survey waves, to allow for more valid comparisons between treatment effects estimated at initial versus follow-up surveys (Coppock Reference Coppock2021, Ch.6). However, this approach assumes that all posttreatment attrition is non-differential between treatment and control groups (if dropout is differential by treatment, it could introduce bias into our estimates). We examine this assumption in detail in the Appendix but provide a brief summary here.
In the Appendix, we report the results of models predicting posttreatment dropout as a function of treatment assignment to party cue (for each issue) or opinion measurement condition: t0–t1 versus t1-only (t0–t1 denotes the condition in which respondents’ opinions were measured at both initial and follow-up surveys, while t1-only denotes the condition in which their opinions were only measured at follow-up). There is no evidence of differential dropout by opinion measurement condition: assignment to measurement condition does not predict posttreatment dropout (p >.05). In contrast, there is some evidence of differential dropout by party cue treatment on the “foreign aid” issue: respondents assigned to the control (no cue) condition on this issue were more likely to dropout than those assigned the party cue (p <.001). In terms of raw numbers, of the 92 respondents who dropped out posttreatment, 63 were in the control (no cue) group on the foreign aid issue, and 29 were in the treatment (party cue) group. While this may well be statistical noise, we take several steps to mitigate the risk of bias in our treatment estimates at initial and follow-up surveys. In particular, as well as our primary models reported below, we fit additional models in the Appendix in which we (a) adjust for a range of pretreatment covariates that are (mildly) correlated with our outcome variable and (b) exclude the foreign aid issue. The results of these models are substantively identical to those reported below, obviating serious concerns about bias.
Results
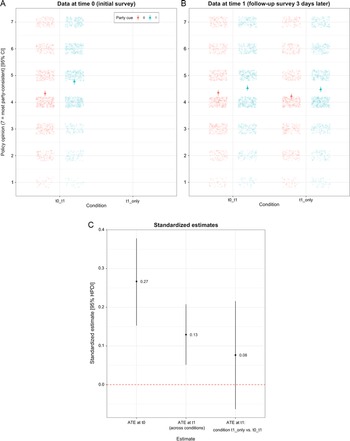
Panels A and B in Figure 2 show the raw data from the initial survey (t0) and follow-up survey (t1), respectively. The x-axis indicates the between-subjects’ randomization to conditions in which respondents either reported their policy opinions at both t0 and t1 – the standard persistence design – or only at t1. The outcome variable, policy opinion, is on the y-axis and is coded such that higher values equal more party-consistent opinions (see Methods). As indicated by the raw data in Figure 2A, in the initial survey, respondents updated their opinions toward the in-party cue on average when this was learned. The raw effect size is approximately half a Likert-scale point, consistent with previous research (Bullock Reference Bullock2011; Tappin Reference Tappin2020). Figure 2B shows the data from the follow-up survey, which suggest the influence of the party cue is somewhat attenuated, but not eliminated, by follow-up. Interestingly, and inconsistent with our expectation, the influence of the party cue at follow-up does not appear to be larger in the t0–t1 measurement group (standard persistence design) compared to the t1-only group. If anything, the raw data suggest that party cue influence at follow-up is smaller in the t0–t1 measurement group.
Data and aggregate results from the panel survey experiment. Panel A shows the raw data from the initial survey (t0). Panel B shows the raw data from the follow-up survey (t1). The raw data have slight vertical jitter to aid visibility. The y-axis in panels A and B is the Likert scale response, re-coded so that higher values equal policy opinions that are more consistent with the in-party cue (see Methods). The data are colored according to the control (no cue) and party cue conditions, and the means and 95% confidence intervals are overlaid. The x-axis in panels A and B splits the data according to whether respondents reported their policy opinions at both t0 and t1 (the standard persistence design) or only at t1. Panel C shows the estimates in standardized units from the Bayesian multilevel models fitted to the raw data. The error bars are 95% highest posterior density intervals. From left to right in panel C, the x-axis shows the ATE at t0, the ATE at t1 (averaged across opinion measurement conditions) and the difference between the t1 ATE in the two opinion measurement conditions.

In Figure 2C, we show the estimates in units of standard deviation (SD). The left-most estimate is the average treatment effect (ATE) of the party cue at t0. We obtain this estimate by fitting a Bayesian multilevel model to the observation-level data at t0 with a dummy variable for party cue treatment. The model allows the ATE of the party cue to vary across the five policy issues, as well as across respondents. The prior distributions on the model parameters are vague and weakly informative, allowing the data to “speak for itself.” The model is fitted using Stan via the package brms (Bürkner Reference Bürkner2017) in the statistical software R and is written formally in the Appendix along with greater detail regarding model specification and diagnostics.
The middle estimate in Figure 2C is the ATE of the party cue at t1, averaged across t0–t1 and t1-only measurement conditions. Finally, the right-most estimate is the difference between ATEs at t1 in the t0–t1 versus t1-only condition and is coded such that positive values imply that the ATE in the t1-only condition is larger. The middle- and right-most estimates are obtained by fitting a Bayesian multilevel model to the observation-level data at t1, with dummy variables for party cue treatment, t1-only condition, and their interaction term. All three parameters are allowed to vary across the five policy issues; and the party cue ATE parameter across respondents. As before, the prior distributions on all parameters are vague and weakly informative. (Further details are in the Appendix.)
As implied by the raw data, the ATE of the party cue at t0 is in clear evidence and is bounded convincingly away from zero – indicated by the 0.95 intervals. The ATE of the party cue at t1, 3 days later, is approximately 50% of the magnitude and is also bounded away from zero.Footnote 1 Finally, inconsistent with our expectations, the sign of the difference-in-difference estimate is positive (right-most estimate in Figure 2C). This implies that the party cue ATE at t1 was on average ∼0.08 SDs larger in the t1-only versus t0–t1 opinion measurement condition, though the interval overlaps comfortably with zero. In other words, respondents who reported their opinions in both survey waves did not exhibit greater persistence than respondents who only reported their opinions at follow-up. Thus, we find little evidence in these data that the standard persistence design – measuring opinions immediately posttreatment and then again at follow-up – crystallizes the treatment effect, thereby inflating estimates of persistence relative to measurement at follow-up only. Further tests of this possibility are nevertheless required to confidently rule it out.
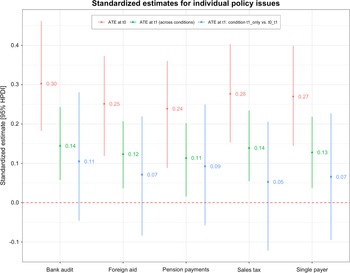
Our design also affords the first exploration of whether and how persistence estimates vary across different policy issues. For example, perhaps people are more likely to learn the positions of parties on issues that are more important or salient (e.g., single-payer healthcare) versus less so (a new in-state sales tax), thereby enhancing persistence. Figure 3 shows the estimates for each policy issue in our sample. The estimates are computed from the full posterior distributions of the models fitted to obtain the aggregate results, not the result of fitting new or separate models for every issue. Thus, the issue-level estimates are mildly regularized, improving their out-of-sample accuracy on average (McElreath Reference McElreath2020). We observe little evidence of heterogeneity in any of the estimates across policy issues: the influence of the party cue persists 3 days later at approximately 50% magnitude for all the issues in our sample. The data and code necessary to reproduce the results in this paper are available online (Tappin and Hewitt Reference Tappin and Hewitt2021).
Issue-level estimates from the panel survey experiment.

Conclusion
The results of our panel survey experiment suggest that party cue influence observed in survey experiments persists beyond the confines of the survey experiment; by our estimates, remaining at approximately 50% of its original magnitude 3 days later. This finding is more compelling for the fact that we also observed it in our t1-only measurement condition, in which respondents did not give their opinion (nor see the opinion scale) at the time they were initially exposed to the party cues. Had we implemented only the standard persistence design (t0–t1 measurement) and observed our results, a reasonable explanation for the observed persistence would be that some respondents simply remembered how they answered at t0 and reproduced this answer at t1. Our design and results largely negate this explanation. Thus, our results largely negate the concern that party cue influence regularly observed in survey experiments simply reflects highly transient priming or a mere response bias, rendering the phenomenon a laboratory curiosity only (Coppock Reference Coppock2021, Ch.6; Gaines, Kuklinski, and Quirk Reference Gaines, Kuklinski and Quirk2007).
Despite the large number of survey experiments investigating the influence of party cues (Bullock Reference Bullock2020; Tappin Reference Tappin2020), there is a lack of evidence that can speak to whether and how this influence persists. The one exception of which we are aware is Study 6 reported in Coppock (Reference Coppock2021, Ch.6). Replicating a party cues survey experiment conducted by Nicholson (Reference Nicholson2012), Coppock finds that an initial ATE of ∼0.13 SDs completely disappears by follow-up 10 days later. This discrepancy with our persistence result could be due to various factors. For example, the initial ATE is considerably weaker than that observed in our experiment, which could be due to differences in how the party cue treatment was operationalized. We included thumbnail pictures of the party leaders’ faces in our treatment, for instance, whereas Coppock/Nicholson did not. Furthermore, it is plausible that Donald Trump is a more polarizing figure than John McCain. The upshot is that perhaps larger initial party cue effects persist for longer, explaining our discrepant results (but see Coppock Reference Coppock2021, Ch. 6 for indirect evidence against this hypothesis). Another obvious explanation is that we measured persistence after 3 days, whereas Coppock measured it after 10 days. In theory, our results could be entirely consistent if party cue effects generally persist up to and beyond 3 days but disappear by the tenth day posttreatment.
Therefore, taken together these estimates suggest that detectable persistence of party cue influence in survey experiments sits somewhere between 3 and 10 days’ posttreatment, with the caveat that it could well be longer. This provides a baseline for future work to build upon when investigating heterogeneity in, and predictors of, the persistence of party cue effects. For example, nascent research on the persistence of news framing effects suggests that an individual’s political knowledge is a reliable predictor of persistence there (Lecheler and Vreese Reference Lecheler and de Vreese2016). Given the long-standing interest in political knowledge as a moderator of (immediate) party cue effects (Bullock Reference Bullock2020), a natural next step is to ask whether political knowledge also predicts the persistence of these effects.
What implications do our results have for understanding the scope, and likely mechanism, of party influence as it occurs in the real world? First, that a single, brief exposure to a party cue detectably influenced opinions 3 days later speaks to the potential power of party cues in shaping public opinion. It is likely that even people who do not follow politics closely are occasionally exposed to party cues on various issues; our results imply these exposures may well exert meaningful influence, that is, that persists beyond a day or two (see also Weeks, Lane, and Hahn Reference Weeks, Lane and Hahn2021). Furthermore, party cues are easily disseminated – and increasingly so – to large numbers of people via social and partisan media, meaning that short-term persistence may be “topped-up” regularly, and with little effort on the part of consumers. By contrast, for substantive policy information to influence opinions often requires significantly more effort in the sense that people must actively consume (e.g., read or otherwise closely attend to) such information.
On the other hand, however, evidence regarding the persistence of information effects suggests these effects tend to persist for longer than 3 days, sometimes much longer (Coppock Reference Coppock2021, Ch.6; Coppock, Ekins, and Kirby Reference Coppock, Ekins and Kirby2018; Kuziemko et al. Reference Kuziemko, Norton, Saez and Stantcheva2015). This offers additional nuance to scientific understanding of the relative influence of party cues versus policy information on people’s opinion formation (Bullock Reference Bullock2011; Cohen Reference Cohen2003). Specifically, while party cues may exert strong initial influence on a large number of people, this influence may be more short-lived than that exerted by substantive policy information; but the latter plausibly reaches fewer numbers of people in total. Future work can more systematically investigate this notion by estimating the persistence of party cue and policy information effects within the same experiment and on the same policy issues.
Acknowledgments
We are grateful to David Rand for funding this research. We would also like to thank Bert Bakker and three anonymous reviewers for their helpful comments during the review process.
Supplementary Material
To view supplementary material for this article, please visit https://doi.org/10.1017/XPS.2021.22
Data Availability
The data, code, and any additional materials required to replicate all analyses in this article are available at the Journal of Experimental Political Science Dataverse within the Harvard Dataverse Network, at: doi: https://doi.org/10.7910/DVN/WHBRYN.
Conflicts of Interest
We have no conflicts of interest to declare.