INTRODUCTION
One central interest within community ecology has been the resource-use overlap for food, space and time as division along these niche axes has been proposed as an important mechanism to facilitate coexistence (Schoener Reference SCHOENER1974). Time is the niche axis that has received the least attention and thus our knowledge of its role as a mediator of ecological interactions is very incomplete (Halle & Stenseth Reference HALLE and STENSETH2000, Kronfeld-Schor & Dayan Reference KRONFELD-SCHOR and DAYAN2003). Increasing evidence has demonstrated the ecological significance of time use to understand relationships among species in communities at local scales (Kronfeld-Schor & Dayan Reference KRONFELD-SCHOR and DAYAN2003). How animals use time and distribute their activity along the diel cycle is relevant as it determines the form in which species exploit resources in their environment as well as the nature of their interactions (e.g. interference; Norris et al. Reference NORRIS, MICHALSKI and PERES2010, Pianka Reference PIANKA1973).
Theory predicts that high overlap on one niche axis would correspond with low overlap along other niche axes (Schoener Reference SCHOENER1974). Since species most likely to overlap in their use of food and/or space are syntopic species within a clade (i.e. assemblages and ensembles sensu Fauth et al. Reference FAUTH, BERNARDO, CAMARA, RESETARITS, VAN BUSKIRK and MCCOLLUM1996) they represent appropriate focal groups to explore partitioning of time as a resource as has been demonstrated by examples of temporal segregation of rodent species within deserts (Gutman & Dayan Reference GUTMAN and DAYAN2005, Jones et al. Reference JONES, MANDELIK and DAYAN2001, Kotler et al. Reference KOTLER, BROWN and SUBACH1993) and grasslands (Cameron et al. Reference CAMERON, KINCAID and CARNES1979, Glass & Slade Reference GLASS and SLADE1980, Prochaska & Slade Reference PROCHASKA and SLADE1981) as well as in carnivores (Di Bitetti et al. Reference DI BITETTI, DI BLANCO, PEREIRA, PAVIOLO and PEREZ2009, Gerber et al. Reference GERBER, KARPANTY and RANDRIANANTEAINA2012). A shortcoming of previous studies is that their analyses are concentrated on pairwise comparisons of activity and thus findings cannot be directly extrapolated to assemblage-wide patterns, especially involving several species at species-rich sites. In diverse assemblages multiple simultaneous interactions need to be addressed concurrently as all species potentially vie for resources. Null model approaches, in which explicit hypotheses are evaluated in the absence of a mechanism, are capable of identifying patterns for these assemblage-wide questions and represent advancement over traditional statistical tools (Gotelli & Graves Reference GOTELLI and GRAVES1996). With the advent of a suitable algorithm, specific for temporal data (Castro-Arellano et al. Reference CASTRO-ARELLANO, LACHER, WILLIG and RANGEL2010) it is now possible to address these questions on a wide variety of assemblages of both invertebrates (ants, wasps; Aguiar et al. Reference AGUIAR, SANTOS, MARTINS and PRESLEY2012, Brito et al. Reference BRITO, PRESLEY and SANTOS2012) and vertebrates (rodents, Castro-Arellano & Lacher Reference CASTRO-ARELLANO and LACHER2009). Several Neotropical frugivorous bat assemblages (Phyllostomidae) have been analysed with these methods, with most assemblages evincing more overlap in their activities than at random (Arriaga-Flores et al. Reference ARRIAGA-FLORES, CASTRO-ARELLANO, MORENO-VALDEZ and CORREA-SANDOVAL2012, Castro-Arellano et al. Reference CASTRO-ARELLANO, PRESLEY, WILLIG, WUNDERLE and SALDANHA2009, Presley et al. Reference PRESLEY, WILLIG, CASTRO-ARELLANO and WEAVER2009a, Reference PRESLEY, WILLIG, SALDANHA, WUNDERLE and CASTRO-ARELLANO2009b). This suggests the existence of a common constraint for activity patterns of frugivorous bat species. Null model tests of activity overlap of whole ensembles in other bat groups are scarcer as only an ensemble of four syntopic mormoopid bat species from Cuba has been tested (Mancina et al. Reference MANCINA, GARCÍA and MILLER2012). There was substantial temporal segregation between some species pairs in this ensemble sharply contrasting with the activity patterns of phyllostomids. Contrasting bat activity pattern overlap among sites and species combinations will likely aid to get a better insight of time as a mediator of ecological interactions in this keystone group (Jones et al. Reference JONES, JACOBS, KUNZ, WILLIG and RACEY2009).
We sampled nocturnal activity patterns of phytophagous bat species in the Sierra del Rosario Biosphere Reserve. Specifically, we hypothesized that (1) temporal activity patterns will be consistent within each species across seasons and habitats, and (2) ensemble-wide temporal overlap in bats will be greater than expected by chance as found in most studies conducted at Neotropical continental sites for frugivorous bats.
MATERIALS AND METHODS
Study area
Sampling for our study at the Sierra del Rosario Biosphere Reserve (SRBR) consisted of 113 sampling nights distributed from April 1996 to May 2010. This protected area is located in the easternmost portion of Cordillera de Guaniguanico in extreme western Cuba. The tropical evergreen forest is the native vegetation of the region (Herrera et al. Reference HERRERA, MENÉNDEZ, RODRÍGUEZ and GARCÍA1988); however, only small pristine zones or slightly altered forests remain. Road openings, creation of terraces to prevent erosion, and selective logging have been the most significant habitat modifications to these forests. The forest exhibits two strata: a 10–30-m-high tree canopy and a 3–5-m shrub layer. In most sites the vegetation was dominated by tree species typical of primary evergreen forests, such as Pseudolmedia spuria (Sw.) Griseb. (Moraceae), Oxandra lanceolata (Sw.) Baill. (Annonaceae), Matayba opositifolia (A. Rich) Britton (Sapindaceae) and Calophyllum antillanum Britton (Clusiaceae). The climate is characterized by a wet season (May–October) and a dry season (November–April). The mean annual temperature is 24.4 °C and the mean annual rainfall is 2010 mm (Mancina Reference MANCINA2010).
Experimental design
We sampled five sites based on landscape characteristics and logistical constraints. At each site, bats were sampled during the wet and dry seasons with at least five nights per season. For analyses these were grouped in two types of habitat: lowland (190–290 m asl) and highland (over 370 m asl). Besides their difference in altitude, these habitats diverge in structural characteristics. Highland sites have later stages of vegetation succession, higher floristic diversity and were dominated by tree species typical of primary evergreen forests. Lowland sites have a higher proportion of secondary growth, a lower canopy height and more gap openings. All sites were separated by at least 4 km. We knew the location of bat roosts, which consisted of caves, for the studied species at SRBR and all sampled sites were located at least 6 km from those roosts.
We used four to six 9-m or 12-m mist nets with 35-mm mesh set from the ground to a height of 2.5 m and separated by about 30 m. Nets were opened 1 h before sunset, closed 8 h later and checked every 20–30 min. Each individual bat captured was identified and weighed (to the nearest 0.5 g), and sex, hour of capture, and reproductive condition (pregnant, lactating or non-reproductive females and testis size in males, Racey Reference RACEY and Kunz1988) were recorded. All bats were marked with a numbered band on a plastic necklace (Gannon Reference GANNON1993). Handling of the bats followed the guidelines of the American Society of Mammalogists for the field methods involving mammals (Sikes et al. Reference SIKES and GANNON2011). Captures were pooled into 1-h intervals resulting in patterns of activity based on eight 1-h time intervals starting 1 h before sunset and ending 8 h later. As there is seasonal variation in the hour that sunset occurs (approximately 18h00 in winter to 20h00 in summer) tabulations are based on the order of sampling intervals in reference to sunset (Interval 1, 1 h before sunset; Interval 2, 1 h after sunset; Interval 3, 2 h after sunset, etc.), which allows comparison of capture data among seasons and years. We analysed data at 30-min intervals and the analytical outcomes were the same as 1-h intervals. Thus, we report our results at 1-h intervals to make them comparable to previous studies.
Data analysis
Analyses of activity pattern were restricted to the five most abundant phyllostomid bat species present at Sierra del Rosario Biosphere Reserve because of analytical and ecological reasons. This ensemble consisted of two primarily frugivorous species (Artibeus jamaicensis Leach, 1821, body mass = 38 g and Phyllops falcatus (Gray, 1839) 21 g, both subfamily Stenodermatinae), two non-specialized nectarivores (Phyllonycteris poeyi, Gundlach in Peters, 1861, 20 g, subfamily Phyllonycterinae and Brachyphylla nana, Miller, 1902, 35 g, subfamily Brachyphyllinae) that frequently use small fruits as a large part of their diet (Mancina et al. Reference MANCINA, GARCÍA and CAPOTE2007), and a mostly specialized nectarivore (Monophyllus redmani, Leach, 1821, 11 g, subfamily Glossophaginae), which consumes a large number of insects (Mancina & Herrera Reference MANCINA and HERRERA2010). Two other phyllostomids, Erophylla sezekorni (Gundlach in Peters, 1861) (nectarivore, Phyllonycterinae) and Macrotus waterhousei Gray, 1843 (insectivore, Phyllostominae) are present in the reserve, but were rarely captured and thus not included in the study.
We restricted analyses to abundant species not only because of sample size requirements but also to focus analyses on the group of species that are more likely to interact due to their numerical dominance of the assemblage (Fauth et al. Reference FAUTH, BERNARDO, CAMARA, RESETARITS, VAN BUSKIRK and MCCOLLUM1996, Presley et al. Reference PRESLEY, WILLIG, CASTRO-ARELLANO and WEAVER2009a). Also, inherent biases associated with the use of ground-level mist nets in sampling different guilds of bats allow only adequate comparisons within this group of bats (Meyer et al. Reference MEYER, AGUIAR, AGUIRRE, BAUMGARTEN, CLARKE, COSSON, VILLEGAS, FAHR, FARIA, FUREY, HENRY, HODGKISON, JENKINS, JUNG, KINGSTON, KUNZ, MACSWINEY GONZALEZ, MOYA, PATTERSON, PONS, RACEY, REX, SAMPAIO, SOLARI, STONER, VOIGT, VON STADEN, WEISE and KALKO2011, Patterson et al. Reference PATTERSON, PACHECO and SOLARI1996). The group of analysed species conform to a phytophagous ensemble (sensu Fauth et al. Reference FAUTH, BERNARDO, CAMARA, RESETARITS, VAN BUSKIRK and MCCOLLUM1996). We kept M. redmani in most of the analyses as it is a numerically important part of the assemblage (second-most abundant species) and its food habits partly overlap with the rest of the species at the site (Mancina et al. Reference MANCINA, GARCÍA and CAPOTE2007, Silva Reference SILVA1979). However, ensemble-wide temporal overlap analyses were done both with all abundant bat species and excluding M. redmani in order to assess any potential biases of adding this species.
The activity pattern for each species was quantified by the proportion of total captures of that species in each of eight night-time intervals. We assumed that all captures were independent (Bruseo & Barry Reference BRUSEO and BARRY1995). Use of the night by each species was tested using a goodness-of-fit test against a homogeneous expectation of activity using SPSS (SPSS for Windows version 20.0, SPSS Inc., Chicago, IL, USA). Activity patterns within each species are assumed to be an overall representation of the species’ use of time. To assess the validity of this intraspecific homogeneity of activity we compared activity patterns between habitats, between seasons, between males and females, as well as between reproductive and non-reproductive females for all species whenever sample sizes allowed statistical comparison. We also assessed temporal overlap among each possible pair of species at each habitat. All pairwise differences in temporal activity patterns within and between species were evaluated with a Monte Carlo Kolmogorov–Smirnov two-sample test (MC K-S; Siegel & Castellan Reference SIEGEL and CASTELLAN1995). We performed all MC K-S tests with StatXact (StatXcat for Windows version 9.0, Cytel Inc., Cambridge, MA, USA). We estimated the exact P-value using the Monte Carlo analysis based on 10000 random permutations of the original data. Also, Czechanowski index (Feisinger et al. Reference FEISINGER, SPEARS and POOLE1981) provided an estimate of pairwise temporal niche overlaps.
For all analyses significance is considered where P ≤ 0.05. Exact P-values are shown and we did not implement a correction when multiple tests are performed. Methods used to maintain Type I error rates at a certain α-level for a group of analyses are controversial in ecology (Hulbert & Lombardi Reference HULBERT and LOMBARDI2003, Moran Reference MORAN2003). These methods can raise Type II error rates to a point that they could exceed Type I error rates without correcting for multiple tests (i.e. they are extremely conservative). In general, corrections for multiple tests are not advised when it comes to the kind of exploratory analyses carried herein (Roback & Askins Reference ROBACK and ASKINS2005).
Null-model simulations
Monte Carlo simulations were the basis for evaluating assemblage-wide temporal niche overlap using different combinations of habitat (lowland vs highland), season (dry vs wet) and species (all species vs excluding M. redmani). The basis for analysis consisted of a species-by-time interval matrix that was populated with number of captures (i.e. measure of activity) for each species at each 1-h interval. Amount of overlap is estimated as the average of all pairwise overlaps calculated via the Czechanowski index (Feisinger et al. Reference FEISINGER, SPEARS and POOLE1981). This empirical index is compared against the null distributions of overlaps generated by the simulation algorithm. Temporal segregation (i.e. less overlap than expected by chance) is indicated by significantly smaller overlap than random assemblages, and temporal coincidence (i.e. more overlap than expected by chance) is designated by significantly larger overlap when contrasted against those simulated assemblages.
Analysis of temporal overlap via null models requires the use of a specific algorithm for time, which is an ordered form of resource (Gotelli & Graves Reference GOTELLI and GRAVES1996). Traditional models used for niche overlap like randomization algorithm 3 (RA3) and randomization algorithm 4 (RA4, Winemiller & Pianka Reference WINEMILLER and PIANKA1990) were designed for nominal unordered resources (e.g. categories of prey or microhabitat) and as such are inadequate for time. Both RA3 and RA4 reshuffle the values of each time interval within each species and thus destroy the shape of activity patterns, eliminate empirical temporal autocorrelation, and create large null spaces that include biologically unrealistic activity patterns (Castro-Arellano & Lacher Reference CASTRO-ARELLANO and LACHER2009). To solve this, we used a new algorithm, termed Rosario, designed specifically for temporal data (Castro-Arellano et al. Reference CASTRO-ARELLANO, LACHER, WILLIG and RANGEL2010). Rosario maintains the empirical structure of the data while creating the simulated scenarios in each iteration. Rosario not only maintains temporal autocorrelation of temporal data but also creates a more biologically meaningful null space and it is less prone to Type I errors. Simulations using Rosario were conducted with the Time Overlap program. This program is freely available at the following websites: http://ivancastroarellano.wp.txstate.edu/analysis_temporal_niche/ and http://hydrodictyon.eeb.uconn.edu/people/willig/Research/activity%20pattern.html.
RESULTS
Assemblage structure and species activity patterns
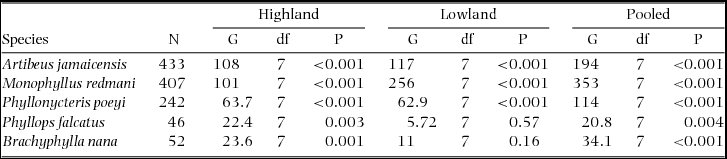
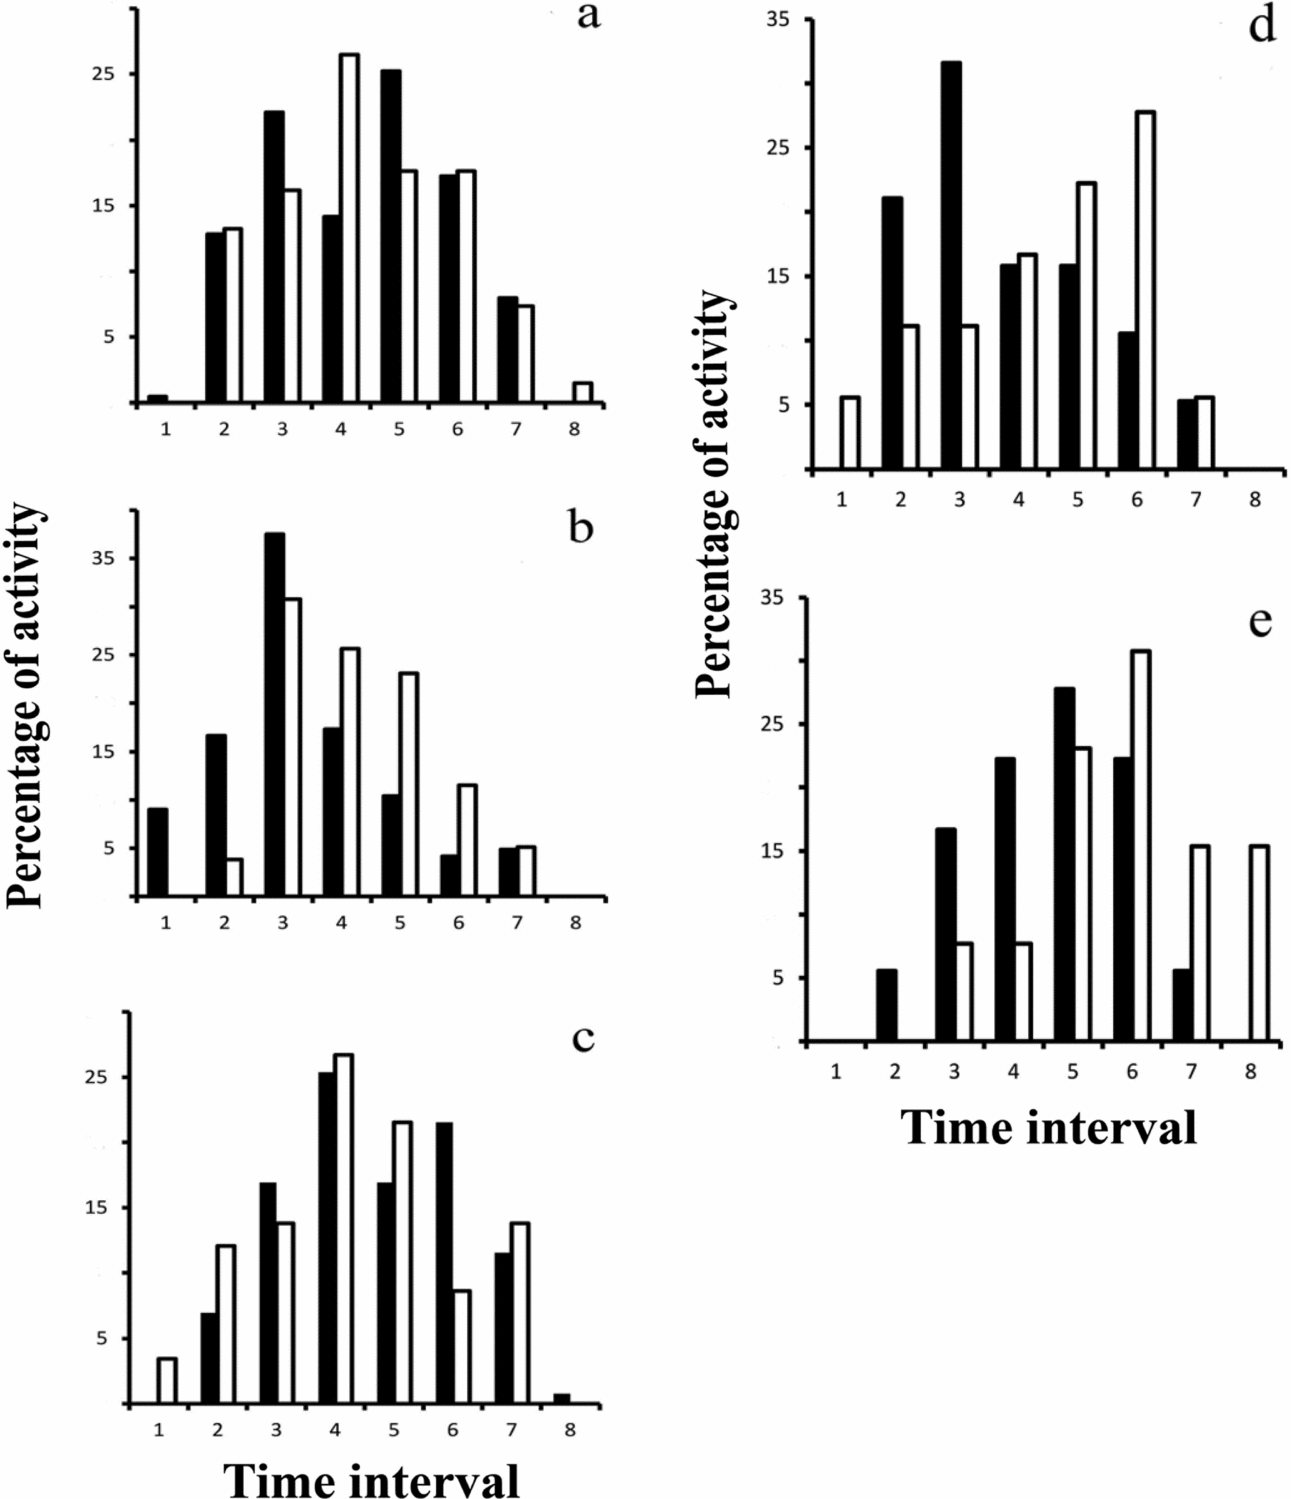
We recorded the same species in each habitat (lowland vs highland) except for Erophylla sezekorni, which was only captured in the lowland habitat. Because only two individuals of this species were captured Erophylla were excluded from analyses. There were no significant differences between habitats in the number of captured individuals for P. poeyi (χ2 = 0.52, df = 1, P = 0.46) but significantly more M. redmani were captured in lowland habitat (χ2 = 55.9, df = 1, P = 0.0001), whereas A. jamaicensis (χ2 = 18.7, df = 1, P = 0.0001), P. falcatus (χ2 = 5.64, df = 1, P = 0.01), and B. nana (χ2 = 12.3, df = 1, P = 0.0005) were recorded significantly more often in the highland habitat. Most species showed a heterogeneous use of the night for both habitats and also when data were pooled for lowland and highland sites (Table 1, Figure 1). The only exceptions were P. falcatus and B. nana at the lowland habitat as the activity for these species at these sites did not differ from an expectation of homogeneous use of all intervals. Likely this result is due to the low number of captures of these species in this habitat. Also, most species evinced activity peaks 4–5 h after sunset, with the exception of M. redmani which had the most activity 3 h after sunset (Figure 1).
Comparison of activity patterns for common bat species at sampled habitats from Sierra del Rosario Biosphere Reserve, Cuba, against an expectation based on homogeneous use of the night using a goodness-of-fit test. Species-specific activity patterns are tested for each habitat and pooling all data.

Intraspecific comparison of activity patterns for common bat species from Sierra del Rosario Biosphere Reserve, Cuba, between highland (black bars) and lowland (white bars) habitats using 10000 Monte Carlo permutations of Kolmogorov–Smirnov two sample test. Species-specific activity patterns were tested pooling all the data from wet and dry seasons: Artibeus jamaicensis, Z = 0.145, P < 0.0041 (a); Monophyllus redmani, Z = 0.049, P = 0.72 (b); Phyllonycteris poeyi, Z = 0.114, P = 0.142 (c); Phyllops falcatus, Z = 0.218, P = 0.41 (d); and Brachyphylla nana, Z = 0.051, P = 0.99 (e). Time intervals correspond to the order of sampling intervals in reference to sunset (Interval 1, 1 h before sunset; Interval 2, 1 h after sunset; Interval 3, 2 h after sunset, etc.). Sample sizes as in Table 2.

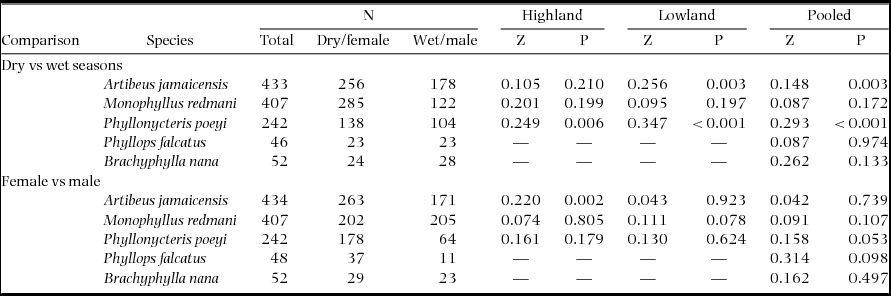
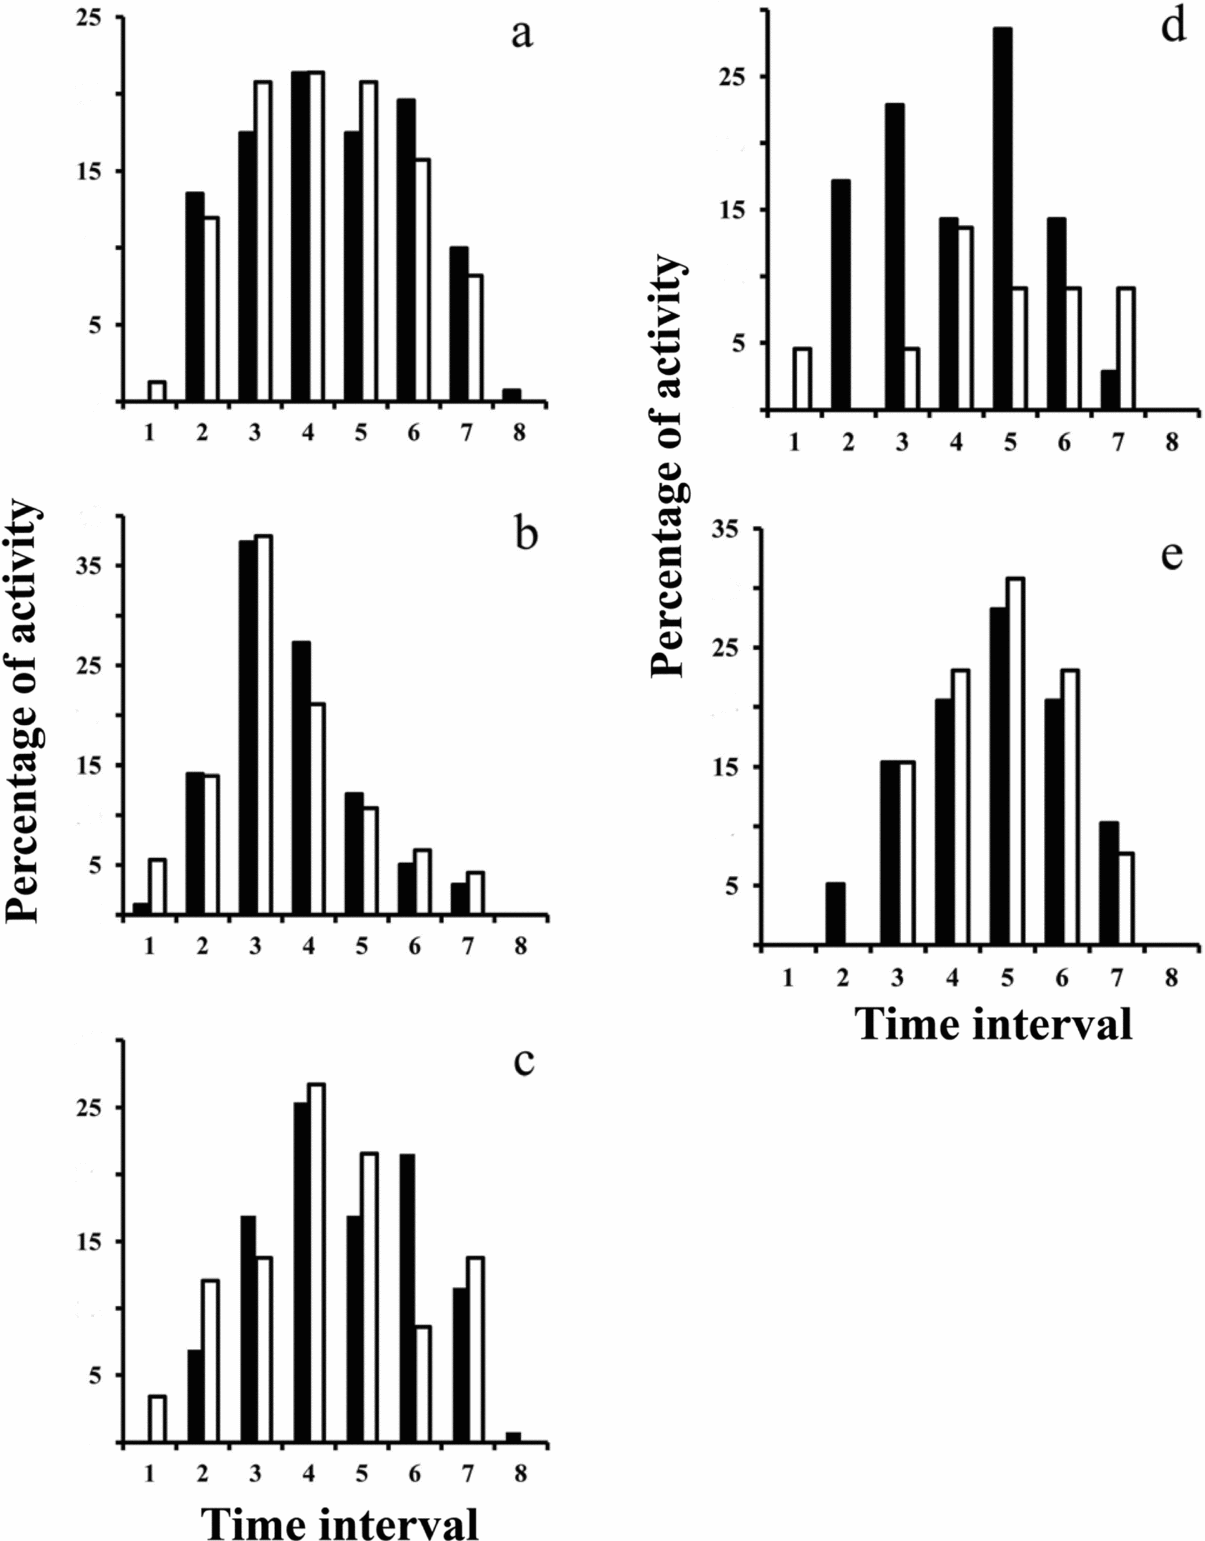
In general, activity tended to be consistent among habitats, seasons and sexes but some exceptions were present. When compared across habitats, activity was homogeneous for all species, except for A. jamaicensis (Figure 1). For most bat species activity patterns were consistent between seasons (dry vs wet) for both habitats (highland vs lowland) and while considering pooled data for the two habitats (Table 2). The two exceptions were P. poeyi which showed differences among seasons for each habitat, and with pooled data, and A. jamaicensis that had different activity patterns between seasons at the lowland habitat and with pooled data (Table 2). Even more consistent were the activity patterns of both sexes across habitats for both seasons. The single exception was for A. jamaicensis, as males and females had different activity patterns in the highland habitat (Table 2). Finally, when reproductive and non-reproductive females were contrasted, the only differences were for M. redmani and P. poeyi (Figure 2). In M. redmani non-reproductive females were more active in the first 3 h after sunset as compared with the bulk of activity of reproductive females that occurred later in the night (3–5 h after sunset). In contrast, reproductive females of P. poeyi had most of their activity in the first 4 h after sunset but non-reproductive females were more active 3–6 h after sunset (Figure 2).
Intraspecific comparison of activity patterns for common bat species at each sampled habitat from Sierra del Rosario Biosphere Reserve, Cuba, between the wet and dry seasons and between males and females using 10000 Monte Carlo permutations of Kolmogorov–Smirnov two-sample test. A dash indicates insufficient sample size to complete analysis. Species-specific activity patterns are tested for each habitat and pooling all data.
Intraspecific comparison of activity patterns for common bat species at highland and lowland habitats from Sierra del Rosario Biosphere Reserve, Cuba, between reproductive (lactating and gestating; white bars) and non-reproductive females (black bars) using 10000 Monte Carlo permutations of Kolmogorov–Smirnov two sample test. Species-specific activity patterns were tested pooling all the data from both habitats sampled: Artibeus jamaicensis, Z = 0.063, P = 0.712 (a); Monophyllus redmani, Z = 0.286, P < 0.0001 (b); Phyllonycteris poeyi, Z = 0.254, P = 0.0016 (c); Phyllops falcatus, Z = 0.335, P = 0.248 (d); and Brachyphylla nana, Z = 0.337, P = 0.127 (e). Time intervals correspond to the order of sampling intervals in reference to sunset (Interval 1, 1 h before sunset; Interval 2, 1 h after sunset; Interval 3, 2 h after sunset, etc.). Sample sizes as in Table 2.
Interspecific temporal overlap and assemblage-wide temporal overlap
In general bat species tended to be active at the same time intervals as demonstrated from their high values of pairwise temporal niche overlap among species (0.615–0.939, Table 3). The activities for most bat species were indistinguishable from the rest of the species with the notable exception of M. redmani as this species had a distinct activity pattern from the rest of the bat assemblage (Table 3). This trend for the lack of differences among species and the distinct activity pattern of M. redmani was true whether analyses were conducted for the two habitats combined (Table 3) or for each habitat separately (Table 4).
Pairwise interspecific comparisons of activity patterns among common bats at sampled habitats from the Sierra del Rosario Biosphere Reserve, Cuba. Values above the diagonal correspond to Monte Carlo P values after 10000 permutations of Kolmogorov–Smirnov two-sample tests. Values under the diagonal correspond to pairwise observed niche overlap measured with Czekanowski index. Sample sizes as in Table 1.

Pairwise interspecific comparisons of activity patterns among common bats at the Sierra del Rosario Biosphere Reserve, Cuba. Results represent Monte Carlo P values after 10000 permutations of Kolmogorov–Smirnov two-sample tests. P values above the diagonal correspond to results from highland habitat and below the diagonal correspond to lowland habitat. A dash indicates insufficient sample size to complete analysis. Brachyphylla nana was not included for the lowland habitat comparisons due to small number of captures at this habitat. Sample sizes in parentheses correspond to sample size from highland (bottom row) and lowland (rightmost column) habitats.

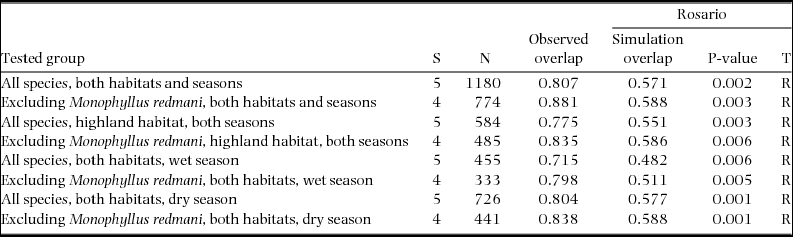
Ensemble-wide activity overlap was highly consistent across habitats, seasons, and whether it included M. redmani or not. For all cases, there was a larger assemblage-wide temporal overlap against a random expectation (Table 5). Also, the assemblage-wide temporal overlap was consistently greater when M. redmani was not included in the analysis, thus confirming that the activity of this species is distinct from the rest of the species across habitats and seasons as mentioned above.
Results of null model analyses of temporal niche overlap (Rosario algorithm) in the phytophagous bat ensemble from Sierra del Rosario Biosphere Reserve, Cuba, using Czekanowski overlap index. Overlap was evaluated using different combinations of habitat, season and species. P values are two-tailed probabilities of finding non-random assemblage-wide temporal niche overlap. Tail (T) indicates if empirical overlap occurs in the left-hand (L) or right-hand (R) of the simulated distribution. Values in extreme left indicated segregated activities and in the extreme right coincident activity patterns. N, number of individuals and S, number of species in the analyses. All significant results in bold.
DISCUSSION
Ecologists have recently realized the potential importance of time for ecological interactions. A common inquiry has been whether observed activity patterns at a given site are idiosyncratic manifestations specific for that ecological situation or whether these are maintained elsewhere. Activity patterns have strong phylogenetic constraints (Kronfeld-Schor & Dayan Reference KRONFELD-SCHOR and DAYAN2003) that determine the hours a species is active but these patterns can change due to environmental or biological interactions (Kronfeld-Schor et al. Reference KRONFELD-SCHOR, DAYAN, ELVERT, HAIM, ZISAPEL and HELDMAIER2001). Thus, detailed comparisons of activity patterns for related taxa in different environmental settings can provide some insight on the role of time as mediator of ecological interactions. Even though keystone taxa like bats (Jones et al. Reference JONES, JACOBS, KUNZ, WILLIG and RACEY2009) have been heavily studied it is not until recently that their activity patterns are getting more attention. Most bat ensembles analysed at the whole-ensemble level have been on Neotropical frugivores (Phyllostomidae), and to our knowledge our study is the first to address a whole phytophagous bat ensemble at an insular site. Neotropical frugivorous bat assemblages have mostly revealed more temporal overlap than expected by chance alone (Castro-Arellano et al. Reference CASTRO-ARELLANO, PRESLEY, WILLIG, WUNDERLE and SALDANHA2009, Presley et al. Reference PRESLEY, WILLIG, CASTRO-ARELLANO and WEAVER2009a, Reference PRESLEY, WILLIG, SALDANHA, WUNDERLE and CASTRO-ARELLANO2009b). At these sites there appear to be common constraints across different frugivore species that shape bat activity periods to be similar. Implied in this pattern is the notion that bat species do not need to segregate along the temporal niche axis to allow coexistence, as in some carnivore (Gerber et al. Reference GERBER, KARPANTY and RANDRIANANTEAINA2012) and rodent assemblages (Castro-Arellano & Lacher Reference CASTRO-ARELLANO and LACHER2009). Similarly, the phytophagous bat ensemble at SRBR shows a consistently high ensemble-wide temporal overlap across habitats and seasons. This trend is even stronger when the most specialized nectarivore, M. redmani, is removed from the analysis. So, at SRBR the mostly frugivorous bat ensemble also experiences common constraints for their activities as in Neotropical mainland sites. However, at SBRB bat activity peaks 4–5 h after sunset for the mostly frugivore species and 3 h after sunset for M. redmani. In sharp contrast, at undisturbed Neotropical mainland sites activity peaks of frugivore species occur within the first hour or two after sunset (Aguiar & Marinho-Filho Reference AGUIAR and MARINHO-FILHO2004, Castro-Arellano et al. Reference CASTRO-ARELLANO, PRESLEY, WILLIG, WUNDERLE and SALDANHA2009, LaVal Reference LAVAL1970, Marinho-Filho & Sazima Reference MARINHO-FILHO and SAZIMA1989, Presley et al. Reference PRESLEY, WILLIG, CASTRO-ARELLANO and WEAVER2009a, Reference PRESLEY, WILLIG, SALDANHA, WUNDERLE and CASTRO-ARELLANO2009b). An argument can be made that Antillean endemic species (P. poeyi, P. falcatus and B. nana) have different activity patterns as they are phylogenetically distinct from Neotropical mainland frugivore bat species (Dávalos Reference DÁVALOS2004) but A. jamaicensis has a midnight activity peak at SRBR against an early night activity peak at mainland sites (Bernard Reference BERNARD2002, Castro-Arellano et al. Reference CASTRO-ARELLANO, PRESLEY, WILLIG, WUNDERLE and SALDANHA2009, Ortega & Castro-Arellano Reference ORTEGA and CASTRO-ARELLANO2001). The mechanistic explanation for this striking difference between continental and insular sites is likely key to understanding both the assemblage-wide temporal overlap patterns and geographic variation in diel rythms of individual frugivore bat species. Several hypotheses can be put forward to explain this collective variation in activity peaks and these are related to energetic constraints, competition, type of day roost used and spatial arrangement of roosts and sampling nets.
The early activity peak of Neotropical phyllostomid frugivores has been tied to energetic constraints (Castro-Arellano et al. Reference CASTRO-ARELLANO, PRESLEY, WILLIG, WUNDERLE and SALDANHA2009, Charles-Dominique Reference CHARLES-DOMINIQUE, Estrada and Fleming1986). Frugivorous and nectarivorous bats use resources that often occur in a sparse and scattered fashion and use flight, an energetically demanding mode of locomotion, to move among resource patches. Net energetic gain for foraging on these scattered resources is likely small and thus energy turnover in bats can be exceptionally high. Since fruit contains little nutritive value, frugivorous bats need to consume large amounts of fruit pulp. For example, Carollia and Artibeus species need to consume 120% and 200% of their body mass in fruit pulp each night (Charles-Dominique Reference CHARLES-DOMINIQUE, Estrada and Fleming1986). Presumably if individual bats do not start their activities early in the night they might not be able to meet these demanding daily energetic requirements (Charles-Dominique Reference CHARLES-DOMINIQUE, Estrada and Fleming1986, Presley et al. Reference PRESLEY, WILLIG, CASTRO-ARELLANO and WEAVER2009a). However, bat activity patterns at SRBR strongly depart from the expectations of this hypothesis as bat activities do not peak until the middle of the night. The reasons behind this middle-night peak are unknown but this pattern challenges an energetic constraint hypothesis. Even more, if energetic constraints were the main driver of bat activity patterns, a stronger effect would be expected for reproductive females that would need to forage earlier in the night. Our data do not show a uniform response in this regard: in one species, M. redmani, reproductive females do have earlier activities against non-reproductive females, but another species, P. poeyi, shows the opposite pattern. It is unlikely that bat species at SRBR have lower energetic demands (but see McNab Reference MCNAB2002), or that food resources at this insular site have a higher energetic content as compared with continental sites. Nevertheless, experimental tests are needed to confirm or refute this hypothesis.
Another potential explanation for the variation of activity peaks between insular and continental sites might be related to intra- or interspecific competition. Mainland sites have more diverse frugivorous faunas (bats, terrestrial mammals, birds, etc.) that compete for these resources. In contrast, at SRBR intraspecific competition might be stronger as bat species show density compensation, as in the case of A. jamaicensis, which can be 13–40 times more abundant than in mainland sites (Mancina et al. Reference MANCINA, GARCÍA and CAPOTE2007). Whether density-compensation is insufficient to compensate for missing mainland species and creates a rarified competitive environment represents a plausible hypothesis for the variation in activity peaks.
Compared with continental species, a higher proportion of Antillean bat species use caves as their day roost. In Cuba, five of the six phyllostomid phytophagous species use caves as diurnal refugia (and four of them depend exclusively on this resource). Instead, the majority of continental species are tree-dwelling species (Rodríguez-Durán Reference RODRÍGUEZ-DURÁN, Fleming and Racey2009). Also, in Cuba most of the caves that have populations of phyllostomids are shared with large colonies of mormopid bats. Since the size of a cave opening can represent a limiting factor for the number of individuals that can emerge per unit time (Silva Reference SILVA1979), the activity patterns of Antillean phytophagous phyllostomids could represent a form of temporal segregation that can allow these bat species to share this refuge with the insectivorous bats, which have earlier activities (Mancina et al. Reference MANCINA, GARCÍA and MILLER2012). This refuge-dependent hypothesis is supported by the observation that the activity patterns observed at SRBR coincide with the emergence patterns of bats from day refugia recorded from other sites in Cuba (Silva Reference SILVA1979). Interestingly, M. redmani is the first to abandon the day roost and its activity overlaps with mormopid bats. Likely, the elevated proportion of use of insects in the diet of this species (Mancina & Herrera Reference MANCINA and HERRERA2010) requires an activity time that coincides with peaks of insect activity earlier in the night.
Other potential explanations for the apparent differences in bat activity peaks between continental and Antillean sites involve bat foraging movement patterns and the use of mist nets to record bat activity. Assessments of bat activity patterns with mist nets might be influenced by spatial relationship between resources (day roosts and food) and locations of mist-netting sites and thus reflect the distance travelled during each night interval instead of activity per se. Using radio-telemetry the number of foraging flights of Carollia perspicillata did not show a strong reduction throughout the night from an initially slightly higher activity and the percentage of time flying was more or less uniform during the night (Charles-Dominique Reference CHARLES-DOMINIQUE1991). Thus, activity throughout the night might be constant but mist nets will only account for part of this activity. Bats might travel longer distances at the start of the night in search of a resource patch and then maintain activity within that patch the rest of the night. Individuals would have a higher likelihood of being captured while travelling to a food source and also would be less likely to be detected by mist nets if they do not move far from a food patch. If true, this could not only explain the skewed distribution of captures but also the predawn peak in captures of bats as they travel to return to day roosts (Marinho-Filho & Sazima Reference MARINHO-FILHO and SAZIMA1989). Even more, the location of mist-netting sites, food patches and roost sites is likely to have influence on the distribution of captures along the night as can be derived from the midnight peak of activity recorded for frugivores with mist nets located at a riparian corridor of a site in north-eastern Mexico (Arriaga-Flores et al. Reference ARRIAGA-FLORES, CASTRO-ARELLANO, MORENO-VALDEZ and CORREA-SANDOVAL2012). One important observation is that known cave colonies at SRBR are not far away from our mist-netting sites. So, midnight peaks unlikely represent the time it takes for the bats to reach these sites flying from their day roosts.
The possibility that midnight peaks of activity we detected at SRBR might be related to the spatial relationship among bat roosts, food patches and mist-netting sites warrants further exploration. Establishing the exact mechanism of this relationship is not a merely theoretical question but an endeavour tied to the conservation and management of tropical areas. Anthropogenic effects at landscape level such as habitat conversion and fragmentation can have implications for the behaviour and conservation of bats (Presley et al. Reference PRESLEY, WILLIG, CASTRO-ARELLANO and WEAVER2009a) and land mammals (Norris et al. Reference NORRIS, MICHALSKI and PERES2010), making the mentioned hypotheses a priority to be addressed to aid our knowledge and management of these diverse ecosystems.
ACKNOWLEDGEMENTS
We extend our gratitude to the staff of the Sierra del Rosario Ecological Station for help with logistics in this study. For help in the field, we thank Lainet García and Jorge L. Guerra. For a careful review and insightful comments of the manuscript we thank Bruce Patterson. The work of CAM was partially financed by Rufford Small Grants and ICA received salary support from Texas State University. Guidelines of the American Society of Mammalogists for the care and use of mammals were followed (Sikes et al. Reference SIKES and GANNON2011). This study was conducted under permit 9/200 from Ministerio de Ciencia, Tecnología y MedioAmbiente, Cuba.