I. INTRODUCTION
Mechanical properties of micrometer-sized, single crystalline copper bending beams are strongly influenced by the arrangement of geometrically necessary dislocations (GNDs) leading to two main phenomena inherent to the bending geometry: (i) size effects of the flow stress Reference Motz, Schöberl and Pippan1,Reference Gong and Wilkinson2 and (ii) a pronounced Bauschinger effect or nonlinear elastic unloading behavior. Reference Demir, Raabe and Roters3–Reference Kirchlechner, Grosinger, Kapp, Imrich, Micha, Ulrich, Keckes, Dehm and Motz5
Size effects and the importance of internal material length scales are well known and have been widely discussed Reference Kraft, Gruber, Mönig and Weygand6,Reference Greer and De Hosson7 and investigated over several decades. Studies have also been performed for geometries with inherent strain gradients. Reference Fleck, Muller, Ashby and Hutchinson8 For instance, Stölken and Evans Reference Stölken and Evans9 performed the first foil bending of 12.5–50 µm thick Ni foils to study the influence of length scales on the mechanical behavior, which had been found to be in the range of 3–5 µm in pure Ni foils. The flow stress increase with reduced foil thickness was well explained by strain gradient plasticity. Reference Fleck, Muller, Ashby and Hutchinson8 Recently, the possibility to produce micrometer- and submicrometer-sized samples by focused ion beam (FIB) milling and to test them either ex situ or in situ allows for sample size effects in a broad context down to the submicrometer range to be studied. These types of experiments have been commonly performed over the last decade in micro torsion, Reference Fleck, Muller, Ashby and Hutchinson8,Reference Bushby and Dunstan10 micro compression, Reference Uchic, Dimiduk, Florando and Nix11,Reference Volkert and Lilleodden12 micro tensile, Reference Kiener, Grosinger, Dehm and Pippan13,Reference Kim, Jong and Greer14 and micro bending Reference Motz, Schöberl and Pippan1,Reference Gong and Wilkinson2 geometries. Motz et al. Reference Motz, Schöberl and Pippan1 were the first who applied micro bending onto single crystalline, FIB milled bending cantilevers and observed that the increase of flow stress cannot solely be explained by strain gradient plasticity and assumed that this could be due to sparsely distributed dislocation sources and the formation of dislocation pile-ups. Later, three-dimensional discrete dislocation dynamics (3D-DDD) simulations Reference Motz, Weygand, Senger and Gumbsch15 support this view and provide evidence that the dislocation arrangement in micrometer-sized copper cantilevers is characterized by a pile-up of GNDs on distinct glide planes close to the neutral axis. The strong localization of GNDs in the pile-up thereby stems from the activation of single dislocation sources in the small sample volume. The long range stress field of the pile-up and its back stress on the dislocation source is responsible for the pronounced flow stress increase.
Another consequence of the pile-up stress in microcantilevers is a pronounced nonlinear unloading curve due to the Bauschinger effect (or springback during monotone unloading), which was macroscopically observed in the 18th century. Reference Suresh16 Until today, Bauschinger effects had widely been studied in pure and dispersion hardened copper, Reference Pedersen, Brown and Stobbs17 in nanocrystalline gold films Reference Rajagopalan, Rentenberger, Peter Karnthaler, Dehm and Saif18 as well as in passivated and unpassivated copper thin films. Reference Xiang and Vlassak19 Demir and Raabe recently Reference Demir, Raabe and Roters3 described this phenomenon in single crystalline FIB milled micro cantilevers as a drop in the flow stress and a smooth elastic-plastic transition when the load sign is reversed. They also recognized an incomplete reversibility of the GND structure close to the sample surface by electron backscatter diffraction (EBSD). More recent µLaue experiments in single slip oriented copper samples Reference Kirchlechner, Grosinger, Kapp, Imrich, Micha, Ulrich, Keckes, Dehm and Motz5 showed that the reversible back-flow of GNDs already takes place during unloading. Other data published in the literature Reference Motz, Schöberl and Pippan1,Reference Kirchlechner, Grosinger, Kapp, Imrich, Micha, Ulrich, Keckes, Dehm and Motz5,Reference Gong and Wilkinson20,Reference Raabe, Ma and Roters21 show pronounced deviations from the elastic unloading behavior in micrometer-sized bending beams, which can be associated to a dislocation pile-up in most cases.
In this study, we aim for a better understanding of the effect of different dislocation arrangements on the mechanical behavior of microcantilevers. Based on the FIB milled microcantilevers with different sample geometries we either foster or prohibit the plastic back-flow by confining the dislocation pile-up.
II. EXPERIMENTAL DETAILS
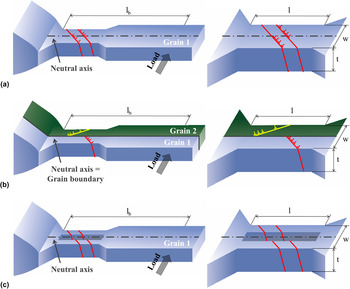
In situ micro bending tests with multiple monotone loading–unloading sequences on single crystalline and bicrystalline copper microcantilevers in three different geometrical designs [Figs. 1(a)–1(c)] have been performed. In single crystalline bending beams [Type 1; Fig. 1(a)] the neutral axis acts as a “strain”-interface for dislocation motion due to the change in sign of the resolved shear stress across the neutral axis. Hence, the majority of dislocations will be trapped, but a few dislocations might be able to penetrate the neutral axis, spreading in regions with reversed load sign, clearly shown by 3D-DDD simulations. Reference Motz, Weygand, Senger and Gumbsch15 However, dislocations emitted from the same source will pile up leading to a back stress on the dislocation source. This long range stress field of the pile-up is responsible for hardening at low strains as described by Motz and co-workers Reference Motz, Schöberl and Pippan1 and a dissolution of the pile-up upon unloading Reference Kirchlechner, Grosinger, Kapp, Imrich, Micha, Ulrich, Keckes, Dehm and Motz5 which results in a pronounced Bauschinger effect furthermore. In the case of bicrystalline bending beams (Type 2 samples) with a grain boundary at the position of the neutral plane, the confinement of the pile-up should be much more pronounced: dislocations are not able to penetrate the general grain boundary leading to a shorter pile-up length, to a higher back stress on the dislocation source, and to a more pronounced Bauschinger effect [Fig. 1(b)]. In contrast, removing the material close to the neutral axis (i.e., milling a slit in the bending sample, Type 3) should lead to an escape of dislocations at the slit [Fig. 1(c)] and thus, no, or depending on the sample geometry a weak, pile-up will be formed and no Bauschinger effect should occur.
(a) Schematic drawing of the dislocation structure in single crystalline cantilever Type 1 with a pile-up formed at the neutral axis; (b) bicrystalline cantilever with a grain boundary aligned along the neutral axis (geometrically restricted pile-up, Type 2); (c) single crystalline cantilever with a slit along the neutral axis (no pile-up, Type 3).

The three different cantilever types were FIB milled using a macroscopic sized copper bicrystal, which was prepared following the approach of Moser et al.
Reference Moser, Felber, Rashkova, Imrich, Kirchlechner, Grosinger, Motz, Dehm and Kiener22
The single crystalline cantilever as well as the slit sample was milled with the
 $\left[ {3\overline 6 1} \right]$
crystallographic axis parallel to the cantilever axis and the
 $\left[ {\bar 8\bar 41} \right]$
crystallographic direction parallel to the loading axis. The second grain in the bicrystalline cantilever is rotated by 24° around the
 $\left[ {314} \right]$
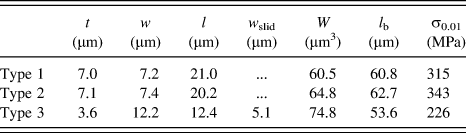
crystallographic direction of the single crystalline cantilever. The microcantilevers were manufactured using a ZEISS 1540 XB FIB workstation (Oberkochen, Germany) with 30 keV Ga+ ions and a coarse milling current of 10 nA, followed by a final polishing current of 500 pA. The dimensions of all cantilevers are summarized in Table I.
Sample dimensions (thickness t, width w, length l, slit width w slid) and section modulus W of sample Types 1, 2, 3 are given as well as the bending length, l b, and the measured surface stresses at a surface strain of 0.01.

A Hysitron PicoIndenter PI 85 (Hysitron, Minneapolis, MN) with a nominal force resolution of 0.1 µN equipped with a doped diamond Berkovich indenter tip was used for the bending experiments. To facilitate the accurate alignment between the micrometer-sized samples and the indenter tip, the experiments were conducted inside a scanning electron microscope (SEM). Prior to the experiment, indents have been performed on a FIB milled surface on the same macroscopic sample close to the bending cantilever. These indents were made to correct for the stiffness of the wedge-shaped macroscopic sample. Several loading and unloading steps were performed in displacement controlled mode with step sizes of 50, 150, and 500 nm, using a strain rate of 10−4–10−5 s−1. Bending lengths, l b, [Figs. 1(a)–1(c)] of roughly 60 µm were realized to avoid unwanted shear forces. The calculation of the stress versus strain curves is based on linear elastic bending beam theory. Therefore, the maximum stress at the outer fiber, σ, was calculated using Eq. (1), with F being the measured force and W or W slit being the section modulus for cantilever Types 1 and 2 or Type 3, respectively, according to Eqs. (2a) and (2b), whereas cantilever thickness, t, and cantilever width, w, are listed in Table I.
 $$\sigma = {{F{l_{\rm{b}}}} \over W}\quad ,$$
 $$W = {{t{w^2}} \over 6}\quad ,$$
 $${W_{{\rm{slit}}}} = {{t\left( {{w^2} - {{\mathop {{w_{{\rm{slid}}}}}\nolimits^3 } \over w}} \right)} \over 6}\quad .$$
SEM images of the bent cantilevers taken after the experiments should document changes in the surface morphology with the main focus lying on resolving the slip step formation. Due to the limited sensitivity concerning surface topography, provided by the SEM, slip steps became only visible at strains above 0.03–0.07.
III. RESULTS
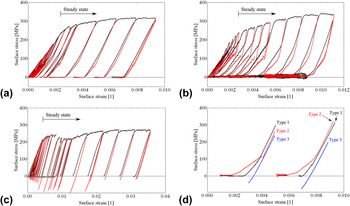
The first 21 loading steps of cantilever Type 1 are shown in the stress versus strain diagram in Fig. 2(a). The loading curve (black) of the single crystal agrees well with the results obtained by Motz and co-workers. Reference Motz, Schöberl and Pippan1 At very low surface strains, the flow stress is increasing tremendously, indicating the aforementioned formation of the pile-up structure. The curve is subsequently followed by a steady state region exhibiting moderate hardening.
(a) Stress versus strain curves of cantilever Type 1 exhibit nonideal elastic unloading behavior, with the amount of reverse strain getting weaker with ongoing deformation steps. (b) Cantilever Type 2 shows amplified reverse strain and serrated flow during unloading, whereas (c) ideal elastic unloading is achieved for cantilever Type 3. (a–c) Loading curves are plotted in black, unloading curves in red. (d) Comparison of the unloading behavior of the three cantilever types at low and high strain values—set of curves left and right, respectively. The compliance of wedge and sample holder was corrected for each curve.
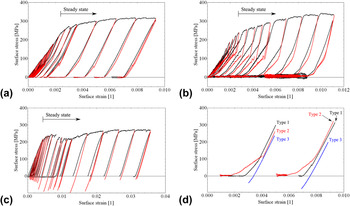
A discontinuous unloading behavior is observed: each unloading step starts with a linear elastic unloading and is followed by a less steep slope (Bauschinger effect). During reloading, the curve predominantly follows the unloading curve, however, slightly shifted to higher stress values meaning at low applied stresses there is no purely elastic loading. With increasing total strain, the Bauschinger effect during unloading is significantly decreasing.
The bicrystalline cantilever [Type 2, Fig. 2(b)] exhibits the same initial hardening and comparable stress during the transition to the steady state region with respect to Type 1. However, large differences can be found by a close examination of the unloading curve, where the elastic unloading portion is much smaller and the reverse strain is increased with respect to the single crystal. Also, the back-flow during unloading is serrated at low total strains [Fig. 2(b)]. With higher surface strain, the back-flow becomes smoother and its magnitude is clearly reduced.
In the case of the slit sample [Type 3, Fig. 2(c)], the transition from the initial region exhibiting very high hardening to the steady state is at slightly higher strains but at comparable stresses. The unloading curve is linear elastic and does not show any kink. The shape of the different unloading slopes is presented in Fig. 2(d) for comparison.
Besides the shape of the loading curves, the maximum stresses also differ. Comparing the stresses at 0.01 surface strain an intermediate strength for the single crystal of 315 MPa, an increased strength of 343 MPa for the bicrystal, and a reduced strength of 226 MPa for the sample with the slit are observed.
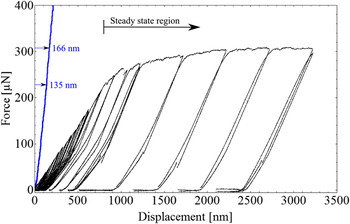
Due to the experimental setup the stress versus strain and hence, force versus displacement curve (Fig. 3, black) accommodates the force–displacement data from the cantilever bending as well as from the indent caused by the Berkovich indenter during loading. The loading curve of an additional indent (Fig. 3, blue) made in the close vicinity of the cantilever (Type 1 as an example) exemplifies its contribution to strain immediately from the onset of loading. Therefore, a sincere determination of the transition from elastic loading to the regime exhibiting pronounced hardening is impeded and would require a different experimental setup preventing the plastic strain input from the indenter (for instance, by using a flat punch indenter and larger bending lengths). Anyway, the contribution of the indentation depth to the total displacement is most prominent for early loading steps and becomes less important for loading steps at higher strains, where the indentation depth gets small with respect to the total displacement. In the steady state region, the indentation depth does not increase significantly anymore and so the contribution from the indenter to the total displacement diminishes: an additional indentation depth of 31 nm out of 2400 nm total displacement during the whole steady state regime compared to a 135 nm indentation depth contributing to a total displacement of 800 nm from the onset of loading until steady state. Consequently, no efforts were made to distinguish the particular plastic strain portions for Type 1–3 cantilevers since they are negligible for large displacements.
Contribution of the indentation depth caused by the Berkovich indenter (blue curve on the left, from an additional indent made in the close vicinity of the single crystalline cantilever) to the measured force–displacement data (black curves on the right) during loading of the single crystalline cantilever. Indentation depths are exemplarily given at the transition to the steady state regime (135 nm) and at the maximum displacement (166 nm), which results in 31 nm additional displacement during the steady state deformation.

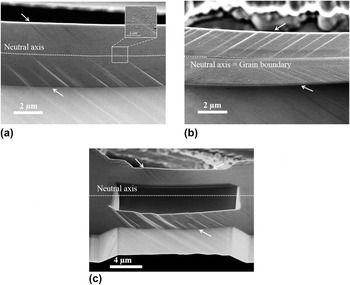
In the case of single crystalline Type 1 samples, only one glide system was activated and slip steps are visible on the surface [Fig. 4(a)]. A slight rotation between the slip plane orientation on the tension (in the front) and compression side (in the back) can be attributed to a bent after an applied surface strain of 0.03, at which the SEM image was recorded. Careful analysis of the slip step orientation at different distances from the sample base confirms even a very small rotation within the same side of the cantilever. The slip step height decreases from its maximum at the highly strained outer fiber toward the neutral axis and diminishes somewhere around the neutral axis in a less abrupt manner than observed for the bicrystalline Type 2 cantilever [Fig. 4(b)]. There the slip steps are forced to instantly stop at the neutral axis, because the grain boundary situated there acts as an impenetrable barrier as slip planes do not continue into another grain. In contrast, in the single crystalline Type 1 sample at least one weak slip step extends about 600 nm into the cantilever side exhibiting the reversed sign in shear stress. In Type 3 cantilevers, glide steps penetrate the whole cross section of the beam on the tension side [Fig. 4(c), in the front] without any noticeable reduction in glide step height. Note that the SEM images shown in Figs. 4(a)–4(c) were taken at much higher strains (0.03–0.07) than the presented stress versus strain curves in Figs. 2(a)–2(c), since at very low strains the slip steps are too faint to be resolved by SEM.
SEM images at 0.03–0.07 surface strain of all the three cantilevers: (a) single crystalline Type 1; (b) bicrystalline Type 2; (c) slit sample Type 3. White arrows mark the position and orientation of occurring glide steps.

IV. DISCUSSION
The observation of only a few slip steps in the SEM image of the single crystalline Type 1 cantilever [Fig. 4(a)] confirms localized deformation by one favorable oriented slip system. Due to the strongly bent cantilever the orientation of the slip steps varies slightly, however they still proceed on the same slip system. This is similar to findings from Motz et al. Reference Motz, Schöberl and Pippan1 who further argued that the operation of single dislocation sources on a limited number of slip planes results in a pile-up formation of GNDs at the neutral axis and hence, in pile-up stresses of opposite sign as the applied load. This pile-up approach provides a reasonable explanation for the experimentally observed nonlinear unloading curves [Fig. 2(a)], since the reduction in plastic strain in single crystalline cantilevers was attributed to the reverse motion of GNDs observed by µLaue experiments reported by Kirchlechner et al. Reference Kirchlechner, Grosinger, Kapp, Imrich, Micha, Ulrich, Keckes, Dehm and Motz5
The amplified back-flow observed in the stress versus strain curve of the bicrystalline Type 2 cantilever indicates higher pile-up stresses. This is consistent with the confinement of the dislocation pile-up by the impenetrable boundary [Fig. 4(b)]. Furthermore, this restriction requires a higher number of activated slip systems as can be estimated from the SEM images (0.37; 0.55; 0.13 in slip steps/µm normalized for 0.01 strain for Type 1; Type 2; Type 3, respectively). The serrated curve reveals the plastic character of the back-flow and agrees to the observations of discrete dislocation events Reference Csikor, Motz, Weygand, Zaiser and Zapperi23 being a fingerprint of the avalanche-like back-flow of dislocations in the pile-ups. The serrated dissolution of pile-ups requires a temporary blocking of the dislocations in the pile-up, for instance, by a limited number of nonprimary dislocations. At high total strains, the plastic unloading curve becomes smooth, indicating that nonprimary dislocations entangle the pile-up dislocations and the avalanche-like back-flow of dislocations is suppressed. Also the amount of reverse strain is significantly reduced, which is in good agreement with the proposed entanglement of GNDs and SSDs which hinders a complete dissolution of the pile-ups.
The weaker reversibility of GNDs in Type 1 compared to Type 2 samples [Fig. 2(d), black and red unloading curves] is attributed to smaller pile-up stresses as a consequence of a weaker confinement of the GND pile-up at the neutral axis compared to an impenetrable grain boundary. Thus, it seems that the neutral axis acts as a weaker barrier for dislocations than the grain boundary and at least some GNDs must be able to propagate beyond the neutral axis. Although several slip steps were revealed in the vicinity of the neutral axis shown in Fig. 4(a), distinct signs for slip activity across the neutral axis are rare. The magnification in Fig. 4(a) shows such a rare case of a slip step extending across the neutral axis. The restricted visibility of slip beyond the neutral axis is most probably an unfavorable interplay of small slip step heights, carbon contamination of the sample surface, and the limited resolution of the SEM, which is insufficient to resolve slip steps derived from only a few dislocations. Higher applied strains in the bicrystalline cantilever (0.043 total strain) caused higher slip step heights and thereby improved the visibility in the SEM compared to the single crystalline cantilever (0.03 total strain), especially in the region around the neutral axis. It is strongly assumed that more pronounced slip steps penetrating the neutral axis would have been detected in the single crystalline cantilever at higher applied strains.
The lack of the Bauschinger effect in Type 3 cantilever and the slip steps penetrating from the outer surface to the inner surface confirm the role of the neutral axis as a “strain”-interface in the single crystalline cantilever. The free inner surface of the slit sample allows for an escape of dislocations and thus, either no or a very little amount of pile-up dislocations form. Pile-up stresses are significantly reduced compared to the single crystalline Type 1 samples or are even lacking, and no back-flow is observed.
Besides understanding the reversibility of dislocation motion at the micrometer scale, these experiments allow for a deeper understanding of hardening in micrometer-sized samples, in particular to unravel different hardening mechanisms present at the micrometer scale. Since the glide steps are strongly localized and only a limited number of initial dislocations exist, work hardening does not take place at low strains. However, at higher strains the smoothing and disappearance of the reverse part of the unloading curve suggests an increase in total dislocation density, and thus, work hardening can play a role. However, work hardening is not responsible for the major strength increase with respect to macroscopically sized copper bending beams.
Strain gradients and their effect on hardening are inherent to the bending geometry in micrometer-sized cantilevers. However, Motz et al. Reference Motz, Schöberl and Pippan1 showed that the strain gradients cannot solely be responsible for the increased flow stress in micrometer-sized FIB milled cantilevers. Here, we can support the ideas of Motz and co-workers Reference Motz, Schöberl and Pippan1 in copper or later by Gong and Wilkinson Reference Gong and Wilkinson2 in α-titanium single crystals by a simple comparison: the strain gradients in the three types of equally sized bending beams do not nominally differ. Still, the strength of the cantilevers is significantly different (compare 315, 343, and 226 MPa at 0.01 surface strain) and strain gradients cannot solely be responsible for the observed flow stress increase with respect to macroscopic flow stresses.
From bending experiments conducted in the SEM one may expect to see the location of dislocation sources and to calculate the activation stress. Indeed, one can conclude that most of the dislocation sources will be activated in the highly stressed region near the outer fiber, where the slip step height gains its maximum for Type 1 and 2 cantilevers [Figs. 3(a) and 3(b)]. However, identifying the exact location of the site where dislocation sources had been activated is not possible, which hinders the determination of source activation stresses in micrometer-sized bending beams. Thus, no conclusions can be drawn at the elastic limit where the source requiring the lowest activation stress is expected to be activated. The exact determination of surface stresses at the elastic limit is further complicated by the smooth transition from elastic loading to pronounced hardening at very low strains.
In the plateau region of the stress versus strain curve, the strength of the material is not only determined by the source activation stress, but even more by the long range stress field of the pile-up acting as back stress on the dislocation source. The cantilever without pronounced pile-up (Type 3) exhibits the lowest surface stress at 0.01 surface strain (226 MPa); the sample with intermediate pile-up sizes (the single crystalline sample) has the second highest surface stress at 0.01 surface strain (315 MPa). Finally, the sample with the confined pile-up exhibits the highest plateau stress at comparable surface strains (343 MPa). This fits well with the observed unloading behavior where the Bauschinger effect also scales with pile-up stresses.
Nevertheless, a quantitative investigation of the dislocation structure and the GND as well as SSD density is compulsory for quantitative conclusions on the hardening behavior of micrometer-sized bending cantilevers in the future, however is complicated by the dissolution of the pile-up during unloading.
V. CONCLUSION
In situ loading–unloading micro bending experiments were performed on three different cantilever geometries. The size of the pile-up predominantly controls the mechanical properties of the bending beam, as confining the pile-up in a bicrystalline cantilever led to the amplification of the Bauschinger effect, as well as a more pronounced hardening behavior. In contrast, the reduction of the pile-up causes the absence of the Bauschinger effect and a strongly reduced hardening behavior, even though all the samples exhibit a comparable strain gradient.
ACKNOWLEDGMENTS
The authors thank Prof. Z. F. Zhang from the Shenyang National Laboratory (China) for providing one macroscopic bicrystal, Prof. C. Motz from Universität des Saarlandes, Saarbrücken (Germany) for valuable discussion, and Dr. S. Brinckmann from the MPIE for additional FEM analysis justifying the assumed stress distribution in the cantilever. Financial support by the FWF Austrian Science Fund through project number P24429-N20 is gratefully acknowledged.