1. Introduction
Turbulent stratified flows are ubiquitous in nature, most notably in the Earth's atmosphere or in oceans, but are highly challenging to study in laboratories. This impediment is due to the requirement of very large installations to monitor the different characteristic scales of turbulence. It is then of interest to construct idealized hydrodynamical models to more easily capture the transition towards disordered motions and explore connections with the spontaneous formation of density layers in stratified fluids (Oglethorpe, Caulfield & Woods Reference Oglethorpe, Caulfield and Woods2013). Indeed, the challenge of clearly explaining the layering and mixing, naturally present in geophysical flows, remains open (see e.g. Caulfield (Reference Caulfield2021) for a recent review). This question has fundamental ramifications as it relates directly to the transport of heat, pollutants or bio-mass in the density-stratified fluids present on Earth. Over the past decades, several contributions to the study of turbulent stratified flows have been made, seeking a complete description of the mechanisms responsible for layering and mixing (Taylor et al. Reference Taylor, Deusebio, Caulfield and Kerswell2016; Zhou, Taylor & Caulfield Reference Zhou, Taylor and Caulfield2017a; Zhou et al. Reference Zhou, Taylor, Caulfield and Linden2017b). Notably, these works demonstrated that stratified turbulence inherits a strong anisotropy while developing, and that inhomogeneous diffusive processes, such as mixing, are a direct consequence of this spatially intermittent phenomenon.
The novelty of our approach lies in the generation of turbulence through instabilities of a model flow, namely the stratified horizontally sheared Poiseuille flow (Le Gal et al. Reference Le Gal, Harlander, Borcia, Le Dizès, Chen and Favier2021). It is worth emphasizing the difference with the more classical two-dimensional case, where both stratification and shear lie on the same plane (Gage & Reid Reference Gage and Reid1968). In fact, it has been known since the studies of Basovich & Tsimring (Reference Basovich and Tsimring1984) and Bakas & Farrell (Reference Bakas and Farrell2009a,Reference Bakas and Farrellb) that most environmental flows generate internal gravity waves spontaneously whenever the stratification is oriented vertically (as is usually the case). In addition, these small-scale waves propagate (with a Doppler shift) and interact within the density layers, leading to instabilities (Satomura Reference Satomura1981). Historically, wave resonances in parallel sheared fluids have been introduced in the seminal paper of Cairns (Reference Cairns1979) and extended further to diverse configurations of stratified flows (see, for instance, the review by Carpenter et al. (Reference Carpenter, Tedford, Heifetz and Lawrence2011) on this topic). Moreover, such instabilities can transit to turbulence due to the collapse of finite size disturbances, once the system saturates and reaches the nonlinear regime (Caulfield Reference Caulfield1994). One benefit in considering instabilities is therefore the unnecessary need to trigger turbulence by explicit forcing, since the dynamics is self-sustained by definition. Hence our study makes use of these instabilities to follow the route towards stratified turbulence, as done in a plethora of recent investigations on linear instabilities of stratified flows. Notably, we rely on the observations made for Taylor–Couette flows (Molemaker, McWilliams & Yavneh Reference Molemaker, McWilliams and Yavneh2001; Le Bars & Le Gal Reference Le Bars and Le Gal2007; Le Dizès & Riedinger Reference Le Dizès and Riedinger2010; Park & Billant Reference Park and Billant2013), plane Couette flows with spanwise stratification (Facchini et al. Reference Facchini, Favier, Le Gal, Wang and Le Bars2018; Lucas, Caulfield & Kerswell Reference Lucas, Caulfield and Kerswell2019), and a selection of rotating flows (Billant & Chomaz Reference Billant and Chomaz2000; Le Dizès & Billant Reference Le Dizès and Billant2009; Riedinger, Le Dizès & Meunier Reference Riedinger, Le Dizès and Meunier2011). All the latter instabilities are indeed caused by the resonant interaction of Doppler-shifted internal gravity waves, which is the case in our context as well (Le Gal et al. Reference Le Gal, Harlander, Borcia, Le Dizès, Chen and Favier2021).
In this paper, we demonstrate the presence of a symmetry-breaking mechanism, when the primary linear instability saturates and the flow enters the nonlinear regime, with the appearance of a spatial modulation of the basic plane Poiseuille flow profile. This modification in the streamwise mean velocity profile is a direct consequence of the nonlinear interaction of harmonics, originally generated by counter-propagating internal gravity waves. The loss of invariance along the vertical additionally results in the formation of a localized region where the velocity fluctuates, inducing new spanwise shear in the system. While the vertical gradients are sharpened, the flow eventually becomes subject to secondary instabilities that further saturate and break down into turbulence, through a series of bursting events (Lucas, Caulfield & Kerswell Reference Lucas, Caulfield and Kerswell2017). A similar breakdown to turbulence originating from an initial linear instability followed by Kelvin–Helmholtz-like overturning events was observed in a numerical simulation of the Kolmogorov model flow (Lucas et al. Reference Lucas, Caulfield and Kerswell2017), where the authors exhibit connections between a linear instability and exact nonlinear coherent structures. In the case of linearly unstable stratified Couette flow, Lucas et al. (Reference Lucas, Caulfield and Kerswell2019) also observed streaks that originate from the bursting of a Kelvin–Helmholtz instability. However, in this case, at late time of their numerical simulations, the streaky flow is similar to the turbulent state that they simulated in the linearly stable case when turbulence is triggered subcritically. Therefore, the authors concluded that the ultimate sustained turbulent attractor in the stratified Couette flow is the same whatever the instability process, and moreover that it has the characteristics of the general self-sustaining process of non-stratified shear flows (Waleffe Reference Waleffe1997). It is indeed known that this interplay between streaks, waves and streamwise rolls is at the origin of the nonlinear regimes of unstratified shear flows. As shown by Reetz, Kreilos & Schneider (Reference Reetz, Kreilos and Schneider2019), the final steps of the transition that consists of alternating laminar and turbulent bands (as observed in experiments and numerical simulations; see Tuckerman, Chantry & Barkley Reference Tuckerman, Chantry and Barkley2020) is constructed by windowing the initial streaky pattern in a process already used and fully described by Gibson & Brand (Reference Gibson and Brand2014).
We describe here our transition scenario of the stratified Poiseuille flow by means of direct numerical simulations (DNS) in a doubly-periodic geometry with finite extension in the wall-normal direction. We support our observations with the computation of local measures of vertical shear from our direct computations to highlight this novel phenomenology.
The paper is structured as follows. Section 2 introduces the mathematical settings. Section 3 presents the linear stability analysis of our configuration and how the stability of discrete harmonics is determined accordingly. Section 4 is dedicated to DNS close to the instability threshold. We further discuss the symmetry-breaking mechanism and the mean flow interaction that it induces. Section 5 describes the phenomenology observed when departing from the onset of instability. We observe here the triggering of stratified turbulence, initiated from the mechanisms reported previously. Finally, we conclude our study in § 6 with some discussions and suggestions for future extensions of this work.
2. Mathematical formulation
The present work deals with a model of incompressible linearly stratified shear flow enclosed between two parallel walls that are a distance  $D$ apart (Le Gal et al. Reference Le Gal, Harlander, Borcia, Le Dizès, Chen and Favier2021). This stratification is assumed to be directed along the axis orthogonal to that of the shear plane. The geometry considered here is the Cartesian frame of reference
 $(\boldsymbol {e}_X,\boldsymbol {e}_Y,\boldsymbol {e}_Z)$, with corresponding coordinates
 $\boldsymbol {X}=(X,Y,Z)$, describing the streamwise, cross-stream and vertical directions, respectively. Boundary conditions are no-slip and insulating on both walls at
 $Y=\pm D/2$. In addition, we assume periodicity along the
 $X$ and
 $Z$ directions.
We express the buoyancy field as
 \begin{equation} \rho(\boldsymbol{X},T) = \rho_L(Z) + \rho'(\boldsymbol{X},T), \end{equation}
where  $\rho '$ represents the fluctuating contribution, and
 $T$ is the dimensional time. Since we assume a stable stratification, the linear profile in (2.1) is written as
 $\rho _L(Z)=\rho _0(1-ZN^2/g)$, where
 $N$ is the Brunt–Väisälä frequency
 $N=\sqrt {-(g/\rho _0)({\rm {d}}\rho _L/{\rm {d}} Z)}$ (assumed to be real and constant), and
 $g$ is the constant acceleration due to gravity.
We render this configuration non-dimensional by means of an advective time scale  $\tau =D/(2U)$, with
 $U$ being the local maximum of the mean velocity, and
 $D/2$ the half gap. Coordinates are scaled accordingly, whereas pressure and density are expressed in the units of
 $\rho _0 U^2$ and
 $2\rho _0N^2/(gD)$, respectively. Hence the non-dimensional velocity field
 $\boldsymbol {u}=(u,v,w)$, pressure
 $p$ and buoyancy
 $b=g\rho '/\rho _0$ (we use the same sign convention as in Davidson Reference Davidson2013) are governed by the following set of equations:
 \begin{gather} \partial_t \boldsymbol{u} + \left( \boldsymbol{u} \boldsymbol{\cdot} \boldsymbol{\nabla} \right) \boldsymbol{u} ={-} \boldsymbol{\nabla} p - {{Fr}}^{{-}2}\,b \boldsymbol{e}_z + {{Re}}^{{-}1}\,\nabla^2 \boldsymbol{u} + f\boldsymbol{e}_x, \end{gather}
 \begin{gather}\partial_t b + \left( \boldsymbol{u} \boldsymbol{\cdot} \boldsymbol{\nabla} \right) b = w + \left({{Re}}\,{{Sc}}\right)^{{-}1}\,\nabla^2 b, \end{gather}
 \begin{gather}\boldsymbol{\nabla} \boldsymbol{\cdot} \boldsymbol{u} = 0, \end{gather}
where  $f$ is a spatially uniform term enforcing the streamwise shear profile. This force can correspond to either a steady pressure gradient
 $f = 2\,{{Re}}^{-1}$ or an unsteady function ensuring conservation of the total mass flux
 $Q = \int _{-1}^{1} \int _{-L_x/2}^{L_x/2} u \,{\rm {d}}\kern0.7pt x \,{\rm {d}} y$. In both cases, and in the absence of instabilities, the balance between this external force and viscosity leads to the same base state velocity profile, the well-known plane Poiseuille solution
 $U_0(y) = 1 - y^2$, that is invariant in the
 $z$-coordinate. However, if the base system is unstable, then we expect the choice of forcing to influence the nonlinear regime. We emphasize that (2.2) contain the Reynolds, Froude and Schmidt numbers as control parameters, defined by
 \begin{equation} {{Re}} = \frac{UD}{2\nu},\quad {{Fr}} = \frac{2U}{DN},\quad {{Sc}} = \frac{\nu}{\kappa}, \end{equation}
where  $\nu$ and
 $\kappa$ are the constant kinematic viscosity and diffusivity, respectively.
We perform DNS of (2.2) by means of the spectral elements solver Nek5000 (Fischer Reference Fischer1997; Fischer et al. Reference Fischer, Loth, Lee, Lee, Smith and Bassiouny2007). Our numerical domain consists of a rectangular parallelepiped of fixed size  $\mathcal {D} = [-L_x/2,L_x/2] \times [-1,1] \times [-L_z/2,L_z/2]$, designed such that the most unstable linear mode can develop. In addition, we assume periodic conditions and equispaced elements in both
 $x$ and
 $z$ directions. We use a non-uniform distribution of wall-normal elements to refine the mesh closer to the walls. Numerical convergence of the results was checked by increasing the spectral order
 $N_s$ and comparing the theoretical predictions of growth rates from linear theory with the numerical exponential growth in vertical kinetic energy. Agreement was assumed satisfactory when the absolute difference between the latter was
 ${\sim }1\,\%$. We also monitored a few statistical quantities during the saturation phase, such as the viscous dissipation or the vertical kinetic energy (both defined below). Once a fixed number of elements and quadrature nodes was considered sufficient, we still multiplied the total by
 $1.5$ or
 $2$ to reach a high-end accuracy. In summary, computations were done using
 $10$ elements per unstable streamwise wavelength,
 $16$–
 $24$ elements in the cross-stream direction, and
 $18$–
 $24$ elements along the vertical, for a total of
 ${\sim }13\,000$–
 $15\,000$ elements, with spectral order
 $N_s\in [8,12]$ (number of Gauss–Lobatto collocation points) and fixed values of
 ${{Sc}}=1$ and
 ${{Fr}}=2$. Following Le Gal et al. (Reference Le Gal, Harlander, Borcia, Le Dizès, Chen and Favier2021), the flow is initiated from the parabolic Poiseuille profile plus some random infinitesimal perturbations on the buoyancy field. Since we did not observe noticeable changes in the dynamics of the flow by using a constant pressure gradient or a constant flux, we therefore focused our attention on the latter to better fit with the experimental conditions described in Le Gal et al. (Reference Le Gal, Harlander, Borcia, Le Dizès, Chen and Favier2021).
3. Linear stability analysis
3.1. Global stability analysis
We perform a linear stability analysis of (2.2) by means of a pseudo-spectral collocation method. Perturbations of the basic state are expressed in terms of normal modes, taking advantage of the periodicity of the flow. Therefore, we introduce real spatial wavenumbers  $k_x,k_z$, as well as the complex frequency
 $\omega$, to expand perturbations
 $\boldsymbol {q}'=(\boldsymbol {u}',p',b')$ as
 \begin{equation} \boldsymbol{q}'(\boldsymbol{x},t) = \hat{\boldsymbol{q}}(y) \exp \left[ {\rm{i}} ( k_x x + k_z z - \omega t ) \right] + \textrm{c.c.} , \end{equation}
where  $\textrm {c.c.}$ stands for ‘complex conjugate’.
Substituting (3.1) within (2.2), while taking the divergence of (2.2a), we recover a differential expression for the pressure eigenfunction. The latter allows us to express the stratified Orr–Sommerfeld equation for the cross-stream velocity perturbation  $\hat {v}$. Subsequently, we recover the Squire equation, governing the perturbation of axial vorticity
 $\hat {\eta }$, by applying the curl operator on the wall-normal projection of (2.2a). The resulting linear system yields
 \begin{gather} \left[ k_x \left( U_0\,\hat{\nabla}^2 - {\rm{d}}^2U_0/{\rm{d}} y^2 \right) + {\rm{i}}\,{{Re}}^{{-}1}\,\hat{\nabla}^4 \right] \hat{v} - {{Fr}}^{{-}2}\,k_z\,{\rm{d}}\hat{b}/{\rm{d}} y = \omega\,\hat{\nabla}^2 \hat{v}, \end{gather}
 \begin{gather}k_z \left({\rm{d}} U_0/{\rm{d}} y\right) \hat{v} + \left( k_x U_0 + {\rm{i}}\,{{Re}}^{{-}1}\, \hat{\nabla}^2 \right) \hat{\eta} - {{Fr}}^{{-}2}\,k_x \hat{b} = \omega \hat{\eta}, \end{gather}
 \begin{gather}- k^{{-}2} \left( k_z\,{\rm{d}}\hat{v}/{\rm{d}} y + k_x \hat{\eta} \right) + \left[ k_x U_0 + {\rm{i}} \left( {{Re}}\,{{Sc}} \right)^{{-}1} \hat{\nabla}^2 \right] \hat{b} = \omega \hat{b}, \end{gather}
where  $k^2=k_x^2+k_z^2$ is the wavevector squared norm, and
 $\hat {\nabla }^2={\rm {d}}^2/{\rm {d}} y^2 - k^2$ is the Laplacian operator in Fourier space. System (3.2) describes a boundary eigenvalue problem of the form
 $A\hat {\boldsymbol {\xi }}=\omega B \hat {\boldsymbol {\xi }}$, for the eigenfrequency
 $\omega$ and eigenfunction
 $\hat {\boldsymbol {\xi }}=[\hat {v},\hat {\eta },\hat {b}]^{{\rm T}}$ (where the superscript T denotes transposition). The latter set of equations is supplemented with no-slip and insulating boundary conditions, reading
 $\hat {v}={\rm {d}}\hat {v}/{\rm {d}} y=\hat {\eta }={\rm {d}}\hat {b}/{\rm {d}} y=0$ at
 $y=\pm 1$.
We use a Galerkin approach to discretize the differential operators, based on the expansion of the eigenfunctions in terms of Chebyshev polynomials. Simultaneously, we apply a collocation method at the Gauss–Lobatto quadrature nodes
 \begin{equation} y_j = \cos{\left(\frac{j{\rm \pi}}{M+1}\right)},\quad j=1,\ldots,M, \end{equation}
for a fixed truncation order  $M$. We verified the convergence of this method, based on the relative error of the eigenvalues of (3.2), as
 $M$ was increased. In general, a value
 $M\sim 40$ was large enough to reach a reasonable tolerance.
3.2. Results
The classical unstratified ( ${{Fr}}\to +\infty$) plane Poiseuille flow is subject to a linear instability, due to the growth of a Tollmien–Schlichting (TS) wave (Tollmien Reference Tollmien1929; Schlichting Reference Schlichting1933). This well-known instability occurs at a critical Reynolds number
 ${{Re}}_c\sim 5770$ (Orszag Reference Orszag1971) and has been the subject of extensive studies on the transition from laminar flows to turbulence. As shown in Le Gal et al. (Reference Le Gal, Harlander, Borcia, Le Dizès, Chen and Favier2021), the consideration of a stable profile of density stratification perpendicular to the shear plane greatly lowers the instability threshold. The principal argument suggested by the authors is that such a flow allows for resonances of internal gravity waves (among themselves or eventually with viscous TS waves), leading to the onset of a new instability. A similar conclusion was drawn in the context of plane Couette flow, where a growth of perturbations due to the resonance of Doppler-shifted gravity waves was observed (Facchini et al. Reference Facchini, Favier, Le Gal, Wang and Le Bars2018). We recall, though, that Couette flow is unconditionally stable to infinitesimal disturbances in the unstratified limit and maintained by viscosity, which is not the case here.
Our interest for the present paper is to go beyond the results obtained in Le Gal et al. (Reference Le Gal, Harlander, Borcia, Le Dizès, Chen and Favier2021), by conducting a thorough analysis of the nonlinear saturation of this recently discovered instability. Therefore, we use the linear stability results to extract the optimal wavenumbers  $k_x^{opt},k_z^{opt}$, associated with modes of largest growth rates for a given set of control parameters. We display in figure 1 the stability results at different Reynolds numbers, close to the instability threshold (for this set of parameters, we have a critical Reynolds number
 ${{Re}}_c\sim 480$). We recall that
 ${{Fr}}=2$ and
 ${{Sc}}=1$ (thus differing from experimental values). For computational reasons, the red crosses in this figure represent the locations in the wavenumber space of the discretized modes present in our DNS domain; see § 4. We then determine whether unstable harmonics of the fundamental mode are present within the unstable region or not. It becomes clear that the case
 ${{Re}}=550$ contains only stable harmonics, whereas the other two cases allow unstable harmonics within the domain of instability. Note that when comparing the shape of the unstable domain for the Poiseuille flow (see figure 1a) and the shape of the domain for the Couette flow (see figures 2 and 3 of Facchini et al. Reference Facchini, Favier, Le Gal, Wang and Le Bars2018), it is obvious that the cases where two or more wavevectors become unstable together is much more difficult (if not impossible) in the Couette configuration. This might explain why Lucas et al. (Reference Lucas, Caulfield and Kerswell2019) never observed our scenario for the stratified Couette flow.
Growth rate contours in the  $(k_x,k_z)$ space from the linear stability analysis of (3.2) at
 ${{Fr}}=2$,
 ${{Sc}}=1$ and over different Reynolds numbers: (a)
 ${{Re}}=550$, (b)
 ${{Re}}=580$, (c)
 ${{Re}}=700$. Red crosses correspond to the discretized modes present in our DNS domain (cf. § 4). White regions correspond to negative growth rates, i.e. stability.

4. Weakly nonlinear saturation near the onset
This section is devoted to the stability analysis of the nonlinear dynamical regime, in the vicinity of the bifurcation. As mentioned, the numerical domain chosen is an elongated rectangular parallelepiped of size  $\mathcal {D} = [-\lambda _x/2,\lambda _x/2] \times [-1,1] \times [-2\lambda _z,2\lambda _z]$, with fundamental wavelengths
 $\lambda _x = 2{\rm \pi} /k_x^{opt}$ and
 $\lambda _z = 2{\rm \pi} /k_z^{opt}$ that depend on the control parameters. Our main focus being the possible emergence of modulations along the
 $z$-coordinate, this is why we consider boxes encompassing multiple unstable wavelengths along the vertical. However, we do not explore eventual horizontal modulations since we restrict the streamwise extension to only one unstable wavelength. We monitor the growth of the instability by computing the quantity
 \begin{equation} \mathcal{K}_z = \frac{1}{2}\,\langle w^2 \rangle_{\mathcal{D}} = \frac{1}{2\mathcal{D}} \int_{\mathcal{D}} w^2\,{\rm{d}} V, \end{equation}
where  $\langle {\cdot }\rangle _{\mathcal {D}}$ denotes averaging over the volume
 $\mathcal {D}$. We therefore expect, from the definition of (4.1) and linear theory, to first observe an exponential increase in energy, following a slope of twice the growth rate.
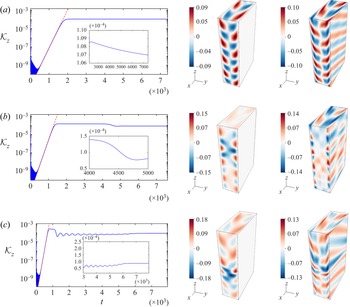
We start by presenting in figure 2 a set of vertical kinetic energies, computed over time, for Reynolds numbers close to the instability threshold (in the present case,  $Re_c\sim 480$). In addition, we add snapshots of the streamwise velocity and perturbed buoyancy profile at the latest instant of computation (last point of the energy curves). Not surprisingly, we notice the exponential growth of disturbances in the first part of each curve. The slope in logarithmic scale is further confirmed from linear stability analysis, as shown by the red dashed lines. Then, once the perturbations reach an order of magnitude similar to that of the base flow, nonlinearities are no longer negligible and the system departs from linear theory.
Vertical kinetic energy curves (in logarithmic scale) over time (left-hand plots), with snapshots of the streamwise velocity fluctuation  $u-U_0$ (middle) and the buoyancy perturbation
 $b$ (right), computed at the latest time of each simulation. Reynolds numbers are (a)
 ${{Re}}=550$, (b)
 ${{Re}}=580$, and (c)
 ${{Re}}=700$. Red dashed lines in the left-hand plots represent twice the growth rates of the dominant unstable mode, as predicted from linear theory. Close-up views are displayed as insets for each configuration, highlighting the nonlinear behaviour.

The first case of interest,  ${{Re}}=550$, is fairly simple to understand as the instability saturates in the form of a quasi-stationary solution (we still nevertheless observe a small decay over a viscous time in the nonlinear regime, as shown by the inset in figure 2a). The saturated amplitude represented here corresponds physically to a meandering in the streamwise velocity, according to the velocity snapshot displayed in the same figure. Similar profiles have already been observed in the experiment of Le Gal et al. (Reference Le Gal, Harlander, Borcia, Le Dizès, Chen and Favier2021) (cf. their figure 3(a) for particle image velocimetry and DNS visualizations). Besides this steady and vertically homogeneous configuration, we notice interesting features in figures 2(b,c), corresponding to the computations at
 ${{Re}}=580$ and
 ${{Re}}=700$. There is indeed a finite time at which this homogeneous state departs from the primary branch via a secondary bifurcation, as displayed in the insets of figure 2. Once the bifurcated solutions reach a stationary state, at the end of each simulation, the corresponding velocity and buoyancy profiles are no longer homogeneous. As a consequence, a localized structure of velocity emerges along the vertical, and the buoyancy perturbations also become inhomogeneous and localized. Clearly, we observe a spontaneous pattern formation due to a symmetry-breaking mechanism, our system being initially invariant along
 $z$.
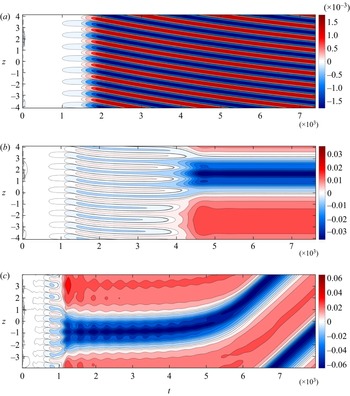
Hovmöller diagrams of the horizontally averaged streamwise velocity fluctuation  $\langle u - U_0 \rangle _H$, computed in the
 $(t,z)$-plane. Positive (negative) values are displayed in red (blue). The area of constant colour on the left of each plot represents the exponential growth of disturbances. Reynolds numbers are (a)
 ${{Re}}=550$, (b)
 ${{Re}}=580$, and (c)
 ${{Re}}=700$.

As we notice in most of the cases a loss of symmetry along the vertical, we introduce an averaging operator for quantifying horizontal measures, defined as  $\langle {\cdot }\rangle _H \unicode{x2254} (2\lambda _x)^{-1} \iint {\cdot }{\rm {d}}\kern0.7pt x\,{\rm {d}} y$. One way to capture and identify the peculiar transition described earlier is to compute Hovmöller diagrams of the horizontally averaged streamwise velocity fluctuation
 $\langle u - U_0 \rangle _H$. This is represented in figure 3 for the three configurations in which we are interested. As we noticed earlier, the case corresponding to
 ${{Re}}=550$ displays harmonic modulations of the horizontally averaged streamwise velocity that is slowly drifting in time. Note that this is effectively a correction to the initially
 $z$-invariant Poiseuille profile, although it remains small in amplitude at this Reynolds number. For this simulation, we expect the weak temporal drift to vanish as we reach a large enough viscous time (scaling thus with
 ${{Re}}$), until the symmetric solution would ultimately be restored. This neutral drift observed here depends essentially on the initial random seed used for the computation. Indeed, we observed various shifts of the solution depending on the initial perturbations that we used (not shown). Pursuing our investigation, the most striking observation from figure 3(b) is the sudden coarsening of the mean flow modulation at the finite time corresponding to the secondary bifurcation in figure 2(b). Indeed, for
 $t\sim 4\times 10^3$, the system undergoes a symmetry-breaking mechanism, allowing for the formation of a box-scale modulation of the mean Poiseuille profile that is not harmonic: the region of reduced streamwise velocity is sharp and localized, while the accelerated region is broader (see figure 4 below). We recall that the streamwise mass flux is conserved in all of our simulations. This phenomenon fills the whole numerical domain and saturates in the form of a steady nonlinear solution. More surprisingly, the case
 ${{Re}}=700$ displayed in figure 3(c) also depicts the same symmetry-breaking mechanism (although at a shorter time), with a localized structure in the velocity profile, but converges instead to a drifting mode. This uniform shift seems unrelated to the drift observed at
 ${{Re}}=550$, since we observe it irrespective of the initial conditions. Determining its origin would require a dedicated nonlinear analysis, which is beyond the scope of this paper. We recall here that a very similar phenomenology is observed when using the more classical imposed pressure gradient forcing to sustain the mean Poiseuille flow. It is naturally emerging from the nonlinear interaction of unstable waves with the mean flow, regardless of the force sustaining it.
Each curve is computed at the latest time of simulation in figure 3, once the solution has converged. (a) Horizontally averaged streamwise velocity fluctuations as a function of the vertical coordinate. (b) Spectral energy in Fourier space of the averaged velocity profiles from (a). The principal amplitude peaks are displayed with vertical lines and labelled with their associated representation defined in (4.5).

Let us now investigate the wave–mean flow interaction that is depicted here, using arguments from linear theory. Using the averaging operator over the horizontal plane introduced earlier, we define the Reynolds-averaged decomposition of the field  $\boldsymbol {q}=(\boldsymbol {u},p,b)$ as
 \begin{equation} \boldsymbol{q}=\langle\boldsymbol{q}\rangle_H(z,t) + \boldsymbol{q}'(x,y,z,t), \end{equation}
thus separating the horizontal mean flow from the fluctuations. Substituting (4.2) in the streamwise projection of (2.2a), along with boundary conditions, we recover the mean field equation
 \begin{equation} \frac{\partial}{\partial t} \langle u \rangle_H + \frac{\partial}{\partial z} \langle u' w' \rangle_H = {{Re}}^{{-}1} \left( \frac{\partial^2}{\partial z^2} \langle u \rangle_H + \left\langle \frac{\partial^2u}{\partial y^2} \right\rangle_H \right) + \langle f \rangle_H . \end{equation}
Equation (4.3) expresses the evolution of the mean flow and the transfer of momentum, by means of the divergence of Reynolds stresses (the second term on the left-hand side). If we consider the fluctuations to be written as a superposition of both upward and downward modes with distinct but nearby wavenumbers  $(k_z^{(1)},k_z^{(2)})$ and frequencies
 $(\omega ^{(1)},\omega ^{(2)})$, then we obtain
 \begin{align} u' &= \hat{u}_{11} \exp({{\rm{i}}(k_x x + k_z^{(1)} z - \omega^{(1)} t)}) + \textrm{c.c.} + \hat{u}_{12} \exp({{\rm{i}}(k_x x - k_z^{(1)} z - \omega^{(1)} t)}) + \textrm{c.c.} \nonumber\\ &\quad + \hat{u}_{21} \exp({{\rm{i}}(k_x x + k_z^{(2)} z - \omega^{(2)} t)}) + \textrm{c.c.} + \hat{u}_{22} \exp({{\rm{i}}(k_x x - k_z^{(2)} z - \omega^{(2)} t)}) + \textrm{c.c.}, \end{align}
with the same decomposition holding for  $w'$. We emphasize that wavenumbers
 $k_z^{(1)}$ and
 $k_z^{(2)}$ are an illustration of the red crosses computed in figure 1. Subsequently, we expand the Reynolds stress term in (4.3), using the modal decomposition (4.4), and we find
 \begin{align} \langle u' w' \rangle_H &= \langle \hat{u}_{11}\hat{w}_{11}^{*} + \hat{u}_{12}\hat{w}_{12}^{*} + \hat{u}_{21}\hat{w}_{21}^{*} + \hat{u}_{22}\hat{w}_{22}^{*} \rangle_H + \textrm{c.c.} \nonumber\\ &\quad + \langle \hat{u}_{11}\hat{w}_{12}^{*} + \hat{u}_{12}^{*}\hat{w}_{11} \rangle_H \exp({2{\rm{i}} k_z^{(1)} z}) + \textrm{c.c.} \nonumber\\ &\quad + \langle \hat{u}_{21}\hat{w}_{22}^{*} + \hat{u}_{22}^{*}\hat{w}_{21} \rangle_H \exp({2{\rm{i}} k_z^{(2)} z}) + \textrm{c.c.} \nonumber\\ &\quad + \langle \hat{u}_{11}\hat{w}_{22}^{*} + \hat{u}_{22}^{*}\hat{w}_{11} \rangle_H \exp({{\rm{i}}[(k_z^{(1)}+k_z^{(2)}) z - {\rm \Delta}\omega\,t]}) + \textrm{c.c.} \nonumber\\ &\quad + \langle \hat{u}_{11}\hat{w}_{21}^{*} + \hat{u}_{21}^{*}\hat{w}_{11} \rangle_H \exp({{\rm{i}}({\rm \Delta} k_z\,z - {\rm \Delta}\omega\,t)}) + \textrm{c.c.} , \end{align}
where  $^{*}$ denotes complex transposition, and
 ${\rm \Delta} k_z = k_{z}^{(1)} - k_{z}^{(2)}$ and
 ${\rm \Delta} \omega = \omega ^{(1)} - \omega ^{(2)}$ (a similar description with only one pair of modes can be found in Yang et al. Reference Yang, Tedford, Olsthoorn, Lefauve and Lawrence2022). We distinguish in (4.5) the contributions from self- and cross-interactions between a fixed set of discretized modes. As one can notice, computing the vertical divergence of the whole expression removes the contribution of self-interacting modes (the first term on the right-hand side) from the mean flow equation. However, cross-interaction of modes with the same vertical structure (second and third terms of the expression) yields a wave pattern with twice the original wavenumber. Expression (4.5) allows us to demonstrate, in a discrete framework, the resonance mechanism and the modulation in the mean flow due to the Reynolds stresses.
In figure 4, we present snapshots of the averaged velocity fluctuations  $\langle u - U_0 \rangle _H$ (we recall that
 $U_0=1-y^2$ is the plane Poiseuille profile), at the latest time of computations for each plot in figure 3. Clearly, we notice the loss of homogeneity, originally present in the solution at
 ${{Re}}=550$, when observing the other two curves. For instance, the transient solution
 ${{Re}}=580$ still displays the wave pattern at twice the initial wavenumber from the later case, but also tends to form a modulation that fills the entire numerical box. Additionally, we explore the spectral energy of the solution at first
 ${{Re}}=550$ in figure 4(b) and notice, as expected, the peak at
 $2k_z^{opt}$ and its harmonic at
 $4k_z^{opt}$ (with the correspondence
 $k_z^{opt}=k_z^{(1)}$ from (4.5)). We can easily notice this pattern emerging in the nonlinear regime of the first simulation at
 ${{Re}}=550$, as displayed in figures 3(a) and 4(a), with a total wavenumber
 $8k_z^{opt}$ (since the domain originally contains four unstable wavelengths). This same spatial structure is also present in the early stages of figures 3(b) and 3(c), until the time where the other modes start to contribute to the dynamics and break the symmetry. The intermediate case,
 ${{Re}}=580$, shows a transient solution, with a leading mode of wavenumber
 ${\rm \Delta} k_z = k_z^{opt}/4$ present in the spectrum of figure 4(b). Moreover, there exists lower peaks corresponding to
 $k_z^{(1)}+k_z^{(2)}=9k_z^{opt}/4$ and
 $2k_z^{(2)}=5k_z^{opt}/2$, with their harmonics, but they are all dominated by the mode at the size of the whole domain. Finally, the spectrum of the latest configuration at
 ${{Re}}=700$ is completely dominated by the mode of wavenumber
 ${\rm \Delta} k_z$ and enclosed by two sharp fronts of velocity. This profile is represented in figure 4(a) and highlights the generation and amplification of vertical shear, due to the increasing velocity gradient in that direction (with order of magnitude
 ${\sim }1$–
 $10\,\%$). We conclude that this spontaneous large-scale modulation is thus mainly due to an interaction of closely spaced unstable harmonics, generating interesting space–time wave patterns. Not surprisingly, these symmetry-breaking secondary bifurcations happen at a shorter time as the control parameter (
 ${{Re}}$) increases, allowing indeed more harmonics within the instability map. A demonstration of this feature was represented using linear theory in figure 1(a), with red crosses depicting the different harmonics.
This modulation that leads to a localized flow pattern could be compared to the exact invariant solutions of the Navier–Stokes equations as discovered in shear flows without stratification (Gibson & Brand Reference Gibson and Brand2014). However, today it is not known if the solutions that we discover in our numerical simulations have any connection with these localized nonlinear solution of the unstratified Poiseuille flow. To answer this open question, a continuation approach should be used in order to follow the bifurcated nonlinear branches when changing the Froude and Reynolds numbers. This task, which shares some interesting connections with the case of the rotating plane Couette flow (Nagata Reference Nagata1990), is of course beyond the scope of the present study.
We now try exploring configurations away from the instability threshold, to investigate whether we still observe a similar phenomenology and how it transits to turbulence.
5. Localized stratified turbulence far from the onset
Moving away from the instability threshold, we expect the flow to behave in a more chaotic way, and notably, we seek for the trigger of stratified turbulence. As already noticed in a previous study on the Kolmogorov flow with spanwise stratification (Lucas et al. Reference Lucas, Caulfield and Kerswell2017), the onset of turbulence occurs when  ${{Re}}\gg {{Re}}_c$ in regions with the largest vertical gradients of velocity (we recall that
 ${{Re}}_c$ is a critical Reynolds number computed from linear theory). It appears that the mechanism responsible for these events is induced by a secondary Kelvin–Helmholtz type overturning instability (Howard Reference Howard1961; Miles Reference Miles1961; Lucas et al. Reference Lucas, Caulfield and Kerswell2017). We therefore pay great attention in our computations to the local quantities determining the tendency of the flow to be subject to secondary shear instabilities. In particular, we establish local expressions for the Froude and gradient Richardson numbers (Lucas et al. Reference Lucas, Caulfield and Kerswell2017), as follows:
 \begin{equation} {{Fr}}_z = \frac{{{Fr}}}{\sqrt{1 - {{Fr}}^2\,\langle \partial_z b\rangle_H}}, \quad {{Ri}}_z = \frac{1}{{{Fr}}_z^2\,\langle \partial_z u\rangle_H^2}. \end{equation}
It is worth emphasizing that our system is initially homogeneous in the vertical direction, such that  ${{Fr}}_z|_{t=0}={{Fr}}$ and
 ${{Ri}}_z|_{t=0}=\infty$. In addition to these quantities, we also compute the viscous dissipation:
 \begin{equation} \mathcal{E} = {{Re}}^{{-}1} \left\langle \vert\boldsymbol{\nabla}\times\boldsymbol{u}\vert^2 \right\rangle_{\mathcal{D}}, \end{equation}
where the quantity within brackets is the total enstrophy of the flow. As the Reynolds number increases and disordered motions occur, we ensure that  $\eta >k_z^{max}$, where
 $\eta =(\mathcal {E}\,{{Re}}^3)^{-1/4}$ is the Kolmogorov length scale, and
 $k_z^{max}=2{\rm \pi} /l_z^{min}$ is the largest wavenumber computed with
 $l_z^{min}$, the finest mesh along the vertical (de Bruyn Kops & Riley Reference de Bruyn Kops and Riley1998; Brethouwer et al. Reference Brethouwer, Billant, Lindborg and Chomaz2007).
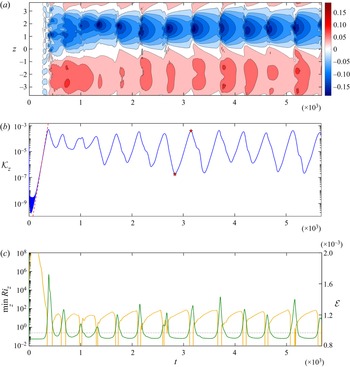
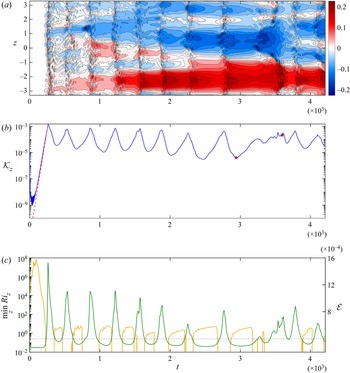
We present the local Richardson number in figure 5, along with the vertical kinetic energy and the Hovmöller diagram for the case  ${{Re}}=1500$, highlighting the saturation of the linear Poiseuille instability and the appearance of non-trivial dynamics. First, we still observe the large-scale vertical modulation of the mean Poiseuille profile discussed in the previous section. This phenomenon is therefore robust and persists well beyond the weakly nonlinear regime. Second, we observe in all the plots a series of bursting episodes, consisting in cycles of energy growth and decay. Soon after the symmetry-breaking transition at
 $t\sim 300$, the local Richardson number in figure 5(c) falls drastically until reaching a small interval of time where it becomes negative. This peculiarity emphasizes the presence of unstable stratification locally, and supports the onset of a secondary shear instability. We study further the quasi-periodic patterns displayed over time in figures 5(b) and 5(c), and explain this series of events as a consequence of the loss of vertical homogeneity, leading to the growth of vertical shear. Indeed, once the Richardson number becomes low enough to cross the theoretical threshold
 ${{Ri}}_z=1/4$ (Howard Reference Howard1961; Miles Reference Miles1961), the flow strengthens due to this secondary instability, until saturation, and then collapses into unsteady motion. We use the classical linear threshold as an indication only since we consider an unsteady nonlinear regime. Note, however, that the Richardson number drops over several order of magnitude in a very short time. Afterwards, energy diminishes due to turbulent dissipation (displayed in green) and presumably because the secondary instability has disappeared due to a mixing event, or the reduction in vertical shear. Indeed, the correlation between the fall in Richardson number and the growth of viscous dissipation soon after indicates that a secondary vertical-shear-induced instability triggers first and is then followed by a turbulent collapse and increased dissipation. The mean flow is then partially restored (still modulated along the vertical) to a state dominated by the interaction of internal gravity waves. In practice, the global picture might be more complex than this interpretation, due to the superposition of the two instabilities and the three-dimensional character of the flow, but all the previous arguments tend to support our overall description of this mechanism. From a dynamical point of view, we can view the system as trapped in a quasi-periodic attractor. Similar observations were made in the context of forced stratified turbulence, in relation to the formation of density layers (Lucas et al. Reference Lucas, Caulfield and Kerswell2017).
DNS at  ${{Re}}=1500$. (a) Hovmöller map of streamwise mean velocity fluctuations, with the same colour code as in figure 3. (b) Vertical kinetic energy in the spirit of figure 2. The two red markers indicate the extrema of a bursting episode, to be computed in detail in figure 6. (c) Vertical minimum of the gradient Richardson number over time, computed in logarithmic scale (left
 $y$-axis, yellow) and viscous dissipation
 $\mathcal {E}$ (right
 $y$-axis, dark green). The yellow curve is discontinuous whenever
 ${{Ri}}_z$ is negative (when the flow becomes locally unstable to convection). The thin dash-dotted line delimits the Kelvin–Helmholtz instability threshold of
 ${{Ri}}_z=1/4$ (Howard Reference Howard1961; Miles Reference Miles1961).

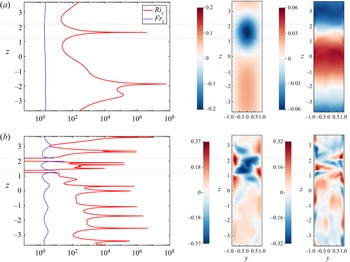
An interesting feature of figure 5(a) that we did not discuss yet is the robustness in the local modification of the velocity profile. The region where fluctuations decelerate the mean flow is localized in the vertical direction. As the energy increases, this thin layer shrinks further and hence the velocity gradients strengthen. To have a clearer view, we present snapshots of velocity and buoyancy profiles in figure 6 at both extrema of a bursting episode (denoted by the stars in figure 5b). It is evident from the representation of density fluctuations in figure 6(a) that domains of quiescent flow, surrounding the area of lowest horizontal velocity, slightly enhance the stratification profile. The two layers encompassing this region are both subject to the strongest vertical shear and therefore correspond to the lowest values of  ${{Ri}}_z$ in figure 6(b). At the peak of energy, the stratification becomes unstable (with overturning) at these coordinates, and the flow breaks down into a localized layer of chaotic motions. Strikingly, these disordered motions remain confined within a fixed interval (delimited by the thin dotted lines), before returning to the original layered configuration displayed in figure 6(a). This cyclical dynamics is well depicted through the Hovmöller diagram in figure 5(a).
Local measures of Froude and Richardson numbers (in logarithmic units) over the vertical coordinate, for the case  ${{Re}}=1500$. Data and snapshots are computed at (a)
 $t=2837$, and (b)
 $t=3151$ (see figure 5). The middle and right-hand plots represent the streamwise velocity fluctuation
 $u-U_0$ and the perturbation of buoyancy
 $b$, respectively, both displayed at an arbitrary position along
 $x$. The thin dotted lines passing through each set of plots delimit the interfaces where the secondary instabilities trigger and the flow collapses into stratified turbulence.

Increasing the Reynolds number further, up to  ${{Re}}=5000$, we present in figure 7 the same set of data as in figure 5. One instantaneous observation that one can make about figure 7(a) is the complexity of the Hovmöller diagram in the large
 ${{Re}}$ configuration. The interfaces are indeed no longer formed in an organized way, as previously, but they follow instead a coarse-graining dynamics of intermittent patterns. Regions of positive/negative velocity fluctuations emerge spontaneously due to bursting overturns that can produce localized layers of turbulence. In the meantime, we still observe through the simulation a dominant mode emerging slowly, at the size of the domain. This leads us to think that the resonance of harmonics with the fundamental mode dominates the other interactions. Once again, the vertical kinetic energy displays a series of cyclic episodes, while the local Richardson numbers are now almost always below the threshold of instability, or even negative. It is thus not surprising to notice additional regions of intermittency in the data, such as in figure 6(b), as turbulent states now influence largely the global dynamics. As we did for the case
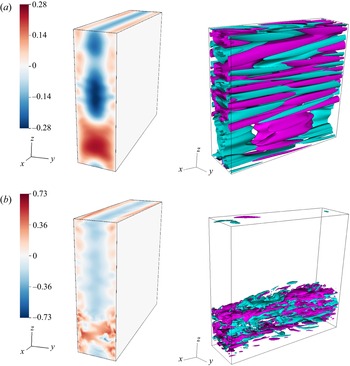
 ${{Re}}=1500$, we present in figure 8 two snapshots of horizontal velocity, taken at the times of lowest and largest energy peaks in a bursting episode. We notice one large region subject to shear instabilities, further collapsing into highly chaotic motions. Although the bursting events are now more forceful than previously, the turbulence still dies out before starting over a new cycle. This dynamics seems to persist over the simulations, and we expect the system to behave similarly as the vertical extension is modified, as soon as resonances are permitted within the numerical domain. To demonstrate this behaviour, we compute in figures 8(a,b) a visualization of the velocity field at
 $t=2940$ first, where the flow is assumed to be mostly laminar, and then at
 $t = 3600$, where a localized turbulent band is observed. This band is, of course, reminiscent of the turbulent bands observed during the transition of unstratified shear flows. Today, it is not known if the horizontal turbulent layers that we observe in our numerical simulations of the stratified Poiseuille flow have any connection with the streaks and/or the localized bands of the unstratified Poiseuille flow. One first difference is the value of the selected wavelength: in our case, the modulation affects the entire flow domain as it emerges from the interaction of close neighbour modes, contrary to the unstratified case where the pattern possesses its own periodicity. Another obvious difference between the flow patterns is the inclination angle of the turbulent regions, which is zero in the case with stratification and seems to be above
 $16^{\circ }$ without (Tuckerman et al. Reference Tuckerman, Chantry and Barkley2020). Note that for wall-normal density stratification, this comparison was documented by Liu, Caulfield & Gayme (Reference Liu, Caulfield and Gayme2022), where it is shown that (at least for the Couette flow) in the low Reynolds and low Richardson number regime, the spatial intermittency is associated with oblique turbulent bands that are qualitatively similar to those seen in unstratified plane Couette flow. On the contrary, in the high Reynolds and high Richardson number regime, quasi-horizontal flow structures resembling the turbulent–laminar layers take place as observed commonly in stratified flows.


Snapshots of the numerical computation at  ${{Re}}=5000$, computed at (a)
 $t=2940$, and (b)
 $t=3600$. The left-hand plots display the streamwise velocity fluctuation
 $u-U_0$, whereas the right-hand plots represent the associated iso-contours of wall-normal velocity. Positive (negative) iso-contours are represented in light purple (light blue) regardless of their magnitude.

6. Discussion
In this paper, we have presented a series of results on the plane Poiseuille flow with stable vertical stratification. One of the main reasons why we studied this configuration is, as was done originally in the unstratified limit, to study the transition from a laminar flow, subject to a linear instability, towards the onset and development of turbulence. First, we found that this system loses its vertical homogeneity as a consequence of an interaction of modes, whenever the numerical domain is elongated enough to allow unstable harmonics of the fundamental mode to exist. The result of this symmetry-breaking mechanism is the spontaneous formation of vertical gradients of velocity in the initially homogeneous Poiseuille profile. This additional shear induces secondary instabilities that we believe to be of Kelvin–Helmholtz type, as well as overturning events, confined in regions where the gradient Richardson number crosses the well-known critical threshold (Howard Reference Howard1961; Miles Reference Miles1961). Once this instability saturates and collapses into stratified turbulence, energy declines and the system returns to its former state, before the onset of instability. This quasi-periodic dynamics of bursting episodes, enclosed within finite layers, is a remarkable finding that, to the best of our knowledge, has never been observed in the literature on stratified fluids. However, it is not clear at this stage how the mean flow modulation will manifest itself in the limit of extremely elongated domain in the vertical direction, where a large number of unstable modes can coexist even close to the threshold. It also remains to verify whether such modulation can also occur in the streamwise direction if multiple horizontal wavelengths can fit into the numerical domain.
An important feature of this flow is, as mentioned, the spontaneous layering and the onset of turbulence, due to subsidiary shear instabilities. Moreover, these turbulent motions are encompassed between thin layers of finite size, delimited by interfaces where the Richardson number is the lowest. It is further observed that such regions are surrounded by a flow displaying the same meandering patterns as noticed originally by Le Gal et al. (Reference Le Gal, Harlander, Borcia, Le Dizès, Chen and Favier2021). As the Reynolds number is increased, intermittency takes place and we are no longer able to distinguish an organized formation of turbulent layers. In this context, configurations with several sets of layers (all undergoing a series of bursting events) are allowed to exist. These observations tend to highlight the presence of a similar homoclinic snaking mechanism that some dynamical systems are subject to Burke & Knobloch (Reference Burke and Knobloch2007). In recent papers, close connections between the field of pattern formation and the development of coherent structures, related to the layering of the flow, have been studied extensively (Lucas et al. Reference Lucas, Caulfield and Kerswell2017), notably in the context of unstratified plane Couette flow (Schneider, Gibson & Burke Reference Schneider, Gibson and Burke2010; Gibson & Schneider Reference Gibson and Schneider2016). These works demonstrated the existence of invariant solutions, restricted to one spatial dimension, using Newton-like algorithms to perform a parameter continuation. Eventually, we could consider a similar treatment in our framework, although computation of vertically localized solutions for such a configuration is expensive numerically and requires therefore a better understanding of the weakly nonlinear dynamics.
To explain the symmetry loss in the nonlinear regime, we decomposed the disturbances as a superposition of linear modes, while setting ourselves in the vicinity of the instability threshold. This allowed us to extract an explicit form for the Reynolds stress, assuming that the domain contains a finite number of harmonics. Although this approach is useful to understand the mechanism responsible for the onset of a secondary bifurcation and for the emergence of space–time modulations, it still adopts arguments from linear theory, which are no longer strictly valid in this regime. To avoid such impediment, a next step would be to investigate the weakly nonlinear analysis of the system, with finite amplitudes, shortly after the deviation from linear instability. With such a study, we would be able to isolate the term responsible for the correction of the mean flow and derive a set of nonlinear equations to describe its dynamics (in the form of a modified Stuart–Landau equation). Building upon the seminal works on the nonlinear Poiseuille configuration (Stuart Reference Stuart1960; Stewartson & Stuart Reference Stewartson and Stuart1971), by means of a multiple scaling approach, we are confident that explicit results can be retrieved in our context.
Thus we claim here that our observations of the transition of the stratified Poiseuille flow via the generation of localized layers of turbulence (at least for the particular values of the Froude and Reynolds numbers that we explored) differ from the observations of Lucas et al. (Reference Lucas, Caulfield and Kerswell2019) in the case of the stratified Couette flow, and also from the classical transition scenario of the unstratified plane Poiseuille flow. One of the possible reasons for the discrepancy between the Lucas et al. (Reference Lucas, Caulfield and Kerswell2019) study and the present one may come from the (quasi-)impossibility for the stratified Couette flow to generate spontaneously a spatial modulation of the basic plane flow profile, which is the cornerstone of our present scenario of transition. Let us be precise here that the reason for this restriction comes from the different shapes in the parameter spaces of the linearly unstable domains of these shear flows. As a consequence, it is not possible, at the stage of our study, to explore the eventual connection (if any) between the observed linear flow pattern to already known nonlinear solutions of wall-bounded shear flow, as was done by Lucas et al. (Reference Lucas, Caulfield and Kerswell2019).
Acknowledgements
Centre de Calcul Intensif d'Aix-Marseille is acknowledged for granting access to its high-performance computing resources. This work was granted access to the HPC resources of IDRIS under the allocations 2022-A0120407543 and 2023-A0140407543 made by GENCI. U.H. thanks the Deutscher Akademischer Austauschdienst (DAAD), Germany, for support in the frame of the PROCOPE program (project no. 57560889). The authors would like to acknowledge Y. Duguet and L. Tuckerman for fruitful discussions and suggesting relevant references.
Funding
This work received support from the French government under the France 2030 investment plan, as part of the Initiative d'Excellence d'Aix-Marseille Université – A*MIDEX (AMX-19-IET-010).
Declaration of interests
The authors report no conflict of interest.