


Introduction
From the last third of the nineteenth century, in the space of a very few years, southeast Spain became the world’s leading lead producer. The output of the mines on Spain’s southeast coast displaced that of the United Kingdom and drove down prices on a global scale.Footnote 1 However, there were no relevant companies in the area that had the capacity to influence world markets by themselves. Moreover, this success was achieved with an extremely atomized productive model, which was highly labor-intensive with low capitalization in which the local companies coexisted during the final decades of the nineteenth century with the consolidation of lead giants such as the American ASARCO, the German American Metal and Hoboken (both controlled by the Metallgellschaft), the Australian Broken Hill, and the French Peñarroya. This latter company operated in Spain from 1881, but initially failed in its attempt to expand into this mining district,Footnote 2 although it went on to practically take complete control over it from the 1950s.
The mining activity in this district was spectacular and one of the most intensive in the world, giving rise to explosive demographic growth.Footnote 3 Furthermore, it monopolized practically all of the economic activities for decades, until the beginning of its decline from World War I. However, the sector was reactivated in the district, thanks to a change in the technological paradigm from the 1940s, based on differential flotation. Therefore, production and employment partially recovered and remained stable until 1992. This was most notable in the towns of La Unión and Cartagena, the most important centers of the mining district in the province of Murcia, on which our research is focused.
From these years, increasing capital-intensive investments began. At first, they were made by local entrepreneurs and then by the aforementioned multinational Peñarroya, which introduced open-pit mining on a massive scale and derived all of the production to what was then the largest mineral flotation plant in Europe. For four decades, this new production model coexisted with the traditional model, although it ended up taking over almost the whole territory, generating negative externalities for the environment, despite the lower profit margins of the establishment.
From a business history point of view, it is worth studying the surprising dominance of an archaic management model in the mining activity for a century and a half that coexisted in its final phase alongside another technologically modern one. The latter model was only feasible because it did not assume the environmental costs generated either internally or fiscally, enabling the continuance of an economic activity with enormous contradictions for current local development.
Mining pollution was not seen by nineteenth-century local mining entrepreneurs as a social or economic problem, as long as it did not affect the production process itself. In fact, certain environmental effects that reduced production were generically referred to as “Land wickedness” (El mal de la tierra). This expression has been used for the title of this article and summarizes not only the contemporary view of the environmental problems linked to the exploitation of mining resources but also the institutional factor that accompanies them and explains the significant environmental damage that was caused and has considerably hindered the development of alternative economic activities and social welfare to the present day.
However, in southeast Spain, mining pollution did not generate protests or an institutional response, except at the very beginning of mining and also when it was approaching closure due to the exhaustion of the seams, 140 years later. This was quite unlike other mining basins in Spain, such as Rio Tinto,Footnote 4 or others in the United States and the United Kingdom,Footnote 5 where there was a continuous social and legal response, albeit with little effect for the local population in the long term. In fact, some large mining companies generated defensive policies, including paternalistic social policies, massive land purchases, or self-interested tampering in scientific studies in order to reduce the negative effects of their activity in the public opinion.Footnote 6
It is striking that the long-term economic effects of mining pollution have received little attention in Spanish historiography, with the exception of the studies of Juan Diego Pérez Cebada.Footnote 7 He has focused more on the analysis of the economy of dependence and predator, defended by Jordi Nadal,Footnote 8 compared to other authors who have given a more positive view of the mining activity, such as Leandro Prados,Footnote 9 Pedro Fraile Balbín,Footnote 10 or Charles Harvey and Peter TaylorFootnote 11 (1987), who analyze the macroeconomic aspects of the mining activity, focusing on the importance of exports in mining for the equilibrium of Spain’s balance of trade. Relevant to our study are the reflections of Antonio Escudero,Footnote 12 who focuses his work on the traditional fiscal system in mining, finding that its excessive laxity constituted a significant opportunity cost for the Spanish economy, which could benefit very little from the revenue of the golden age of its mining industry. In fact, Rafael DobadoFootnote 13 found that the world’s largest mercury mine in history, in Almadén, was a highly profitable mine but had little impact on the past and present economic development of its surrounding district. Other examples on the coast of Almería, the Pyrite basin in Huelva, northern Córdoba, or Asturias confirm the lack of technological transfer of these mines, which is evident in the current decline of these areas, where industrial districts unrelated to the mining activity did not emerge. In addition, the majority of these mining districts inherited considerable environmental problems, and recent contributions paint a rather negative picture of the evolution of standards of living in the mining districts at their peak.Footnote 14
In short, throughout this article, we will analyze the elements that enabled two different business mining systems to survive simultaneously for 150 years in the same mining district, and the causes that led to the transformation and ultimate disappearance of both models at the end of the twentieth century. In both cases, the activity had a growing impact on the environment and very little spillover effects on other economic activities. So, we will emphasize how the historical inheritance, related to the productive and legal structure of the mining concessions, and the weak institutional environment conditioned the productive activities and led to a process of environmental degradation that has mortgaged the present and future socioeconomic possibilities of the whole territory affected by mining and a large adjacent area.
The Generation of an Intensive Model Based on Small-Scale Mines
The enactment of the mining law of 1825 was the starting point for the modern exploitation of mining resources in Spain, regulating the private exploitation of underground resources.Footnote 15 This legislation facilitated the enormous growth of mining production over the following decades. However, initially, the activity was developed with significant limitations. The main obstacles were the requirements to access a “mining concession.”Footnote 16 Until 1859, the size of these concessions was limited. This condemned the historical districts (those that initiated the exploitation) to develop their activity within a system based on very small-scale mines. In other words, they had to adapt their mining methods to the small area that was permitted.Footnote 17 Figure 1 shows the result of what we are referring to for the Sierra de Cartagena-La Unión. There is a central nucleus, resembling a dark stain, in which a high number of very small concessions were concentrated, which exploited the richest area until 1859. In the following decades, they continued to increase in number and size, but the new mines hardly produced mineral. We can observe this progression in the following figures: In 1850, the average area was 1.8 hectares (ha); in 1857 this had doubled (3.5 ha), increasing to 6.9 ha in 1880 and to 9.9 ha in 1913. In total, there were more than 1.200 concessions in the limited area of this small mountain range.
Evolution of the mining concessions in the Sierra de Cartagena-La Unión, 1850, 1859, 1880, and 1913.
Source: Own elaboration based on records of the Dirección General de Energía y Actividad Industrial y Minera in Murcia.
The problem did not only reside in the subdivision of the mines, but also in a series of elements that were structured around this ownership organization for extracting, concentrating, smelting, and marketing these resources. It is difficult to describe this reality, which was characterized not only by the aforementioned limited size of the mines but also by the structure of the companies that emerged around them. The concessions usually belonged to a company without capital that responded to its economic needs through the distribution of liabilities. When the mineral deposits had been located, the mine was usually leased to another company in exchange for a percentage of the mineral extracted (in this area, they were called partidarios). Sometimes, only part of the mine was leased. This meant that there could be more than one lessee in the small space of the concessions.
The Sierra de Cartagena-La Unión had abundant deposits of complex minerals, but they were low-grade ores. The content of lead was particularly noteworthy (principal mineral), but it was associated with silver, zinc, iron, and even copper. Therefore, the products extracted had to undergo a concentration process (to increase their ore grade) and were separated using gravimetric methods in this first period (later we will discuss the importance of these processes). The operations were usually carried out in their own installations or those of other mines. This gave rise to a certain relationship and dependency between the different companies in the sector. The next stage was smelting. In the case of the lead minerals, the principal mining products until the end of the nineteenth century, the ore beneficiation was carried out in parallel with the primary metallurgical industry that emerged in these districts. Given the small size of the concessions (even taking into account those that were richer in resources), it was difficult to obtain an output sufficient to supply one of these establishments continuously. Therefore, although there were people and companies engaged in the metallurgical industry who may have been interested in extraction, their activity was clearly differentiated and sometimes had a conflictive relationship with those who obtained the products from the ground.Footnote 18 Unlike the concessions, the metallurgical companies were not limited in size legally, and they enjoyed certain economies of scale, mostly related to the technological improvements that were emerging throughout the nineteenth century. As we can see in Graph 1, there was a progressive increase in the power installed in the mines, although mining entrepreneurs had the advantage of a very cheap labor market due to the very low development of alternative economic activities in the area.
Evolution of the number of workers and the power installed in the mines of the mining district of Murcia.
Source: Estadística Minera y Metalúrgica de España (hereafter EMME).
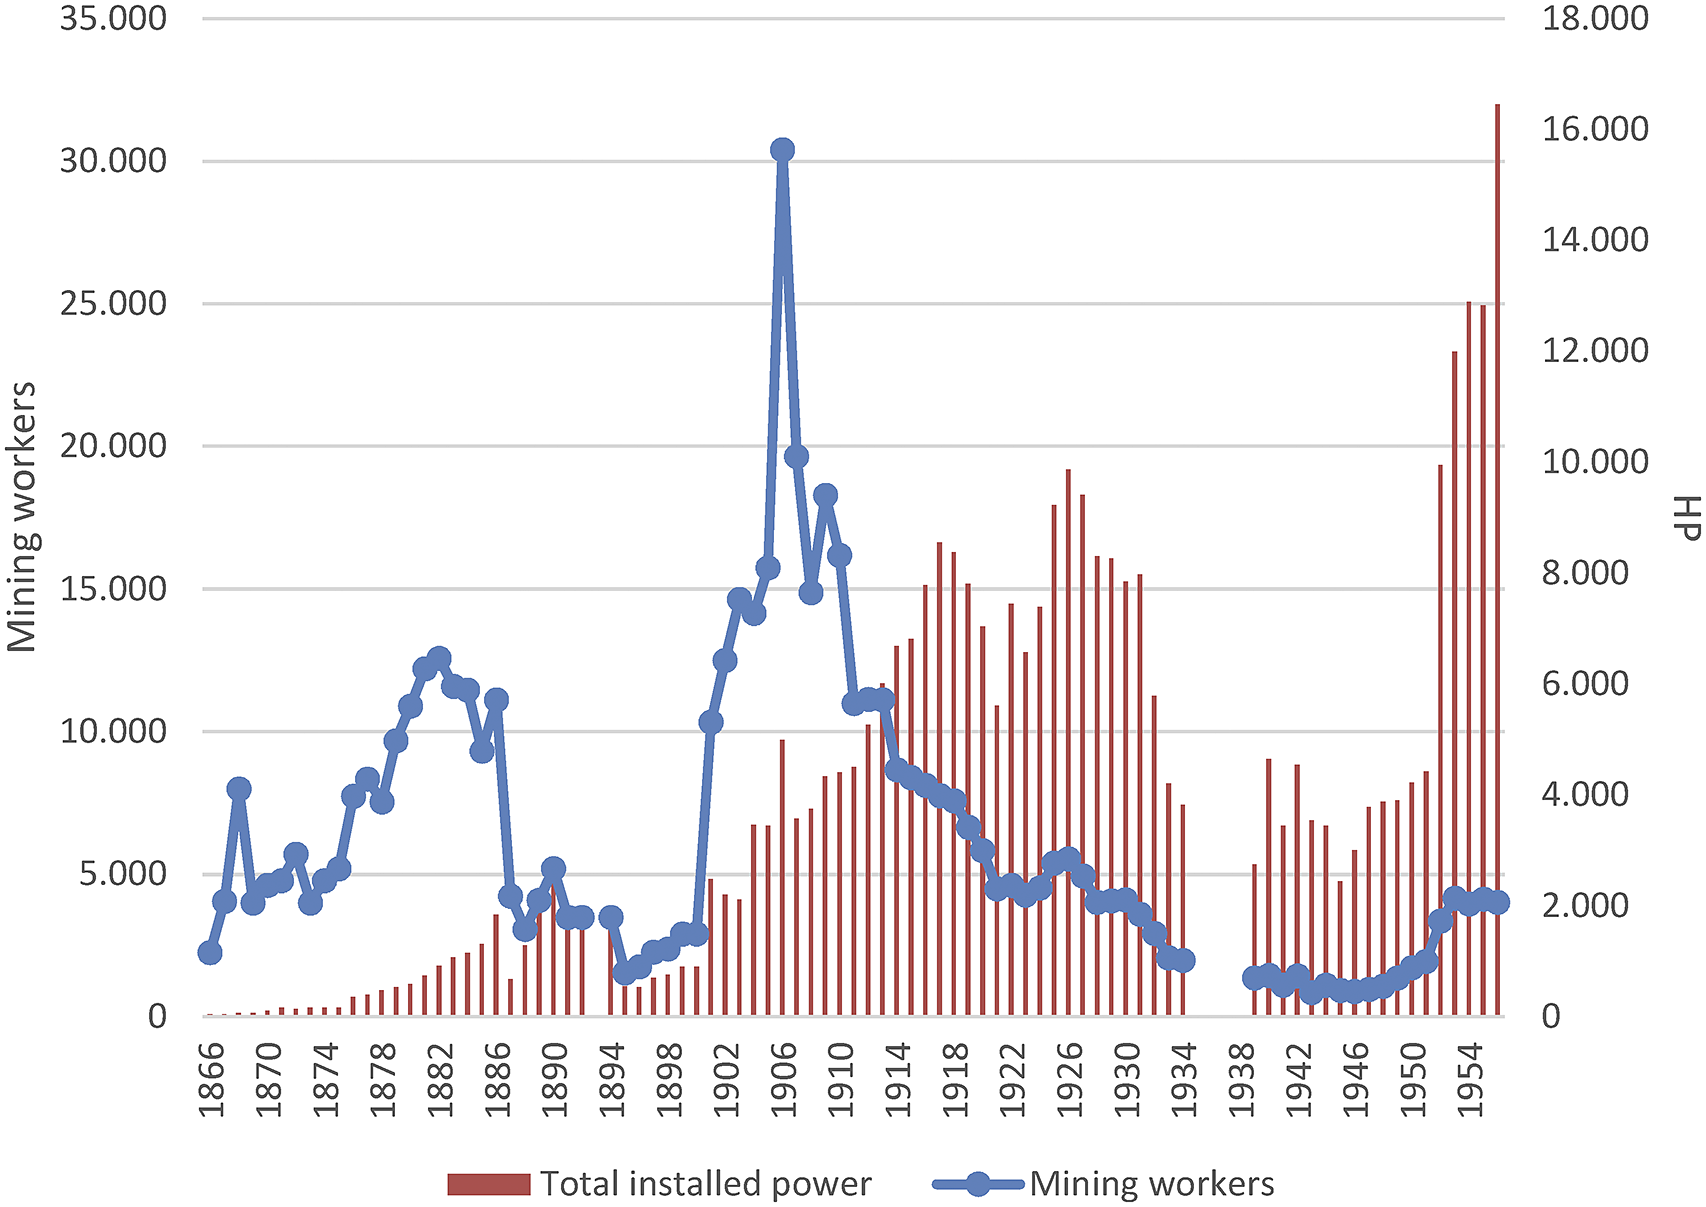
This should have been manifested in a trend of progressive concentration, which was low in these decades (see Graph 3), but instead we can observe the continuity of a high dispersion in the sector.Footnote 19 This is due to the mining model that we seek to analyze in this basin; a series of institutional conditioning factors were developed that determined or limited the decision-making of the actors in this industry.
Other important factors were the transport and sales structures. The movement of the minerals and metals was important because of the high cost of transporting the products. This basin had the advantage of being close to the coast, which enabled it to use maritime transport (which was the most economical) from the outset for shipping its articles and supplying itself with raw materials and fuel. However, this was not sufficient, and other transport infrastructures had to be installed, principally roads, overhead cables, and a railway that connected the mountain range with the port of Cartagena. Initiatives were also carried out in maritime transport, such as the case of the Zapata Steam Shipping Company Limited. Commercialization also included accessing markets in which a series of different actors had advantages and participated in controlling the flow of zinc, lead, or silver. These relations became closer as the second half of the nineteenth century progressed.
The panorama was completed with the financial structures that were simultaneously developed. Although the investment needs were low, given the intensive structure in terms of labor and the economical technical requirements, they were relevant for the operating of the business. On the one hand, the mining activity was attractive because of both the high profits that could be gained in certain deposits and the characteristics of the metals extracted from this basin, particularly silver (especially during the period when it was a monetary standard). On the other hand, despite its austerity, the mining economy needed liquidity for the operations carried out by companies that had no capital. Finance also constituted a fundamental means to ensure the supply of the mineral (through advance payments to the miners) and obtain a certain level of influence and power in a business that depended on these monetary contributions. Furthermore, these financial elements mostly participated in mining-metallurgical initiatives. This was the case for Hilarión Roux, who started his career as an agent for Rothschild, or the Figueroa family, who had foundries in Marseille, Linares, and Cartagena and whose activity gave rise to the creation of the Banco Cartagena.Footnote 20
Independent of the early participation of foreign investors, the mining industry in the Sierra de Cartagena-La Unión was dominated by national companies and, more specifically, local firms. They were undercapitalized and speculative companies, which hoped to find the mineral seam in order to assign the exploitation to another company in exchange for a percentage (by way of rent). The proliferation of this type of company in the ownership of the subsoil and the confusing legal framework within which they operated led to the enactment of the special mining companies’ law in 1859, which sought to control and regulate their activity. The shareholders of these companies, which were in the hundreds, were mostly national capital owners from different origins. In order to access these resources, it was necessary to meet the conditions imposed by these companies, which owned the majority of the productive subsoil in this area.
It was a complex sector in which there were high transaction costs, particularly for those who were not among the elite levels of the business and did not have the same capacity of influence. The conditions to which this industry was subject were determined not only by the specific framework of the mining business, which we have superficially analyzed, but also, and more importantly, by the conditions that prevailed in Spanish society during the nineteenth century and the beginning of the twentieth century. The French traveller Casimir DelamarreFootnote 21 explains this when he describes the situation of the neighboring mining districts of Almería, indicating the lack of equality and authority that existed, which was manifested in the influence of the potentates, who, according to Delamarre, “interfered in the justice system, customs operations and jobs.” For the case of Almería, he indicated that it was subject to the whims of a small number of individuals who, because of their wealth and relations with Madrid, were the true owners of the country. This situation of legal limbo was also evident in the 1901 reports of Crédit Lyonnais for the mining district of Murcia,Footnote 22 which referred to the high level of fraud that existed in the Sierra de Cartagena-La Unión. They even claimed that there was no honesty or any morals in the transactions that were carried out in the mining and metallurgical industries in this basin.Footnote 23
We can observe that the productive activity was mediated by specific institutional structures, which had arisen both from the framework in which the extraction had to be developed and from the national and local sociopolitical conditions in Spain at that time. This did not make the mining activity in this basin any less dynamic, and it was among the world’s leading lead producers. The technical progress included the atmospheric furnace, which, in 1846, enabled lead carbonates to be exploited: the improvement of gravimetric concentration technology. Furthermore, this district was one of the first areas to introduce electrical energy (adapting better to the extreme division of the extraction). In short, these advances led to profitability gains for complex minerals with a low metallic content extracted from the deposits of the Sierra de Cartagena-La Unión, enabling the generation of a notable economic activity in the surrounding area other than the mines and foundries, with companies springing up around the mining sector. For example, in La Unión, in 1890, the Maquinista de Levante was established, with workshops for the manufacture of boilers and steam engines, mechanical masts, ore-roasting kilns, presses, windmills, and centrifugal or piston pumps, among other machinery for the mining activity; in 1905, the Unión Española de Explosivos constructed a plant to manufacture chemical products for fertilizers in Cartagena in order to make use of the pyrites of the Sierra; finally, there were six explosives factories in the area to supply the mines.
However, the specific organization of the mining activity gave rise to very high social costs. In order to maintain competitiveness in the minerals market with an ever-increasing rivalry, it was necessary to apply pressure to the price of labor, the largest outlay of the mining companies. The living and working conditions were deplorable. Different studies have described the high overall and child mortality rates; the high accident rate; the percentage of child labor (the highest in Spain, with rates that reached 30 percent and 40 percent of the total workforce used in these mines, according to the official statistics); the low height of the population; the low cultural level; the low wages; the deficiencies of the workers’ homes; the deficient urban infrastructures related to healthcare; the insufficient sanitary facilities; etc.Footnote 24 This situation prevailed because of the economic difficulties in southeast Spain, particularly the severe situation in the neighboring province of Almería, from where a large part of the labor used in the mines of Murcia originated.Footnote 25 Mining was an escape valve for the poor economic situation experienced in some districts in southern Spain.
Given the composition of these ores and the forms of extraction and processing that existed at the time, the mining activity had many dangers. The ores extracted were of a low grade, which reduced direct pollution in the mining operations. In this early period, until the introduction of mechanical means of extraction at the beginning of the twentieth century, it seems there was not a high incidence of silicosis. Almost all of the minerals had to be concentrated, for which gravimetric methods were used, which consumed a large amount of water and produced contaminated sludge. These residues were dumped directly in the surroundings of the washing places. We have found some occasional complaints from farmers about turbid waters from these establishments that dragged lands and flooded their fields when they were thrown into the dry riverbeds of the streams. However, we have not located any local or state measure that sought to regulate these activities in the nineteenth century. In 1900, a royal decree was enacted on the clouding of public waters due to the washing of minerals caused by the conflicts in the mines of northern Spain (specifically Vizcaya and Santander).Footnote 26 This legislation expressly prohibited the discharge of turbid water into streams, rivers, estuaries, and bays. However, in the Cartagena-La Unión mountain range, there are no rivers, but there are dry riverbeds (which are only filled when it rains heavily), so the impact was different from that in the north of Spain. In addition, the preponderance of the mining activity in this area, and the influence that the bussinesspeople in this sector had over local and provincial institutions, acted as a brake against possible claims about these discharges. The result was the accumulation over decades of large amounts of conta tailings without any treatment.Footnote 27
Most of the ores were also used for initial metallurgy. It should be noted that lead, the principal metal in these ores, can be smelted relatively easily because of its low melting point (just over 300ºC). Murcia quickly became the main metallurgical center for lead in Spain, and the number of smelting establishments around the Sierra multiplied (there were more than one hundred in operation). Fumes from the furnaces provoked a quick reaction from the population. In 1845, we have found in the minutes of the city council of Cartagena a first complaint about the effects of these fumes on vegetation, animals, and people,Footnote 28 for which an increase in the height of the chimneys was requested. In 1847, the controversy was rekindled, and the subject of the fumes was addressed in several sessions of the city council.Footnote 29 Representatives of certain neighborhoods pointed out that the municipality was an entity that should protect the well-being of its inhabitants and demand compensation. In contrast, a petition signed by foundry workers points out that the fumes were not harmful and that compensation would mean the loss of their jobs, which saved them from misery. The commission appointed by the town council, meanwhile, admitted that there were some effects on the animals, but pointed out that this could have been due to what they called “soil sickness,” which also affected other places far from the smelters.Footnote 30 That year’s municipal sessions concluded with debates on who was the competent authority to settle this matter. Surprisingly, in 1848, a royal order was promulgated that obliged the foundries to maintain a minimum distance from the towns and to install condensation chambers. This was an exceptional measure in the metallurgical panorama of the time. We have not found a precedent in other countries; we had to wait until the second half of the nineteenth century to find similar measures of specific installations in foundries to mitigate the effects of fumes.Footnote 31 The explanation for this forceful legislation seems to lie in the precedent of other mining areas in Spain, especially in the province of Almeria (bordering Murcia), where the intense exploitation of lead ores in the 1820s and 1830s caused significant effects on the population, with a high incidence of saturnism (lead poisoning).Footnote 32 In 1843, the politician and jurist Alejandro Oliván, who held various positions in the Spanish administration, denounced the effects of lead smelting fumes, calling for the application of technical procedures to mitigate their emission.Footnote 33 It is possible that his writings had some bearing on the rapid enactment of this early environmental legislation.
The intense legislative and advocacy activity with respect to lead smelter fumes in the 1840s contrasts with what happened in the following decades, in which we hardly find any news on this issue despite the great increase in the mining and metallurgical activities. Condensation chamber legislation had a limited effect at first, and in 1863, a new royal order indicated the term of one year for the foundries to install these chambers.
Finally, the production framework that could be developed was restricted, taking into account the specific organization of mining in this area. Even though there was a certain level of dynamism and capacity of adaptation, there were certain limits for the sector to continue advancing and to implement the new technologies. Steps had been made toward concentrating the sector in the hands of certain figures and companies that dominated the mining scene.Footnote 34 However, although the mining elite owned important concessions, this was not enough to reorganize the mining industry of this basin or change the way in which business was done. On the one hand, the attempts of the large companies to penetrate and control this mining industry initially clashed with this complex structure of ownership and the rules of the game in this area, leading to failures at the end of the nineteenth century. This was the case of SMM Peñarroya in 1885 and Cie Dááguilas from 1886, which ended in absolute failure. The former had to abandon the area, and the latter had to reduce its social capital by half after an attempt to invest 50 million francs in the mining district.Footnote 35
Crisis and Transformation of the Mining Sector, 1914–1946
The traditional mining model began to enter into crisis in the district of La Unión at the end of the nineteenth century, and its definitive decline came with the beginning of World War I. In fact, the record level of production of the district in 1913, when officially 56,721 tonnes of melted lead, 63,660 tonnes of zinc blends and calamines, and 410,000 tonnes of iron pyrites were shipped from the ports of Cartagena and Portmán, seemed like an illusion, which gave way to a long and deep depression in the mining district.Footnote 36 At that moment, the overexploitation and the lowering of the metallic tenors in the seams affected the profitability of many establishments that were destined to close. On the other hand, the beginning of World War I caused exports to plummet because of the complete halt in international money orders as a result of the English and French bank moratoriums and the progressive depreciation of foreign securities that prevented the collection of sales, leading the sector to an unprecedented crisis. Production was reduced by half, and the price of lead fell by 17 percent, causing the closure of half of the active pits. On the other hand, the lack of coal, among other resources supplied by the mining activity, became particularly dramatic as the years passed, which obliged restrictions on its use to be imposed. An official order of August 20, 1918, led to extreme cuts in electricity consumption in Cartagena and La Unión, suspending the service for any use, including mines and factories. By the end of the war, only three lead foundries were still operating in the Sierra, as opposed to the twenty-two that had operated in 1900.Footnote 37
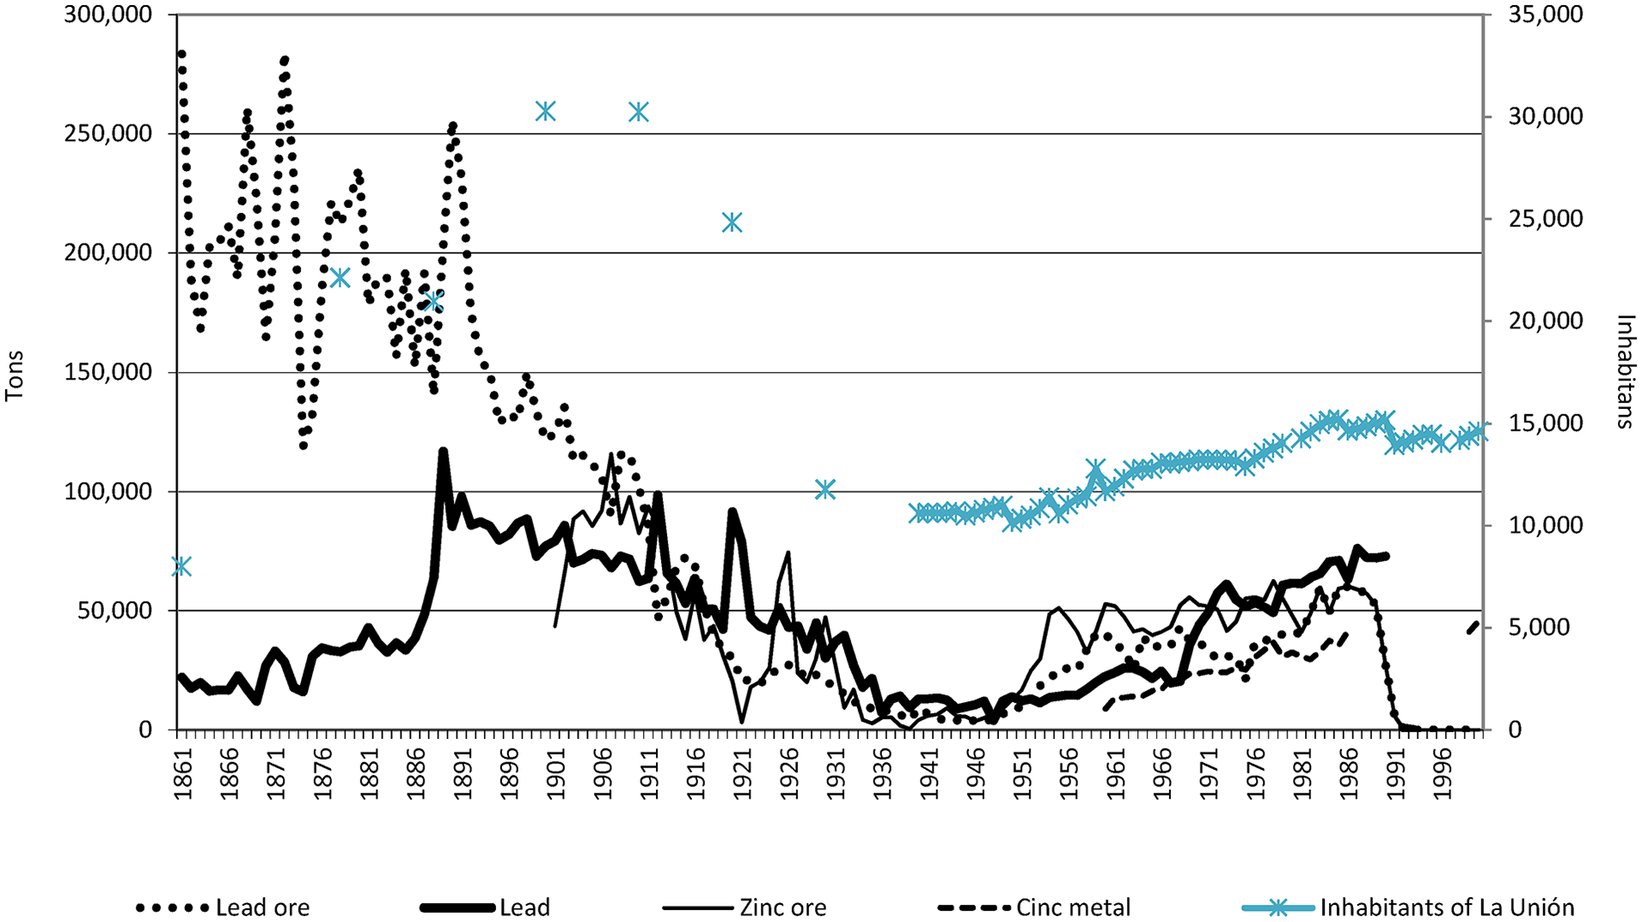
As a result, during these years, the mining districts lost more than half of their population because of the mass emigration of the miners. In La Unión, the phenomenon was dramatic. According to the census of 1910, there were 30,249 inhabitants, which fell to 24,837 in 1920 and to just 11,776 in 1930, in parallel with the decline of the mining production (see Graph 2).
Evolution of the mining and metallurgical production in the province of Murcia and the population of the municipality of La Unión 1861–2000.
Source: EMME and Municipal Archives of La Unión.
The crisis in the mining sector obliged the companies to adopt new strategies and the state to play an increasingly interventionist role. Initially, and before the end of the war, the government sponsored the creation of a mixed mine owners and smelters commission in Cartagena, through which joint decisions could be made regarding the purchase prices of the mineral and the export conditions. It was even granted special public financing, which at least prevented the mass closure of mines and was enough to withstand the overall recovery of prices between 1925 and 1927. Responding to pressure from the mining entrepreneurs, led by the former ministers Yanguas and Maestre, the latter being one of the principal entrepreneurs in the Sierra de Cartagena-La Unión, the government announced a rescue plan for the mining industry. It enabled the mines to develop their means of extracting and processing the ores in cooperative foundries, to purchase or construct. It also mandated a control of prices and the centralization of stocks and the distribution of output. The only compensation was that national industry was obliged to consume all of these products, which were necessarily more expensive than those offered on the international market.Footnote 38
However, public interventionism could not stop the decline of Murcia’s mining sector that, in just a decade, fell from its position as Spain’s second most important mining district in terms of value of production at the beginning of the 1920s, to eleventh place in 1933 with a total value of its mining and metallurgical production of just 35,937,638 pesetas (31,764,432 in the smelting factories and only 4,173,206 in mining) compared to the more than 200 million of Barcelona, Oviedo, and Vizcaya. The two remaining lead foundries employed just 457 workers and the 47 mines operating throughout the province employed 2,169 workers, approximately half in Cartagena and La Unión and largely thanks to public support. After the Civil War in 1940, this figure stood at 1,451 workers, falling to a minimum level in 1943, with just 855 in the whole mining district.Footnote 39
The Arrival of the Large-Scale Mining Industry
The Change of the Technological Paradigm
Amidst this debacle, the rebirth of the mining industry of La Unión was the result of a specific technological development: the differential or froth flotation system that, using simple technology based on the use of chemical reagents, was able to recover minerals from very low-grade ores from mines and old heaps. This technology had been used in Broken Hill since 1902, but in Murcia, the same gravimetric washers were still being used that had operated from the mid-nineteenth century until after the Civil War.
In 1929, the government attempted to promote the testing of this technology, which was being used in other Spanish mining basins, through a tender won by the chief engineer of the Sociedad Minero y Metalúrgica Zapata Portmán, Juan Rubio de la Torre. His work gave rise to the first differential flotation washer in the district in 1935 (in the Regente-Concilio mine), with a capacity to process 150 tonnes per day of mixed zinc blende and galena ores. However, the Civil War paralyzed the project, which could not be implemented until 1940. The initiative of the Zapata-Portmán company was soon followed by two small washing plants (Enrique Carrión and the “Coto Azul”) and many more after 1950, until a total of thirty-six had implemented the technology in 1955. The froth flotation plants constituted a profitable alternative to the traditional mining industry and lengthened the life of many mines in operation and, most of all, enabled the use of the lead and zinc contained in the slag heaps and mineral ponds that had been washed by simple gravimetry. The technology was relatively simple and did not require substantial investment, enabling the emergence of small and medium-sized firms that were not required to have any mining rights. In fact, the average capacity of the washing plants did not exceed 200 tonnes per day and many operated with a dozen workers.Footnote 40
A Prominent Local Initiative: Francisco Celdrán
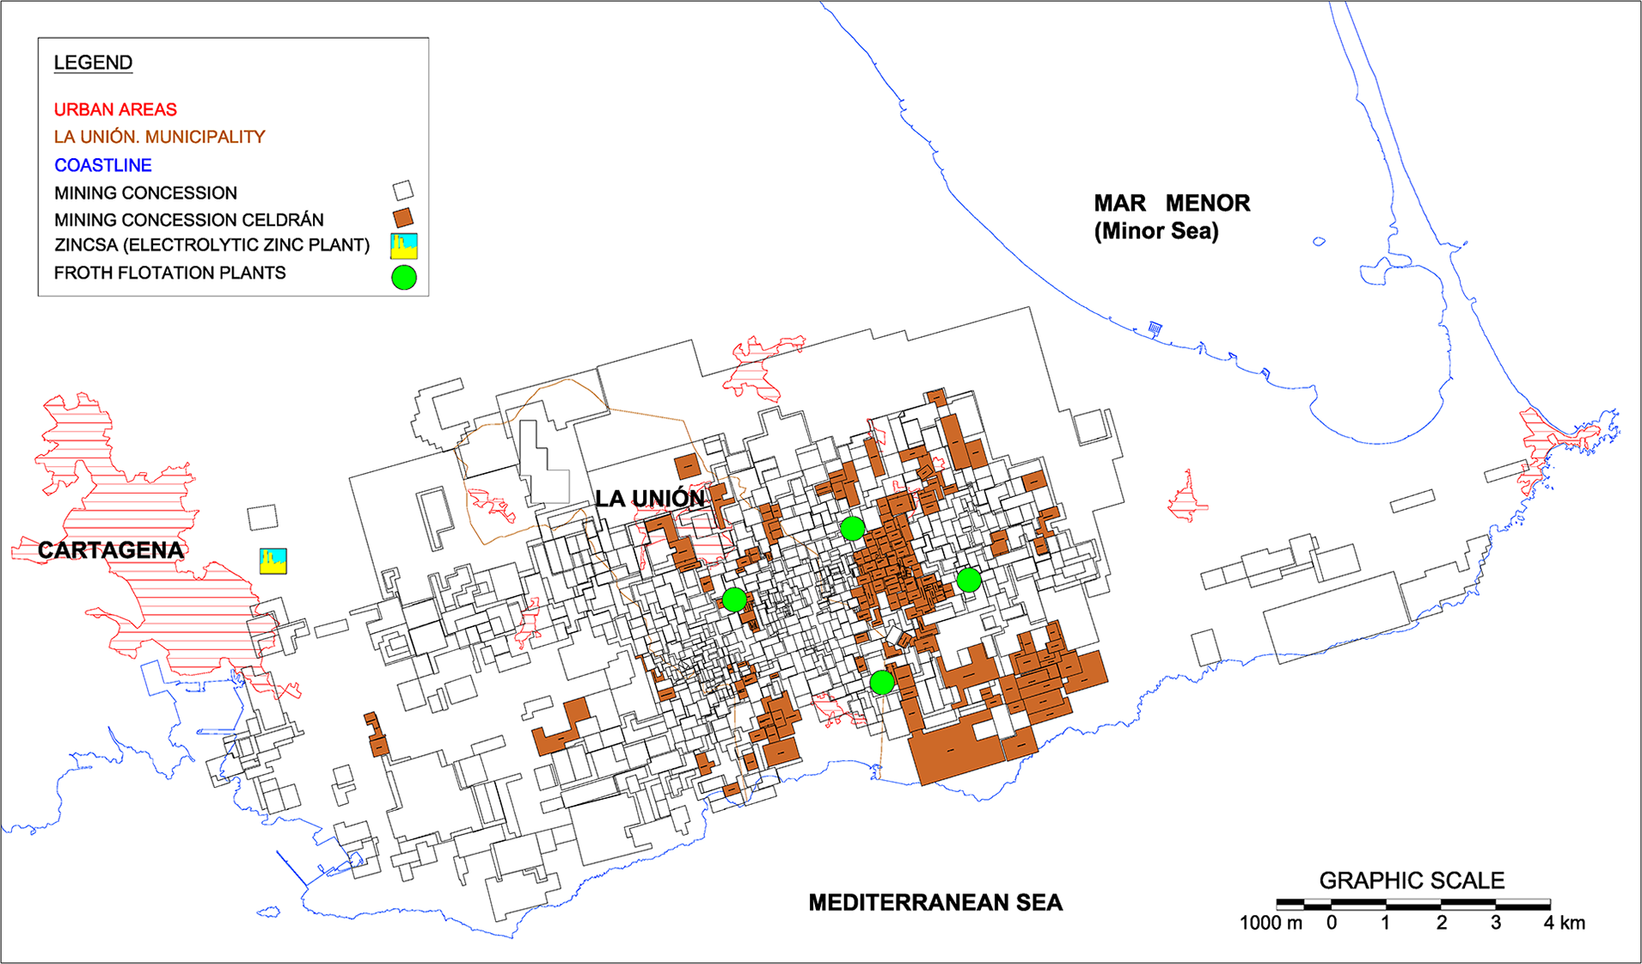
Of all the mine entrepreneurs who were committed to the technological change, its strongest supporter was a practically unknown Businessperson named Francisco Celdrán. Between 1947 and 1952, he constructed five differential flotation plants in different locations in the Sierra, starting with a small family-run mine, which allowed him, from the 1950s, to eventually become the largest producer in the area. Specifically, in 1951, his company, Minera Celdrán, produced 3,469 tonnes of lead concentrate (60 percent of metal lead) of a total of 9,498 tonnes in Murcia. His “Brunita” flotation plant was able to produce 3,570 of the 16,462 tonnes of zinc concentrate produced in the Murcia district. However, Celdrán’s success did not reside in the establishment of these installations, but in resolving the problem of the system based on small-scale mines, with the constitution of the first large-sized mining sites, based on the purchase and leasing of installations in disuse and integrating this production with his flotation plants and a modern electrolytic foundry. This allowed him to carry out his production process on a larger scaleFootnote 41 (see Figure 2).
Mining concessions controlled in the Sierra de Cartagena-La Unión by Minera Celdrán in the early 1960s.
Source: Own elaboration based on original documentation of Minera Celdrán. Personal archive of Javier Celdrán.
Note: The Brunita flotation plant does not appear, as it was transferred to Eloy Celdrán in 1951.
The smelting project was implemented later and emerged in response to the high cost of shipping zinc blende exports from the Sierra and the futility of smelting it in Italy or Algeria, when the local ore production was sufficient to supply and amortize a zinc foundry in the city of Cartagena. This was even more the case if an electrolyte zinc plant was used, which would enable highly pure metals and subproducts with a high industrial value to be obtained, such as the sulphur contained in the ores and metals like lead and cadmium, which were considered impurities. In his project, Celdrán incorporated the Basque entrepreneurs Ramón Churruca Arellano and José Lipperheide Henke and, chiefly, the Banco Central, which contributed the financial support to invest around 300 million pesetas in three years. Together, they constituted the limited liability company Española del Zinc, S.A. (ZINCSA) on April 28, 1956, with a social capital of 150 million pesetas, with each of the three groups contributing a third of this amount. The foundry began operating in 1960 with a production capacity of 20,000 tonnes per year of electrolytic zinc, with good prospects. The capital was increased quickly to four hundred and 50 million pesetas to extend the plant, which exceeded a production of 45,000 tonnes per year in all of its lines, obliging it to increase imports from Ireland, Morocco, and other national markets.
In short, from 1960, Francisco Celdrán had integrated practically all of his productive process, from basic mining to smelting, with a workforce of over 1,800 workers. However, the corporation enjoyed stability for only three years. At this point, the Conesa partners in ZINCSA proposed forming their own mining group to produce blende and legally integrate Minera Celdrán. However, Celdrán refused, which generated a confrontation with the Banco Central, culminating in the closure of the line of credit from the bank to the mining company, which, highly indebted, was obliged to sell a good part of its assets. From then on, Celdrán’s mining business ran into difficulties, and from 1966 it began to make losses, even though it had closed all of the company’s flotation plants in order to concentrate on the biggest, the Segunda Paz. This plant extracted the final output of underground mining, and the decision to close the mines was made in 1968, when there were still 150 miners working there, and all efforts were concentrated exclusively on the flotation process of minerals provided by Peñarroya.Footnote 42
The Arrival of Peñarroya
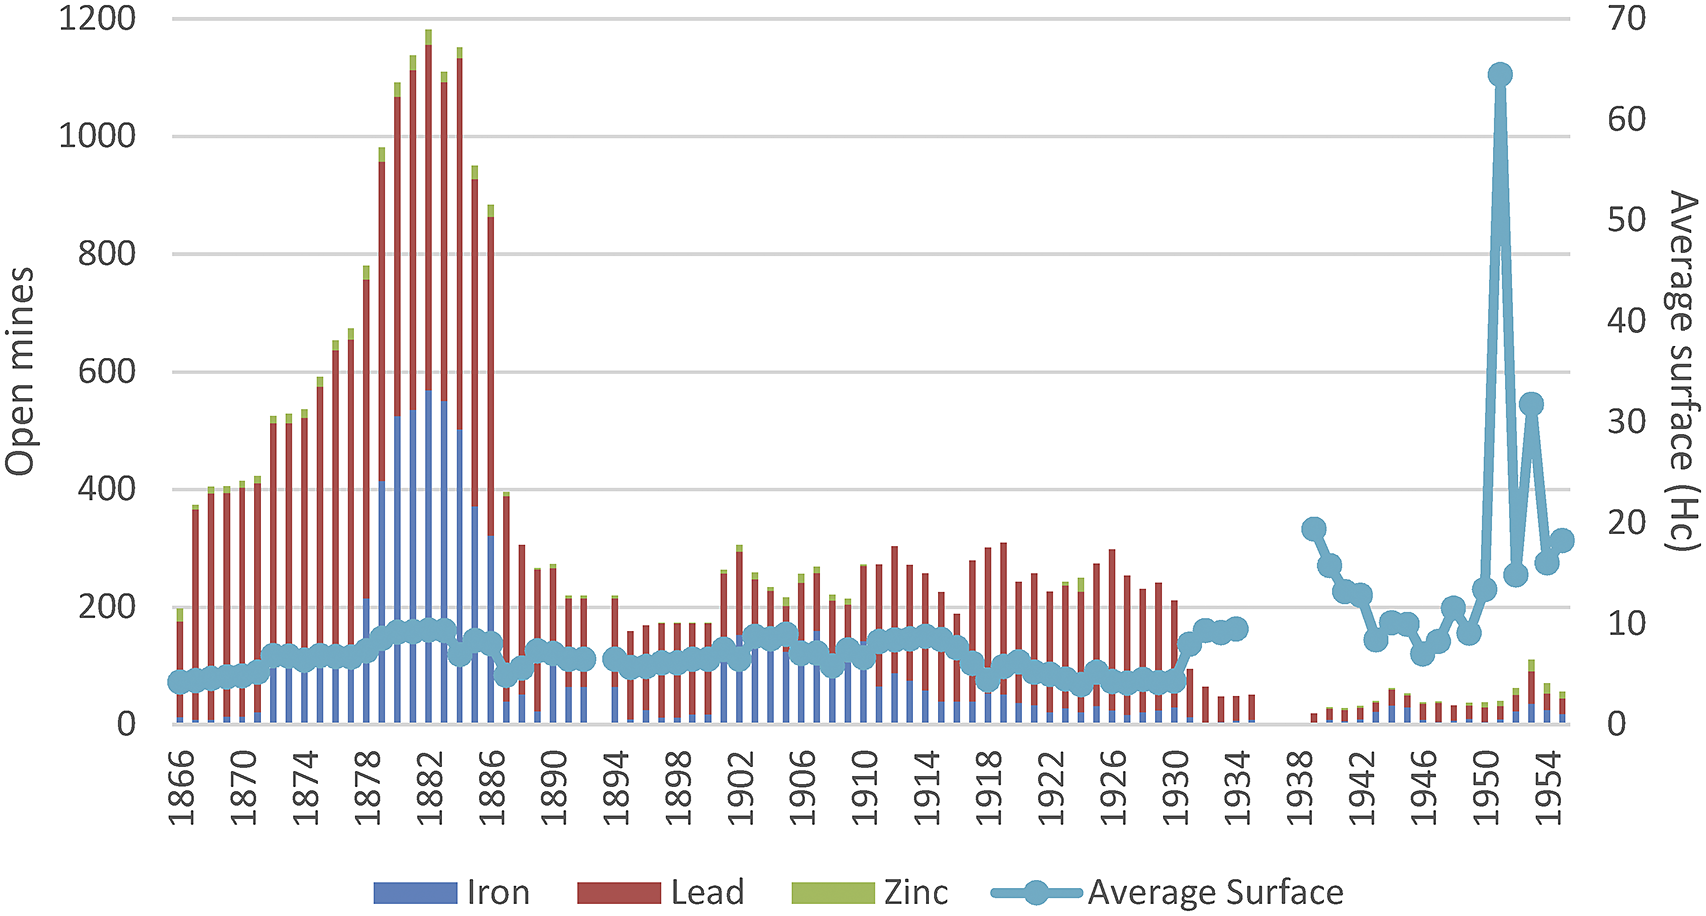
The entrance of Celdrán and other medium-sized producers, such as Domingo Giménez, Eloy Celdrán, Minas de Cartes, or Minera Navidad, changed the productive scenario of the local mining industry, which was witnessing a clear reduction in the number of operating mines, a significant expansion of their average surface area (see Graph 3), and an increase in the use of energy, which tripled (Graph 1). However, the great transformation came with the arrival of a foreign company: Peñarroya.
Evolution of the number of active metal mines and their average surface area in the mining district of Murcia, 1866–1955.
Source: Calculated from EMME.
The French multinational Peñarroya was certainly not unknown in the district. In fact, for half a century it had been one of the principal producers and concessionaires of the area, having absorbed the Sociedad Escombreras Bleyberg in 1912 and the assets of the Figueroa family in 1913. This had given it access to many concessions in Cartagena and Mazarrón and two lead and silver foundries in Cartagena, those of San Isidoro and Santa Lucía and other installations in Belgium and France.Footnote 43 These were the years of Peñarroya’s great international expansion, and in 1914 it was ephemerally the world’s leading lead producer (118,017 tm.). After that, in the following decades, it was the largest producer in Europe. Two decades later, it rescued the largest local company, the Mancomunidad Zapata Portmán, with which it formed the Sociedad Minero Metalúrgica Zapata Portmán (SMMZP) in 1930, controlling 50 percent, based on the mining-industrial equity that Miguel Zapata had consolidated and that had been inherited by his son-in-law, José Maestre. It included the La Constancia foundry in Portmán, the Maquinista de Levante workshops, and many mining concessions in the Cartagena-La Unión area.
The French multinational, however, did not decide to invest in Murcia and allowed the SMMZP to operate relatively independently over the following fifteen years, until 1947, when it acquired the whole of the company. Only from then did the multinational resume its interest in the La Unión Sierra and dusted off the many technical projects that its engineers had prepared thirty years before in order to resume the activities of the open mines and the large flotation plants and ended up monopolizing the mining district of Murcia.
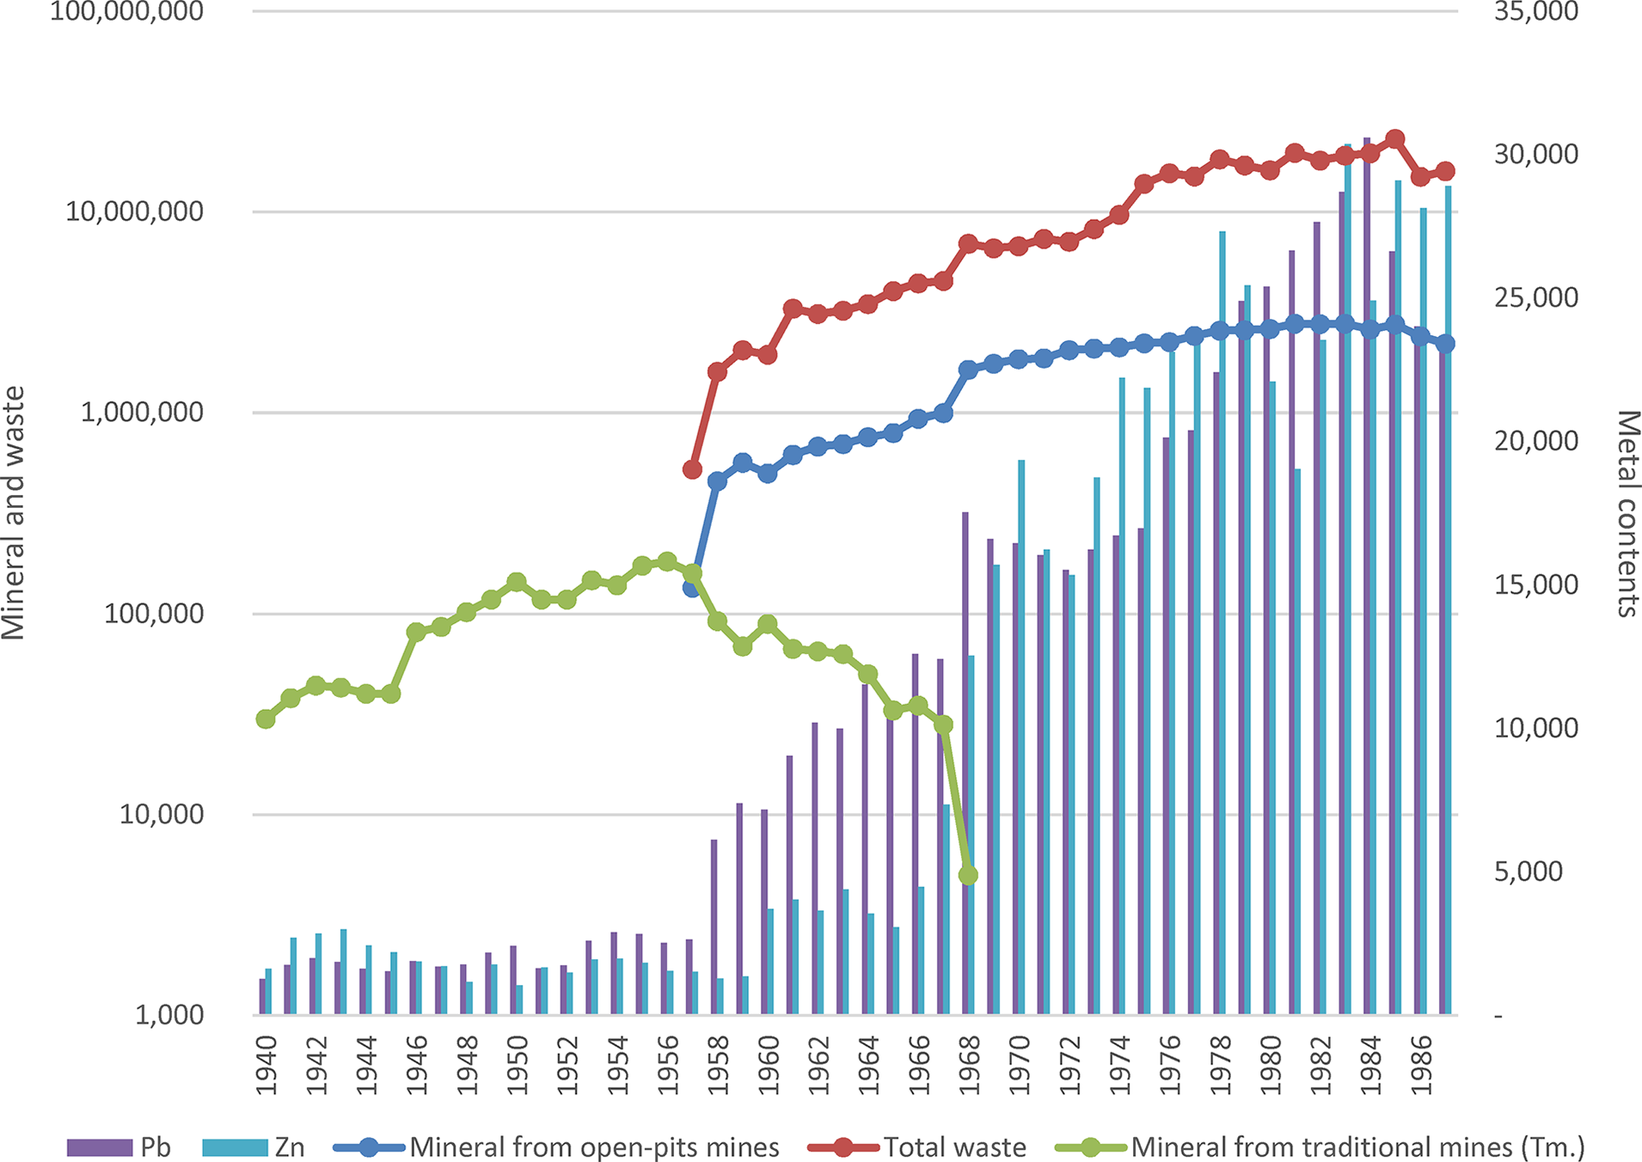
As a result, from the mid-1950s, Peñarroya had acquired enough surface area in order to initiate the earth moving processes, progressively abandoning underground mining (See figure 3). In 1953, the modern open-pit mining began with the beginning of the clearing of the Emilia open-pit, for which HGVs and bulldozers, never seen before in the Sierras of Murcia, were introduced. This open pit was followed by the Gloria (1966), San Valentín (1966), Los Blancos (1971), de Tomasa (1973), San José (1973), and Brunita (1980) quarries. The mining capacity grew exponentially over the years, and the traditional system of shafts and galleries of the underground mines was gradually eliminated and completely abandoned by the company in 1968 (see Graph 4). These types of mines were leased to third parties, as they no longer formed part of its operations.
Mining concessions controlled in the Sierra de Cartagena-La Unión by Peñarroya in 1969.
Source: Own elaboration based on Lanzarotes’s 1907 Map and Peñarroya archives in Peñarroya IGME offices.
Evolution of open-pit mining by Peñarroya in the Sierra de Cartagena-La Unión and final metal production, 1940–1988, in tonnes.
Source: SMM Peñarroya España, Las explotaciones de plomo y cinc en la Sierra de Cartagena and Libro del centenario; and Archivo General de la Región de Murcia (hereafter AGRM) CARM, 42163/2.
The technological transformation was completed with the construction of a large-scale mineral flotation plant in the bay of Portmán, called “Roberto” in honor of the French engineer who designed the project. Over the next three decades, the low-grade ores that were collected en masse from the whole of the Sierra were sent to this plant. Once they had been separated into metallic concentrates, they were sent directly to Santa Lucía, where lead and silver were separated, and to ZINCSA for the extraction of zinc.
The principal novelty of the Roberto flotation plant, constructed on the site of the former La Orcelitana foundry, was its size, with respect to the previously mentioned plants. In 1953, it began to carry out trial production runs of a modest 300 tm per day. In view of its satisfactory evolution, this was increased in 1956 to a capacity of 2,100 t/day, in 1970 to 6,000–7,000 t/day, and, finally, in 1978 to 8,000 tm/day of ores containing mainly lead, zinc, silver, iron, and sulphur (SMMPE, 1970 and 1985). The flotation plant was perfectly connected with the quarries, fed by the Emilia mine via a 1,900-meter-long underground electrical railway, which carried the ore directly to the Portmán crusher and, from there, to the flotation plant.
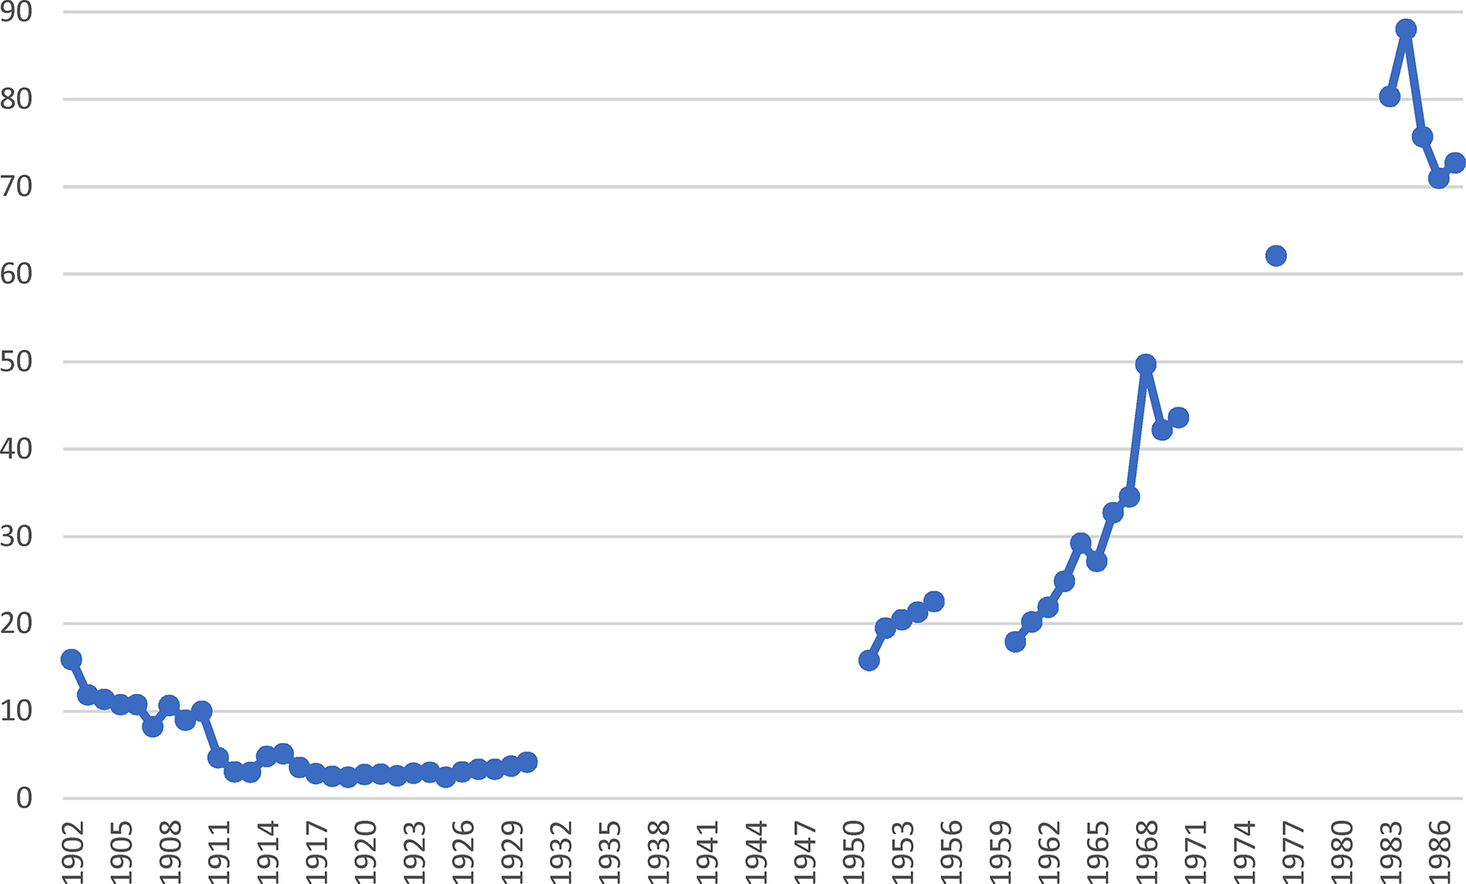
The result of the process was an exponential increase in production, the expansion of the mining activity, and the productivity per worker. The latter was significantly different from that of traditional mining. At the beginning of the twentieth century, after half a century of mining experience in the district with a relatively high richness of the minerals, average productivities of over 10 tm of lead concentrate were obtained per worker per year, which then dropped to barely 3 tonnes. Peñarroya increased the productivity of its workforce, reaching a maximum in 1984 of 88 tm per worker, 29.5 times more than the average productivity of the workers of the mining district as a whole in the 1920s (see Graph 5).
Evolution of productivity in the mining district of Murcia (1902–1930) and the Peñarroya mines in the Sierra de Cartagena-La Unión, 1950–1988 (tonnes of concentrated lead per worker/year).
Source: Calculatio based on EMME, 1902–1930; SMM Peñarroya España, Las explotaciones de plomo y cinc en la Sierra de Cartagena; AGRM CARM, 42163/2 and MIN 51619, 45456/1, 45457, and 768/9.
The productivity per worker of the rest of the mines in the district, although improving slightly in the 1960s, did not reach the levels of Peñarroya. In 1971, when Peñarroya was producing around 40 tm of lead and zinc concentrate per worker per year, the average of other companies was between 12 and 18 tm.Footnote 44
It is important to highlight that, throughout these decades of consolidation and the near monopoly of Peñarroya in the Sierra de Cartagena-La Unión, these family-run mines continued operating in parallel, mostly exploiting slag heaps and mineral ponds with very few still engaged in underground mining. In 1970, Peñarroya accounted for 65.5 percent of the lead and zinc production in the Sierra de Cartagena-La Unión, much higher than the 17 remaining producers.Footnote 45 Of these, only eight produced their own ore, but only one of these (Minera Navidad) did so with an open-pit mine and the rest with the traditional system of shafts and galleries (Minera Celdrán, Eloy Celdrán, Minas de Cartes, Domingo Giménez, ZINCSA, Minerales la Unión, and Andrés Moreno). Significantly, their differential flotation plants had a joint daily potential capacity of 5,450 tm of ore,Footnote 46 but it seemed that they were unable to develop it fully in the same way as Peñarroya and its Roberto flotation plant.
In fact, the continuous fall in real lead prices from the end of the 1940s, which lasted for three decades, posed severe difficulties for many flotation plants and mines, which hardly extracted anything from the old residues, so the phenomenon of concentration spread. The majority of them disappeared because of the exhaustion of their resources or were overpowered by the French multinational, which technically concentrated its activities in 1976 and 1983,Footnote 47 with the incorporation of the assets of Minera Celdrán, the Moreno Sandoval family, and, most of all, Española de Zinc.
These were the golden years of Peñarroya in the district, where it ended up concentrating most if its investments and activities in Spain. In 1971, it expanded the foundry of Santa Lucía and closed its historical foundry in the village of Peñarroya. Throughout this whole period, the workforce of Peñarroya fluctuated between five hundred and six hundred workers in the quarries and the Roberto flotation plant (without including the Santa Lucía foundry) and maintained these levels in the following decade. Graphs 2 and 4 show how Peñarroya alone was able to handle half of the lead production during the peak production of the area, as well as attain the highest ever levels of zinc for Murcia.Footnote 48 However, by this stage, its gross production did not translate so well into profits and operational facilities as in the past, and it was generating at least five times more polluting waste than in 1957.
Final Crisis, Closure of the Mines, and Environmental Disaster
SMM Peñarroya-España went on to completely dominate the production of the mining district of Cartagena-La Unión, but this came at a very high cost. The problem did not strictly reside in the devastation caused by the mining activity across 50 km2 of Sierra, but in the way in which these enormous amounts of minerals were processed. Technically, the extraction of the metals through differential flotation required a large consumption of water in a very arid area, which was resolved by using seawater. The principal problem was how to discard the large amount of polluting residues that were generated in these processes, which were not present in traditional mining. The solution was to dump them directly into the sea without any type of treatment because, according to the technical studies of the company itself, the residues should have been discharged in the deep waters of the nearby ocean trench.
In order to obtain licenses to discharge the residues at that time and those generated by the successive extensions of the flotation plant, the company knew how to pull strings with the administration, making use of Tomás Maestre Zapata’s contacts with the Franco regime. Maestre Zapata remained in the position of chairperson of SMM Zapata Portmán after it had been taken over. In 1959, the company did not hesitate to hire the mining engineer Tomás Martínez Bordiú, who was also the brother of the son-in-law of the dictator Francisco Franco. A decade later, when the affiliate company Peñarroya-España was formed, Jesús Romeo Gorria was named chairman. He was a prominent Falangist and had been the minister of employment of Franco’s government for the previous six years and board secretary for the tax expert Narciso Amorós.Footnote 49 Throughout this period, the company obtained extraordinary privileges from the government, being able to modify and extend at will the conditions of its discharges in the following years. This enabled it to flout the legislation in force. The Town Council of La Unión reported the company, initiating a lawsuit that was not resolved until 1971. The sentence ruled in favor of the continued discharge of tailings into the sea, despite the palpable effects on this area of the Mediterranean. The justification was that the mining activity constituted the economic basis of the district and that the permits, although extraordinary, had been timely and properly granted. The mayor who filed the lawsuit was immediately replaced. Years later, and in democratic Spain (1977), the accusations were taken to the Congress by the parliamentary representative Ricardo de La Cierva, who indicated that Peñarroya had colluded with previous civil governors Enrique Oltra and José Aparicio Calvo-Rubio, and the former Franco ministers López Rodó, Manuel Fraga, and Silva Muñoz.Footnote 50
In reality, over three decades, Peñarroya hardly exhibited any interest in the polluting and environmental effects of its mining and smelting activity. Surprisingly, the first measures in this respect were not triggered by neighborhood protests or the insistence of the authorities for the company to comply with the law, but by an unexpected external pressure: the United States. In June 1960, the new United States Navy military base in Cartagena submitted a formal protest regarding the fumes that reached their homes and facilities from the Peñarroya foundry in Santa Lucía. The Ministry of Industry informed the multinational of the complaint and instructed it to make technical reforms, which the company began to design immediately. However, the technicians of the ministry, informed of the inadequacy of Peñarroya’s proposed new chimney, paralyzed the project (it was taller, but located on a low level, which did not resolve the problem).Footnote 51 The company delayed presenting an alternative, and the minister of industry, General Joaquín Planell, wrote a note in which he threatened to close the factory if the reform was not initiated immediately. This enormously influenced the beginning of the works of a new fume collector.Footnote 52
This and other reforms in the foundry were not matched in the open-pit quarries in the nearby Sierra. Here, Peñarroya only undertook a general restoration of the mines in 1985, obliged by the new legislation of 1982 regarding the restoration of natural spaces affected by mining activities. The company carried out small actions of planting trees and covering old flotation ponds, although it insisted that the “Sierra had not had any vegetation cover since Phoenician and Roman times [sic] and that when the company had arrived in the 1950s it had found a completely inhospitable terrain covered in tailings heaps,” which was untrue. In total, a plan was designed to recover 370 hectares of terrain (a tenth of the area exploited) with an investment over three years of 28.2 million pesetas, of which the company would contribute just 4.4 million and the rest would be provided by the Spanish government.Footnote 53
Meanwhile, it became evident that the engineers of Peñarroya had made a surprising error in their calculations: The wastewater collector of the Roberto flotation plant in Portmán Bay did not disperse the discharge into the ocean trench, as a deep current returned them to the bay and deposited them on its floor. The company, however, did not modify its discharge plan, although initially it had to address the protest of the local fishermen who were watching how their port was literally disappearing, consumed by the sludge. It was obliged to finance a new one in Cabo de Palos in 1975, while the depth of Portmán Bay continued to disappear until it was completely clogged up.Footnote 54 (See historical process in figures 4 to 7). In 1985, the ecological disaster of Portmán took on an international dimension when Greenpeace launched a crusade to recover Portmán Bay, initiating a media campaign to paralyze the dumping in what is considered to be the most polluted point of the Mediterranean coast. Surprisingly, during these years, the company continued to receive subsidies from the Spanish Ministry of Industry based on the 1977 mining law, enabling it to save 10 percent of its capital investments during the 1980s.Footnote 55 Some of these funds were directly related to the Roberto flotation plant. In general, it is striking how the Spanish administration, in democratic times, with the exception of this lukewarm policy of land restoration, maintained practically the same criteria for protecting Peñarroya’s activity in the area as during the Franco regime, without modifying its environmental requirements or introducing any fiscal reform to compensate for this.
Portmán Bay at the beginning of the twentieth century.
Portmán aerial flight image, 1929–1930.
Portmán in 2019, with bay regeneration work underway.

Portmán Bay in March 2014.
Source: Municipal Archive of La Unión; 1929 Pablo Rada’s Fly; 2019 Instituto Geográfico Nacional (PENOA); and Authors’ archive photograph.
The economic reality of the company was not exactly promising. In 1978, it conducted the last extension to the flotation plant, increasing the volume of tailings that were dumped into the sea, when the profitability of the facilities of the Sierra de Cartagena-La Unión were already declining. The extensions to the flotation plant and quarries constituted a doubling down of the company’s strategy, which it always justified with the same arguments: to cover the progressive exhaustion of the reserves and to continue producing in order to “keep supplying minerals for the national economy and preserve jobs.” In fact, the proportion of tailings continued to grow above the volume of mineral obtained from the 1970s (see Graph 4), in parallel with costs, while the performance of the installation began to nose-dive.
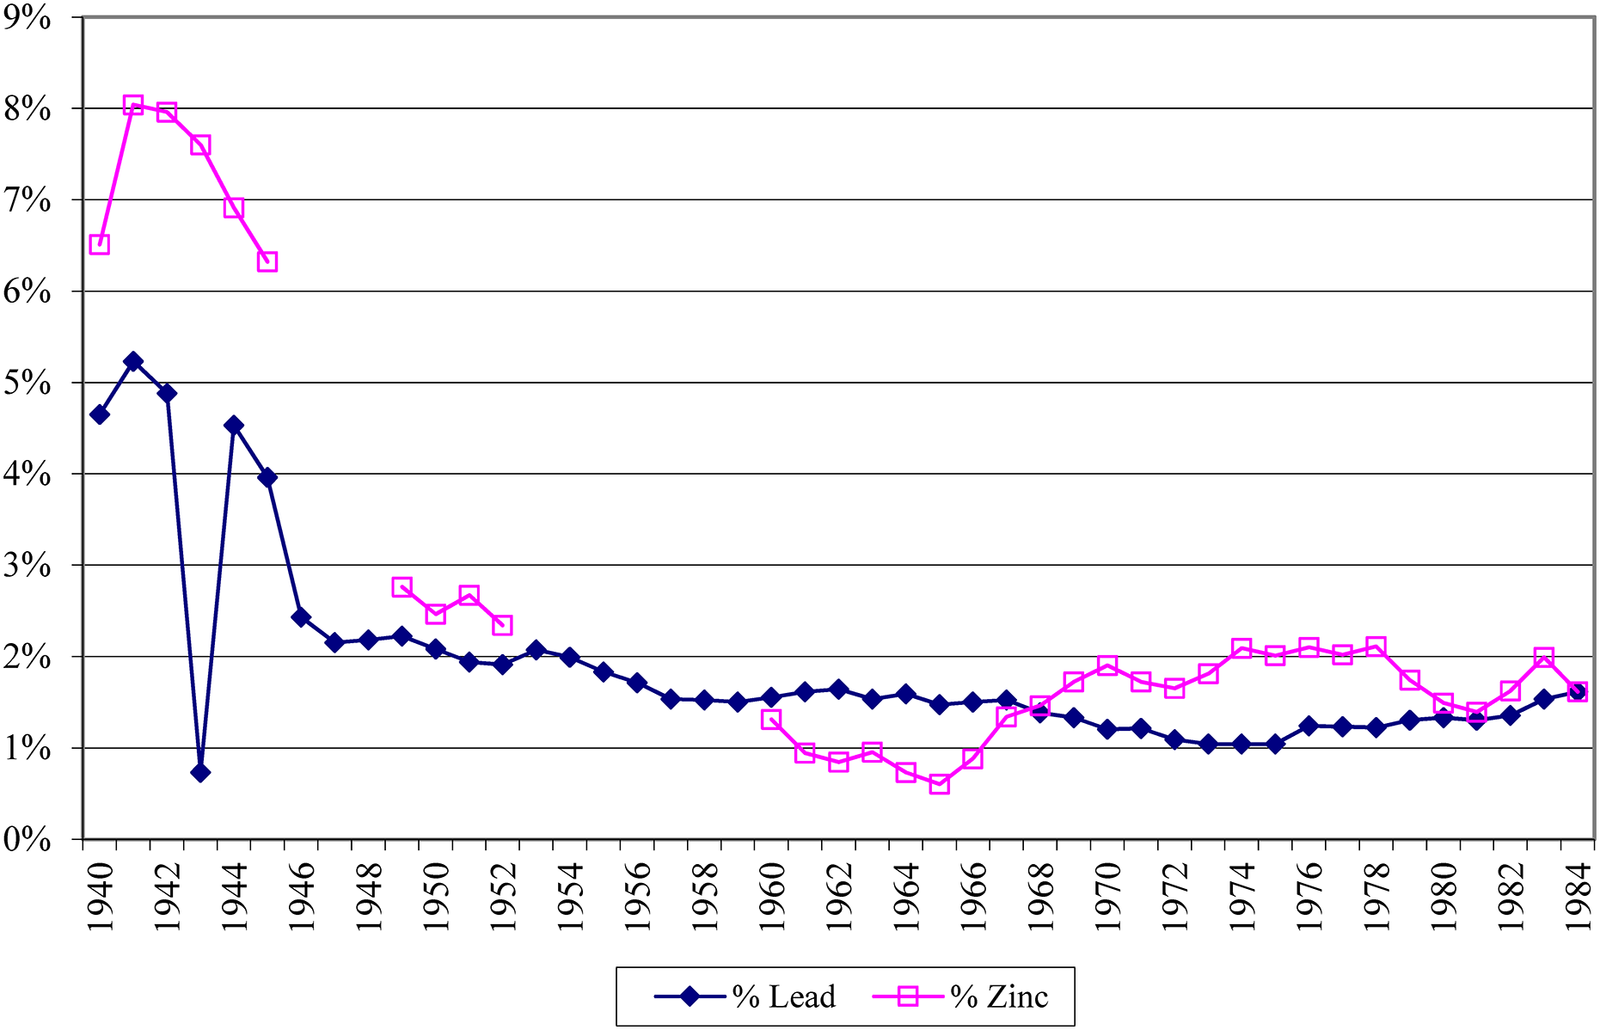
In fact, the mining activities of the Murcia district contributed very little to the income statement of Peñarroya. Profits barely reached 60 million pesetas in the balance sheet of 1982, as opposed to the 205 million of the previous year. Despite its magnificence, the mining activity in this area generated ridiculous earnings compared to other mining enclaves that the company owned throughout the world. The engineer George O. Argall Jr., editor of World Mining, was surprised by the low-grade ore with which they worked,Footnote 56 as shown in Graph 6 published by the company itself. Evidently, it covered costs because, among other aspects, it did not have to make any efforts with respect to the environment or repair the destruction generated.
Evolution of the grades of the minerals extracted by Peñarroya in the Sierra de Cartagena- La Unión, 1940–1984.
Source: SMM Peñarroya España, Las explotaciones de plomo y cinc en la Sierra de Cartagena and Libro del centenario.
At this point, the internal situation of Peñarroya was even more fragile with the exit of its principal shareholders and founders, the Rothschilds, after the nationalization of the banks in France in 1980. In 1988, it merged with the German metallurgical company Preussac and came to be known as Metaleurop, coinciding with an overall fall in lead and zinc prices. Consequently, the stance of the company was to find a solution that would allow it to divest its assets in La Unión and Cartagena, which, since 1986, had only generated financial losses. Specifically, 610 million pesetas, which increased to 738 million in 1986 and 756 in 1987.Footnote 57
In 1988, it achieved this, transferring all of its assets in the Sierra, including the Roberto flotation plant, to the recently created Portmán Golf. This was not a mining company, but one run by local construction and land speculation entrepreneurs, whose interests resided in using this land for property development. After certain political maneuvers by the Socialist government, which prioritized the preservation of jobs, the mines and flotation plant definitively discontinued their operations at the end of 1991. The new company is focused on a problematic urbanization project, which has only been very partially implemented, and declines any environmental responsibility.
Paradoxically, Peñarroya was not the last company of the mining industry of La Unión to be dissolved. Amid the bewildering activity of Peñarroya, some small companies still remained, having survived in the shadow of the multinational in precarious conditions. These constitute examples of the aforementioned capacity of survival of the traditional mining sector. The last Mohican of the mining industry of the area was an entrepreneur from La Unión, Juan Conesa, who established several mining companies in the 1970s and 1980s, most of which leased mines to Peñarroya. One of the last was Industrias Minerales San Juan S.A., created in 1982, which concentrated its activity in the El Arresto mine and its flotation plant. This was the last mine to close, in February 1992, as a result of the closure of the Peñarroya foundry to which it sold its concentrates, bringing a century and a half of mining to an end. The rest of the industrial establishments dependent on the local mining industry lasted a little while longer: In 2001, the Potasas y Derivados plant closed. This was the successor of the former factory La Unión Española de Explosivos, which operated in Cartagena from 1905. The electrolytic plant ZINCSA was able to continue operations until 2005, using imported raw material.
The environmental effects did not cease with the end of the mining industry. The facilities of the aforementioned companies and the Santa Lucía foundry are currently immersed in decontamination processes implemented by private companies. In a separate environmental remediation project, Portmán Bay initiated a tortuous process of partial replenishment in 2009 with 90 million euros of public funds,Footnote 58 which is currently paralyzed. Furthermore, the reports on the nearby Mar Menor (an area with enormous tourism possibilities) insist that the mining pollution, due to runoff or dust, still constitutes one of the principal polluting elements, together with the uncontrolled crops in the area, covering 1,000 km² of land affected by mining activity, ten times more than the maximum extent of the mining activity.Footnote 59 Only now, thirty years after the closure of the mining activity, epidemiological studies confirm the negative impact of airborne dust on the local population as well as the former workers.Footnote 60 However, although the regional government has budgeted 84,887,237 euros to restore the environment in the period 2018–2028, it can only contemplate partial actions in the mining ponds in the worst state of conservationFootnote 61 because the total restoration is impossible to execute and quantify. In all of this time, no criminal or civil case has been brought against those responsible for the pollution.Footnote 62
Conclusions
The mining district of Murcia, particularly the Sierra de Cartagena-La Unión, constitutes an example of the survival of the mining activity. Over a period of 150 years, it adapted the production possibilities through two models: one based on a system of small-scale mines, which was highly intensive in labor, and another highly capital intensive model that was thirty times more productive. The two overlapped for the last fifty years of the industry’s life.
The first model, with significant limitations to production due to the atomization of ownership, exhibited an enormous capacity to adapt the capital and labor endowments to the alterations in the markets and the technological evolution. However, the institutional framework was difficult to change, with mining oligarchies that dominated the local economy and the levers of power, and mining activity with harsh barriers to entry and high transaction costs. This capacity of adaptation reached its limits in the early decades of the twentieth century, when it was necessary to change the way minerals were extracted and concentrated. This gave rise to a crisis in the traditional mining industry and among the owners of the concessions.
The baton was passed in the 1940s, as SMM Peñarroya progressively came to dominate the extraction and smelting activities in the Sierra de Cartagena-La Unión. The process was not simple: It had failed in its first attempt to penetrate the market in 1885, but it ended up absorbing the principal mines and foundries (Figueroa, Zapata, Escombrera Bleyberg, and Celdrán) and eventually took control of the Sierra in the 1950s. It took more than half a century for it to gain leadership. Once it had become the dominant player in the industry, it took advantage of the institutional characteristics of the Spanish regime, undemocratic and with high levels of corruption, in order to use different means of influence that would enable it, at no cost, to address the huge problem of the new mining industry and the concentration techniques through flotation: discharging the enormous polluting residues that it generated.
The solution of dumping all of its polluting waste into the sea, without being treated in any way, led to one of the worst ecological disasters in the Mediterranean, with the complete clogging up of Portmán Bay and the physical destruction, with no replenishment, of the Sierra de Cartagena-La Unión.
Consequently, the balance of the mining activity is ambivalent. On the one hand, from the beginning it revitalized the economy of a region with very few alternatives and generated an enormous demographic dynamism, On the other hand, however, the two production models that coexisted in the mining sector of the Sierra de Cartagena-La Unión generated significant negative externalities. First, the archaic system was a focal point of labor instability, high accident rates, low standards of living, and child labor. Second, although prolonging the mining activity for a further four decades, the modern model barely generated employment and left a mark of environmental destruction that has completely conditioned the economic development of this area. Furthermore, it has left the responsibility of the partial recovery (the complete recovery of the former bay is impossible) solely to the public purse. The companies that caused the damage or currently own the rights have not contributed anything to this recovery, either through replenishment or through fiscal means.
It is worth highlighting the significance of the ownership rights, which influenced the development of the mining business, and the institutions, both at the national and local level, which allowed companies to act with great impunity, leading to enormous consequences for the environment.



