Introduction
Definition of a disease as a balance between infection and immunity
There are a multitude of definitions of a ‘disease’ because, like with most common words, the usage is varied. It is nearly impossible to reach an agreement on one formal definition of a disease. The most general statement would be that disease is a detrimental deviation from the structural or functional norm (anatomical, physiological or psychological norm in the case of living organisms). What a ‘norm’ is remains equally debatable. One of the most common categories of diseases are infectious diseases. In the classic Koch definition, these are diseases caused by a parasitic organism, usually a small one like a bacterium or a virus, which enters a body and alters its normal functions (Kaufmann, Reference Kaufmann2003). The human body is a microcosm of flora and fauna kept in balance by the interactions of the vertebrate organism and its multitude of microorganismic inhabitants. The immune system plays a decisive role in controlling how those inhabitants interact with the host organism. Tuberculosis is a good example of the interaction of infestation by a particular category of bacteria, Mycobacterium, and immunity. Most humans are infected by Mycobacteriae but do not develop any pathological signs or symptoms (Cole et al., Reference Cole, Eisenach, Mcmurray and Jacobs2005). Some humans, with lower immunity, will suffer the consequences of uncontrolled expansion of mycobacterial flora, which produces a disease invading various tissues of the body and, if immunity does not improve or if the parasite growth is not artificially checked by chemotherapy, may die (Roberts & Buikstra, Reference Roberts and Buikstra2003; Cole et al., Reference Cole, Eisenach, Mcmurray and Jacobs2005).
Killing germs versus improving immunity: what can eradicate tuberculosis?
Tuberculosis (TB) is an ancient disease that caused the deaths of approximately 25% of the European adult population during the 1700s and early 1800s (Stead, Reference Stead2001). At present, the World Health Organization estimates that approximately one-third of the world's population are infected with the causative organism, Mycobacterium tuberculosis (World Health Organization, 2012). However, only approximately 10% of all individuals infected, most commonly those with lowered immunity, will ever develop active disease (Wilbur et al., Reference Wilbur, Farnbach, Knudson and Buikstra2008). Signs and symptoms of TB are usually associated with the respiratory system and include coughing, difficulty breathing, bloody sputum, weakness, lethargy, loss of appetite and weight, night sweats, pallor and chest pain. Transmission of the bacterium occurs through the generation of aerosolized droplets containing bacteria, usually through excessive coughing.
Antibiotics and other chemical therapies were introduced in the 1940s and 1950s, which allowed the ‘cure’ of TB by killing the pathogenic organism in the patient's body. However, their use caused the development of drug-resistant bacteria through the process of natural selection (Herzog, Reference Herzog1998). Some strains of the TB bacillus have been found to be multiple-drug resistant (MDR), meaning they are resistant to the two first-line chemical agents (isoniazid and rifampin) (Wang et al., Reference Wang, Lin and Jiang2008). Some strains have even been observed to be extensively drug resistant (XDR) and are very difficult and expensive to treat (estimated cost US$500,000–1,000,000 per patient for hospital-based care in high-income countries) (Michael, Reference Michael2013). In Peru, the incidence of TB has declined 3.7% per year since 1996, but the incidence of cases with MDR strains has increased by 4.5% (Manjourides et al., Reference Manjourides, Lin, Shin, Jeffery, Contreras and Cruz2012). These data show that the proportion of MDR-TB cases is increasing. In Belarus, a study by Skrahina et al. (Reference Skrahina, Hurevich, Zalutskaya, Sahalchyk, Astrauko and Gemert2012) has shown that 35.3% of newly diagnosed TB patients and 76.5% of previously treated patients had MDR-TB. Overall, this gave an average of approximately 50% of TB cases being of the MDR type.
Before chemical therapies including antibiotics appeared, the typical treatment for TB involved increasing a patient's immunity through improved nutrition, hygiene and rest (conservative therapies) (Kaplan, Reference Kaplan1959). All of these measures were used at sanatoria (Rucker & Kearny, Reference Rucker and Kearny1913) and helped to cause and maintain a decline in mortality due to TB throughout the 19th century, long before antibiotics were introduced. The main factors in this decline are important because they can help to devise new treatment methods for patients with MDR or XDR, which are difficult to treat with antibiotics alone.
The historical trend of TB mortality decline
Several authors (McKeown, Reference McKeown1976; Szreter, Reference Szreter1988; Fairchild & Oppenheimer, Reference Fairchild and Oppenheimer1998) have reported and investigated the decline in mortality due to TB over time. These studies mainly used data from England and Wales during the 19th and early 20th centuries in order to make interpretations about the reasons why TB mortality declined over time.
In his book, McKeown describes the growth in population size throughout history, attributing the increase to a reduction in mortality, rather than an improvement in fertility. He then goes on to describe the possible causes of the mortality decline, focusing on the major causes of death during the 19th century, i.e. infectious diseases. He mainly describes airborne infectious diseases because they were a large part of the decline. Several factors were considered, including a decrease in virulence of microorganisms, medical interventions (immunization and therapy), levels of exposure and nutrition. All of these factors were considered in turn, with the final conclusion that nutrition was the main reason for the decline in mortality (due to infectious airborne diseases). For TB, the authors suggested the reason for the mortality decline was a reduction in exposure because the disease was less prevalent, brought about by an improvement in nutrition. The work done by Griffiths et al. (Reference Griffiths, Gelbart, Lewotin and Miller2002) was also highlighted, giving reasons why the interpretation of medical interventions as the main reason for mortality decline is incorrect.
A later investigation in the same area was conducted by Szreter (Reference Szreter1988). The author appraised the earlier work by McKeown and highlighted various problems. He stated that the interpretation was done by elimination and that the nutrition hypothesis was not as carefully investigated as the other factors were. Nutrition also did not account for decline of some diseases such as smallpox, which declined for other reasons (in this case, immunization). Additionally, food and waterborne diseases were a substantial part of the mortality decline. These were significantly affected by hygiene and living conditions and less affected by nutritional status. McKeown also grouped ‘public health’ as a broad factor and did not consider many of the smaller parts. The work also treated all airborne diseases together, but mortality trends for separate groups were different. Overall, Szreter suggested that only TB would really support the nutrition hypothesis proposed by McKeown. However, despite this, there are certainly other factors affecting the decline of TB including addressing overcrowding, lack of sunlight, ventilation and occupational hazards (dust/smoke) through public health interventions. Additionally, urban and rural populations had a different exposure to, and risk of, TB. Szreter instead suggested a different reason for the mortality decline, associated with public health. The author listed the number of Public Health Acts introduced in Britain addressing a variety of factors including hygiene, living conditions, ventilation and food quality. He also noted that McKeown's theory about a larger quantity of food resulting in better nutrition may not be true if food quality is poor. In fact, it may spread disease faster than if a smaller amount of food was available.
Another later study (Fairchild, Reference Fairchild and Oppenheimer1998) reviewed both McKeown's and Szreter's work, highlighting that although each had their own interpretations, neither had sufficient evidence to support their conclusions. There is a need for multifactorial models that include housing, ventilation, hygiene, working conditions, nutrition and other infections, but it is impossible to test for each one of these while keeping the others constant. The author continues with a description of sanatoria and how segregation and consequent lowering of transmission of the disease has been the only consistently effective measure for controlling TB. The authors finally concluded that ‘social medicine’ was responsible for the decline in TB and this included public health, awareness, environmental conditions, housing, food and working hours. Overall, these previous works show the difficulty in determining the exact reasons for the decline in TB mortality over time. It is likely that a combination of factors related to public health, nutrition, segregation of the infected and hygiene were responsible for the decline in mortality.
Since the precise reasons for the decline in TB are difficult to determine, this study investigated the decline in countries other than England and Wales in order to obtain a more detailed view of the events occurring. These data were then compared with those of England and Wales against the historical background of specific actions taken in relation to sanitation and disease control.
Methods
Information about tuberculosis mortality was collected from numerous sources. Information was collected for Canton Zürich from both the Stadtarchiv (‘city-archive’; Stadt Zürich, 2012) and Staatsarchiv (‘canton-archive’; Canton of Zürich, 2012) in the city of Zürich, Switzerland. The Stadtarchiv held records for causes of death in Zürich city from 1893 to 1933, which included mortality attributed to tuberculosis. There were many records in this archive, but the following were focused on: Tuberkulose (Tuberculosis): two volumes; 1912–1932 and 1932–1935; Tuberkulose Sterbefaelle (Tuberculosis mortality): five volumes; 1903–1905, 1905–1915, 1915–1920, 1920–1934 and 1929–1936. Data were also collected from a volume of primary historical statistics for Switzerland (State Statistics) entitled Historische Statistik der Schweiz (Ritzmann-Blickenstorfer, Reference Ritzmann-Blickenstorfer1996). Data for the entire country (Switzerland) were also collected from these sources as well as from the World Health Organization for the years 1867 to 2005.
Much of the information was obtained from previously published literature regarding England and Wales (Blower et al., Reference Blower, Mclean, Porco, Small, Hopewell, Sanchez and Moss1995), New York (United States) (Drolet & Lowell, Reference Drolet and Lowell1952), Japan (Johnston, Reference Johnston1995), Brazil (Antunes & Waldman, Reference Antunes and Waldman1999) and Sierra Leone (World Health Organization, 2012). Data from publications regarding mortality for TB in England and Wales, as well as New York (United States), were collected and entered into Microsoft Excel for direct comparison with the Swiss data collected in this study (from Canton Zürich as well as the whole of Switzerland). England and Wales and New York (United States) were considered similar in terms of TB mortality trends (all Westernized, similar history regarding anti-TB health measures). Data from Japan, Brazil and Sierra Leone were collected for comparison as these countries had a different history of TB prevention and control (as well as lacking Westernization for many years).
Important historical dates for events in the prevention and control of TB were added for further interpretation of the mortality data. These events included (among others) the introduction of Public Health and Sanitation Acts, compulsory reporting of TB cases and the introduction of streptomycin.
The logistic curve was chosen as the basic description of change in the relationship between disease prevalence and population characteristics. This curve describes the alteration of an occurrence of a particular feature in a population after the introduction of a change in the relationship of this feature to the population. The curve has a characteristic shape resulting from the fact that a change initially has small effects, then its effects increase as the change spreads and when it exhausts the prevalence of a feature, it comes to an asymptotic end. Logistic models were fitted to the data for Switzerland (whole country), England and Wales and New York in the form:
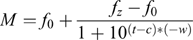 $$M = f_0 + {f_z - f_0 \over 1+10^{(t-c) * (-w)} }$$
where M is the mortality rate observed at a given year (t); t is the year; f 0 is the lower asymptote (the lowest mortality rate observed); fz is the upper asymptote (highest mortality rate observed); c is the inflection point, where the rate of decline in mortality is the highest; and w is the rate of decline at the inflection point (i.e. the highest rate).
The values of the parameters f 0, fz, w and c were initially estimated by observing the scatter of datum points against time and the best fit was obtained by their iterative alterations (bootstrapping) using the least squares method. The year (t) and mortality (M) were the independent and dependent variables, respectively, and thus did not need estimating.
These models were extrapolated to show the expected trend in TB mortality without the introduction of antibiotics in order to investigate the efficiency of conservative therapies (rest, good nutrition, ventilation, etc.) as well as public health improvements (addressing hygiene, nutrition and reducing exposure to infections as well as educating the population about TB) on the disease.
Results
Historical events in the decline of tuberculosis
The City of Zürich and Canton Zürich (Switzerland)
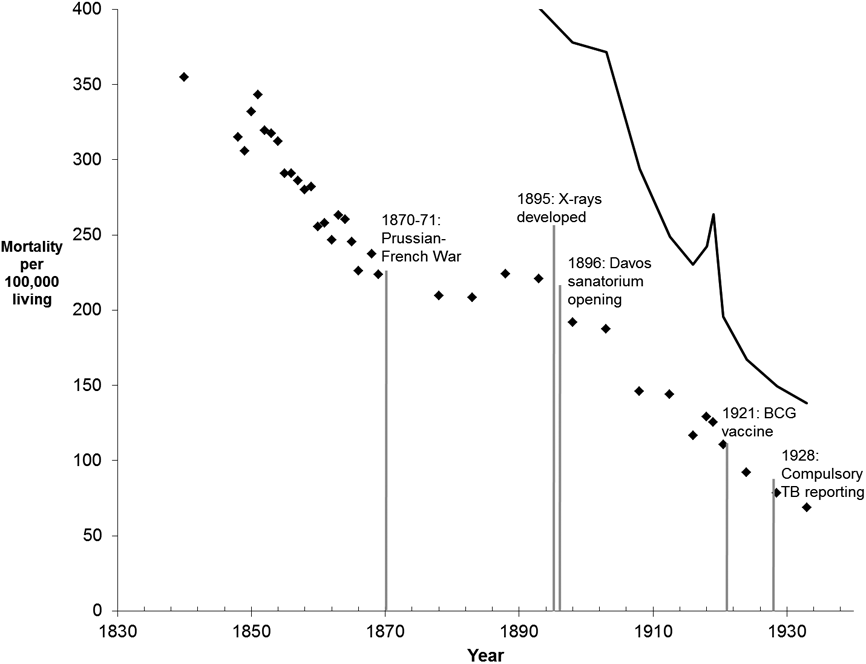
The TB mortality rate for Canton Zürich (Switzerland) was above 350 per 100,000 during the 1840s (Fig. 1). The mortality rate declined from that time onwards, reaching 224 by 1869. The lack of information for the early 1870s is probably due to the Prussian–French War during 1870 and 1871. Although Switzerland did not participate in this war, it took in a large number of refugees and the instability at the time would have affected external and international actions such as trade. From 1878 to 1888, the TB mortality rate increased slightly from 210 to 224 per 100,000. There was a major economic crisis period in the 1880s and many people emigrated from Switzerland (Schoch et al., Reference Schoch, Staub and Pfister2011). From 1893, the TB mortality rate dropped steadily until the end of the data shown here (1933). This decline was associated with the development of X-rays for diagnosis (1895), the opening of the first sanatorium (in Davos, 1896), the introduction of the BCG vaccine (1921) and finally compulsory TB reporting and treatment introduced in 1928 (Gesetzgebung: Zürich, 1928).
Tuberculosis mortality rate per 100,000 population for Canton Zürich (diamonds) and the City of Zürich (line) in Switzerland. Data for Canton Zürich cover 1840 to 1943. The City of Zürich data cover 1893 to 1933. Historical dates associated with tuberculosis prevention and control are included.

For the city of Zürich, the records start only from 1893. This is easily explained because in 1893 the city expanded substantially in terms of area and population (Steinberg, Reference Steinberg1996). Thus the statistics collected are for a completely differently defined ‘City of Zürich’ than in years preceding 1893. The initial TB mortality rate was higher in the city than in the entire canton. In fact, the rate in the city for 1893 was 180 per 100,000, higher than in the canton for this same year. Despite the initial rate being higher, the decline in mortality in the city was faster than in the canton. From 1893 to 1933, the mortality rate declined from 401 to 138 per 100,000. There was a reversal from the decline in 1918 when the Spanish flu (influenza) epidemic caused a brief increase in mortality from TB.
England and Wales
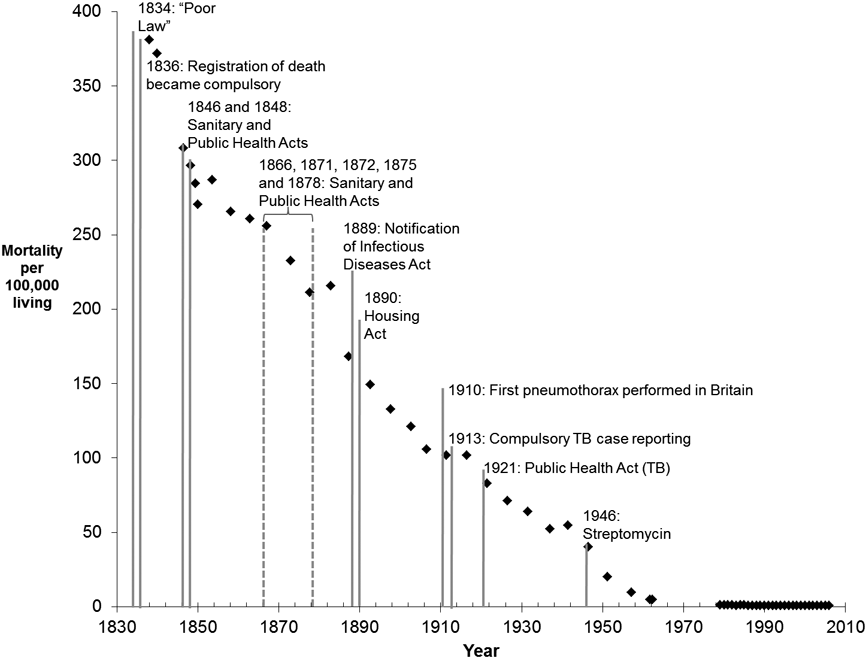
In England and Wales, similar to Switzerland, TB mortality rates exceeded 350 per 100,000 prior to the 1840s (Fig. 2). By 1846, the rate had fallen to around 300 per 100,000. Mortality continued to decline steadily, reaching about 50 per 100,000 in the 1940s, prior to the introduction of pharmacotherapies. Since then it declined further until approximately 1960, when it had reached 5 per 100,000. After this, the mortality rate was close to zero and could not decline much further. During the period of steady decline, a large number of events aimed at the control and prevention of TB occurred. A number of these events included the introduction of laws including the ‘Poor Law’, Sanitary and Public Health Acts (1846, 1848, 1866 and 1870s), the Housing Act (1890) and a Public Health Act specific for TB (1921) (Szreter, Reference Szreter1988; Wilson, Reference Wilson2005). These Acts helped to prevent the spread of disease between groups in the population with different levels of risk for TB, and addressed hygiene, living conditions, exposure risk (for bovine TB) and nutrition. In 1836, the registration of death became compulsory and this resulted in an improvement in reporting of causes of death (Szreter, Reference Szreter1988). A notification of Infectious Diseases Act was established in 1889, requiring the reporting of all cases of infectious diseases. This allowed many of the previously unknown cases of TB to be located and dealt with more appropriately. Surgical interventions for TB were introduced in 1910, when the first pneumothorax (lung collapse) operation was performed. Compulsory reporting of TB did not come into effect until 1913 and as such, before this, many cases may have gone unreported. The final step in the control of TB in England and Wales was the introduction of the specific anti-TB antibiotic, streptomycin. After this time, mortality from the disease had declined substantially and the disease was no longer a major cause of death among the population.
Tuberculosis mortality rate per 100,000 population for England and Wales between 1838 and 2006. Historical dates associated with tuberculosis prevention and control are included.
New York (United States of America)
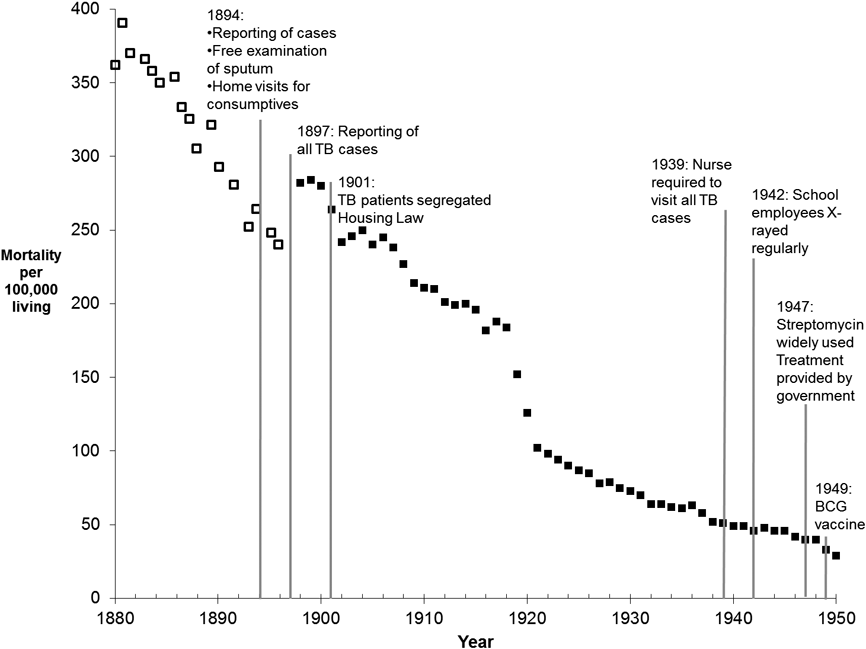
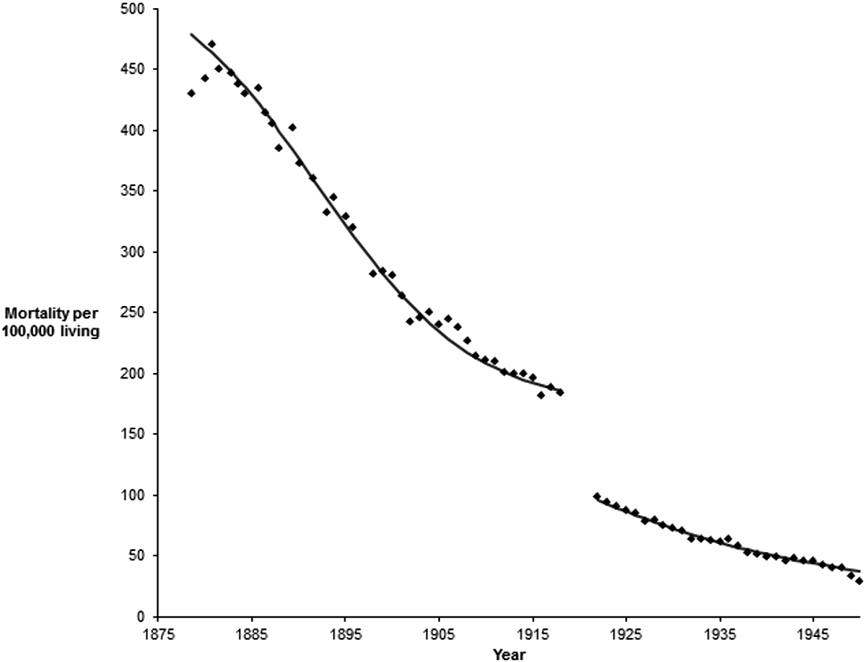
The TB mortality rate in New York was above 350 per 100,000 until about 1887 and did not drop below 300 until after 1890 (Fig. 3). During the years 1918 to 1924, the mortality rate due to TB declined from around 200 to 100 per 100,000. After this time, the mortality rate declined slower at a relatively constant rate until 1950 when pharmacotherapies became established.
Tuberculosis mortality rate per 100,000 population for New York (United States) between 1880 and 1950. Historical dates associated with tuberculosis prevention and control are included.
As in England and Wales, a number of laws were introduced to help control TB. One of these included an improved reporting of cases, free examination of sputum and home visits for consumptives (1894) (Drolet & Lowell, Reference Drolet and Lowell1952). Other modifications to public health were made early in the 20th century, including separating TB from the rest of the population (1901), the Housing Law (1901), home visits by nurses (1939), X-rays for school teachers (1942) and government-funded treatment (1947). Compulsory reporting of TB was introduced in 1897. The anti-TB drug streptomycin was introduced in 1947. This allowed effective treatment of TB but did not significantly impact the rate of mortality decline. The last measure to be implemented was the BCG vaccine in 1949. By this time, the mortality due to TB was low and this final measure had little impact on the rate.
Japan
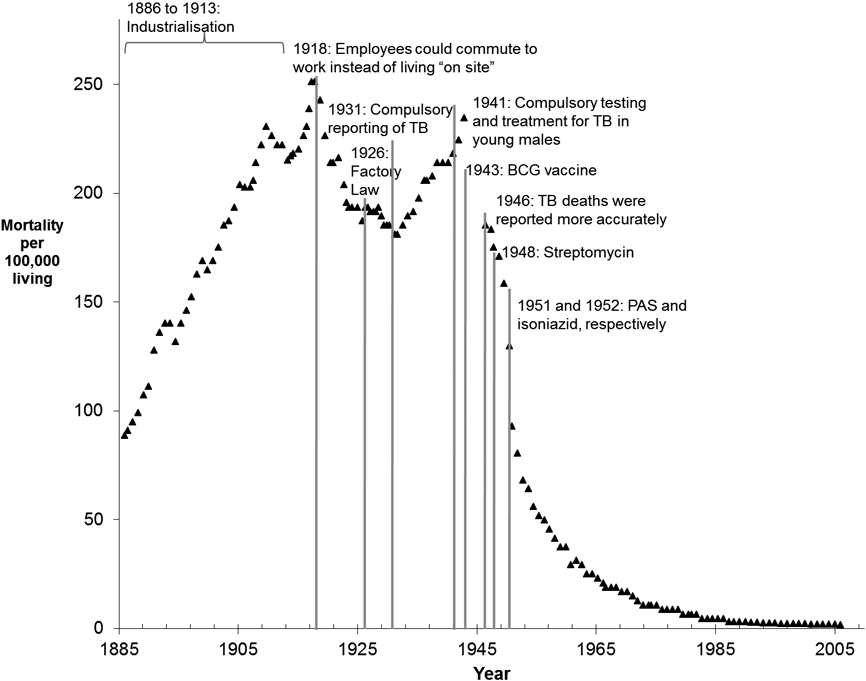
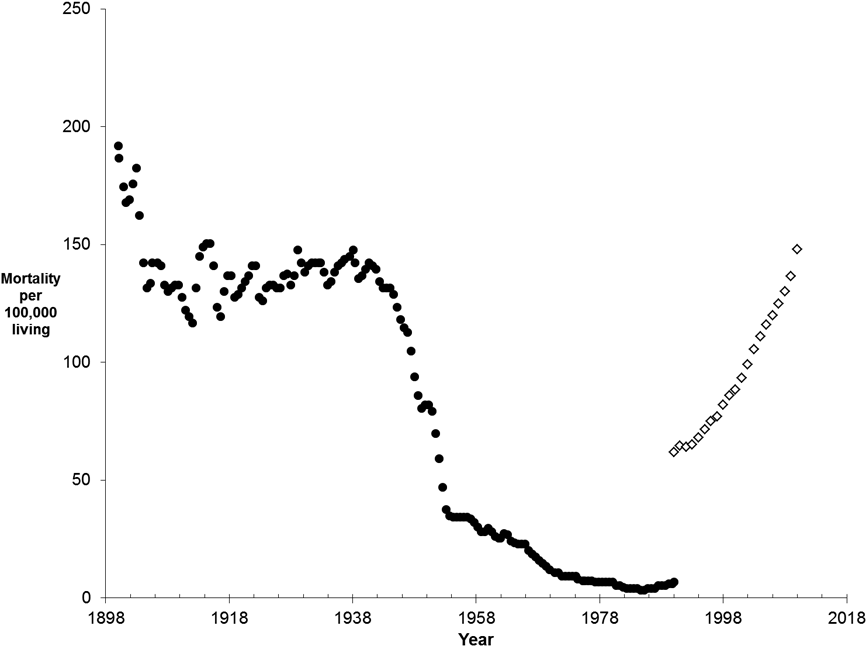
In contrast to Switzerland, England & Wales and New York, the mortality rate in Japan was below 100 per 100,000 between 1886 and 1888 (Fig. 4). The rate increased steadily until 1910, when it was 231 per 100,000. The mortality rate fluctuated between 1911 and 1918, but was increasing overall. This increase in mortality rate occurred during the initial heavy industrialization of the country (Johnston, Reference Johnston1995). Tuberculosis mortality would have increased partly as a result of poor living conditions in ‘on site’ accommodation for factory workers. In 1918, workers were allowed to commute to their workplace rather than living on site and this gradually resulted in a decrease in mortality due to TB (Johnston, Reference Johnston1995). In 1918, the mortality rate was 251 and this decreased to 194 per 100,000 by 1924. In 1926, a Factory Law was introduced, protecting workers as well as women and children in the workplace. However, from 1933, the recorded mortality rate began to increase. This was due to a combination of compulsory reporting of cases introduced in 1931 as well as the Great Depression and the effects of war on the economy. It is worth noting, however, that mortality rates during the early 20th century remained well below 300 per 100,000, roughly comparable to what these rates were at the same period in Europe and New York. Towards the end of World War II, TB had become a major problem and some further measures were introduced to help combat the disease. In 1941, reporting and treatment of TB were made compulsory in young males. The BCG vaccine was introduced in 1943. After World War II, cases of TB were reported more accurately and medicine was able to help fully control the disease. From 1946 to 1985, the mortality rate decreased from 185 to 4.5 per 100,000. Most of this decline was associated with the introduction of streptomycin in 1948, followed by the other anti-TB drugs, para-aminosalicylic acid and isoniazid, in the early 1950s. Japan is different in that the pattern of mortality does not begin at a high level. Mortality increased and was then controlled by public health measures, before medication finally reduced the disease to a level where it was no longer a major cause of death. Mortality rates also never reached the same level as in Switzerland, England and Wales and New York. It is difficult to say to what extent the post-1950 decline of mortality was impacted by non-pharmacological measures.
Tuberculosis mortality rate per 100,000 population for Japan between 1886 and 2006. Historical dates associated with tuberculosis prevention and control are included.
Brazil and Sierra Leone
In these two countries, public health interventions occurred very late in comparison with Switzerland, England and Wales and the United States. Thus they serve as a useful comparison showing that anti-TB drug therapy is indeed effective at controlling TB mortality (Fig. 5).
Tuberculosis mortality rate per 100,000 population for Brazil (1900 to 1990) and Sierra Leone (1990 to 2010).
In Brazil, at the end of the 19th century the mortality rate was just below 200 per 100,000, a moderately high rate compared with Europe and New York in the same period. The decline since then was slow and unsteady, but brought the mortality to less than 100 per 100,000 population by the mid-1940s, just prior to the introduction of pharmacotherapies. When medication was introduced, the mortality rate declined substantially at a rapid rate until it reached a level low enough to eliminate TB as a major cause of mortality in Brazil (Antunes & Waldman, Reference Antunes and Waldman1999). As in the case of Japan, it is impossible to separate effects of non-pharmacological measures.
In Sierra Leone, there are data for only 1990 to 2010, but it is clear that the TB mortality rate was, and still is, increasing at an alarming rate. In this African country, TB control is complicated by poor public health, lack of hygiene, HIV and probably increasing number of drug-resistant TB strains. In this case, although chemical therapies are available, they are ineffective. A strategy to reverse this trend can be developed but it must take into account a number of approaches.
Logistic fitting
Logistic curves were fitted to the data for Switzerland (whole country), England and Wales and the United States. Two (and in one case, three) separate equations were required to fully describe the data. Time periods best fitted by separate curves may have corresponded to a specific event during the decline of TB: the introduction of medication. Streptomycin implementation was observed to cause an increase in the rate (w) of decline compared with earlier time periods. In many countries during the first few years of streptomycin use the datum points show a significant decrease and it was very difficult to include these data when estimating parameters of a single curve, so they were excluded from the estimations.
Switzerland
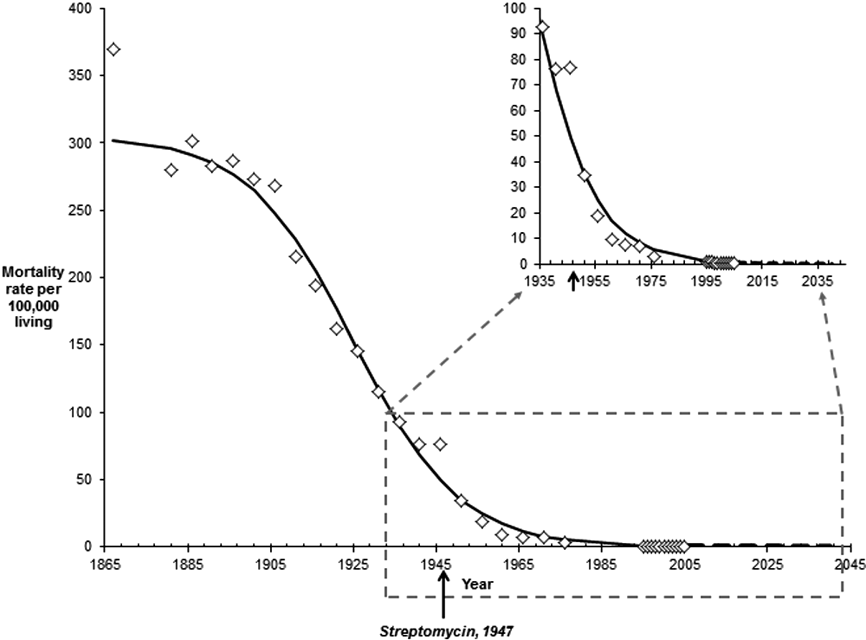
The mortality rate for Switzerland is shown in Fig. 6. The data for Canton Zürich or Zürich city were not modelled because the date range ended before the introduction of antibiotics and this method was intended to compare the rate of decline before and after the introduction of these therapies. The two time periods fitted with separate logistic curves were: (i) 1867 to 1941 and (ii) 1946 to 2005. The equations that best fit the data for these two time periods are:
(i)
 $M={305 \over 1+10^{(t-1925)(-1*-0.034)}}$ and
(ii)
$M={450 \over 1+10^{(t-1927)(-1*-0.042)}}$


Tuberculosis mortality rate per 100,000 population for Switzerland for 1867 to 2005. A logistic curve with R 2=0.993 has been fitted to the data. The logistic fit has been extrapolated. The inset shows a closer view of the time when streptomycin was first introduced. Symbols correspond to the real data, the solid line is the logistic fit and the dashed line is an extrapolation of the logistic fit using only the first equation (pre-pharmacotherapy).
The R 2 value for this double-logistic fit was 0.993. From the logistic models, the rate of decline can be observed to increase after 1946, when antibiotics were introduced. However, this is only a 24% increase in rate indicating that TB was well controlled before the implementation of antibiotics. The inflection point (c; where the rate of decline is highest) does not differ much between the two separate models as if they were parts of the same process. This could indicate, again, that antibiotics did not have a significant impact on TB mortality in Switzerland, but rather supported the decline already occurring.
England and Wales
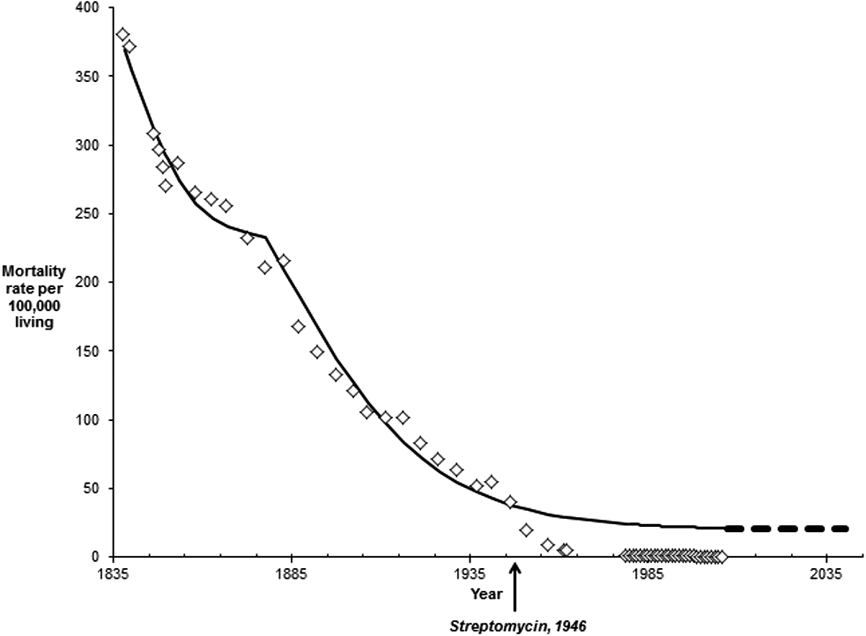
For England and Wales, fitting of data required three separate models: (i) 1838 to 1878, (ii) 1883 to 1937 and (iii) 1941 to 2006 (Fig. 7). This indicates there were three time periods where different factors were active in reducing the mortality from TB. The equations for these three different time periods are:
(i)
$M={250 \over 1+10^{(t-1840)(-1*-0.050)}}$(ii)
$M={405 \over 1+10^{(t-1880)(-1*-0.020)}}$(iii)
$M={450 \over 1+10^{(t-1929)(-1*-0.055)}}$



Tuberculosis mortality rate per 100,000 living for England and Wales for 1878 to 1950. A set of three logistic curves with R 2=0.995 has been fitted to the data. The logistic fit has been extrapolated. Symbols correspond to the real data, the solid line is the logistic fit and the dashed line is an extrapolation of the logistic fit using the second logistic curve (pre-pharmacotherapy).
These three models were combined in order to fully explain the data and the R 2 value for this fit is 0.995. When comparing the three different equations, corresponding to different time periods, the rates (w) begin at 0.050, decrease to 0.020 and then increase again to 0.055. Thus it can be observed that the initial decline of TB during time period (i) (1838 to 1878) was relatively fast, nearly as fast at following the introduction of antibiotics. After 1878, up to 1941, the decline slowed, but still a decrease in mortality occurred. During the final time period (1941 to 2006) the decline increased in rate again, to slightly more than it was in the first time period. It is likely that the initial decline was due to the factors addressed by public health interventions (nutrition, hygiene, living conditions, etc.), while the final decline was influenced by antibiotics. The inflection point (c, date at the highest rate of decline) increases through the three different time periods: from 1840 to 1880 to 1929 in time periods (i), (ii) and (iii), respectively. The different values of c indicate that three separate processes are occurring.
The United States of America (New York)
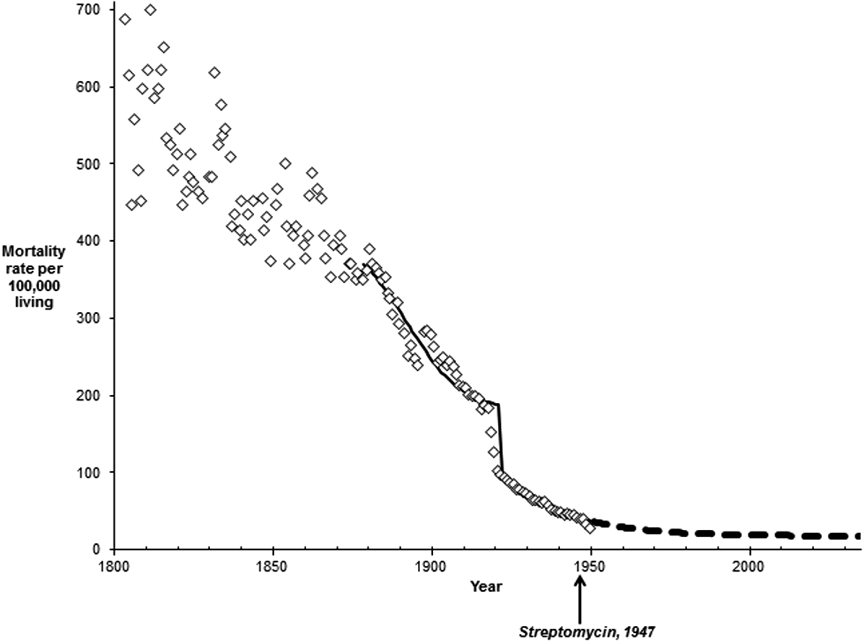
For New York, fitting required distinguishing two periods with separate logistic models (Fig. 8). These two time periods were: (i) 1878 to 1917 and (ii) 1921 to 1948. The time span corresponding to the third period in England and Wales (1940s to 2006) was not studied. The equations fitted to these data were:
(i)
$M={230 \over 1+10^{(t-1892)(-1*-0.050)}}$ and(ii)
$M={297 \over 1+10^{(t-1904)(-1*-0.025)}}$


Tuberculosis mortality rate per 100,000 living for New York (United States) for 1878 to 1950. A logistic curve with R 2=0.971 has been fitted to the data. The logistic fit to pre-pharmacotherapy data has been extrapolated. Symbols correspond to the real data, the solid line is the logistic fit and the dashed line is an extrapolation of the logistic fit.
These two equations gave a combined R 2 value of 0.971, indicating a reasonably good fit, but some data were not well represented by the model. This discrepancy is probably due to changes in the reporting system, where some cases of TB went unreported and, after a certain year, compulsory reporting of TB cases was introduced. An attempt was made to solve this issue by artificially increasing the mortality rate values before 1898 (Fig. 9). A logistic model was fitted to the modified data, with equation:
(iii)
$M={370 \over 1+10^{t-1892)(-1*-0.052)}}$

Tuberculosis mortality rate per 100,000 living for New York (United States) for 1878 to 1950. The data for 1878 to 1897 have been modified from Fig. 8 due to under-reporting before the introduction of compulsory recording of TB cases in 1898. A logistic curve with an R 2 value of 0.996 has been fitted to the data.
The other data (after 1920) retained the same equation as before ((ii) above).
Comparing equations (i) and (ii) it can be observed that the rate (w) decreases by half between the earlier and later time periods (0.05 to 0.025), indicating that the rate of decline was faster during the time period 1878 to 1917 than during 1921 to 1948. This is interesting because the latter time period included, at its very end, the introduction of antibiotics. This indicates that antibiotics had little impact on the already rapid and largely completed decline of TB mortality. The same decrease is observed when comparing (i) and (iii) (modified data). The equations (i) and (iii) also have the same value for c (inflection point, where the decline is most rapid). However, between the two time periods, the value of c is different. In the earlier time period, the rate of decline is highest at 1892 and in the later time period during 1904. This difference in the value of c indicates that at least two separate processes are affecting the decline of TB during the entire time period reported (1878 to 1897). There were only a few differences between the modified and unmodified data for New York. The rate is slightly higher in the modified data and the upper asymptote (highest mortality rate) was higher for the modified data compared with the unmodified data. This is expected, since the modification was to artificially increase values to account for the under-reporting of TB cases before 1898.
Extrapolation of logistic models
The models fitted to the data for Switzerland, England and Wales and the United States (New York) were extrapolated to show the expected trend of TB mortality if antibiotics had not been introduced. For Switzerland, this was achieved by extrapolating equation (i) to the year 2040. For England and Wales, equation (ii) was used to model the years from 1941 to 2040 while equation (i) was retained to model the earlier period 1838 to 1878. New York data were extrapolated using equation (ii) to model data beyond 1948.
In Switzerland (Fig. 6), streptomycin was introduced during 1947. The rate of decline for TB after the introduction of this therapy was 0.042 (equation (ii) above) but with extrapolation the rate is only 0.034 (equation (i) above). This corresponds to a 24% increase in rate of decline through the use of antibiotics. Both the model data and the real data reach a similar mortality rate of less than 1 per 100,000 by the end of the real data (2005). At the time that streptomycin was introduced, mortality from TB had already declined from 370 per 100,000 in 1867 to 77 in 1946. This is a decline of 71%. The logistic model predicts a rate of 0.58, while the real data rate is 0.28. Overall, in Switzerland, the introduction of streptomycin only served to slightly improve the rate of mortality decline.
In England and Wales (Fig. 7), streptomycin was available in 1946. At this time, the rate of decline with this therapy was 0.055 (equation (iii) above). The rate of decline modelled by the logistic fit (extrapolation) is 0.020 (equation (ii) above). This is an increase of 175% in the rate of mortality decline. Thus, antibiotics did substantially improve the rate of decline. Interestingly, the modelled data and the logistic data do not reach the same levels by 2006 (when the real data end). The modelled data reached 21 per 100,000 living while the real data declined to 0.70. This difference suggests that there was a decline already occurring but that the factors responsible were not sufficient to fully control the disease. However, when streptomycin was introduced the mortality rate had already declined by 90%. The rate decreased from 381 per 100,000 in 1838 to 40 in 1946.
As in Switzerland, streptomycin was available in 1947 in New York (Fig. 8). The raw data were used (i.e. not Fig. 9) for the extrapolation because the logistic fit chosen was for 1922 to 1950. The logistic fit of the data before this was not important for the extrapolation (i.e. the section that was modified in Fig. 9). The rate of decline after this time was 0.025 (equation (ii) above). The data did not significantly alter with the introduction of antibiotics, so there was no need to modify the logistic fit. However, in 1950, the real and modelled data do differ slightly in terms of actual rate. The modelled data predicted a rate of 38 per 100,000 in 1950, while the real data show a rate of 29. When streptomycin was introduced in 1947, the mortality rate had already declined from 350 per 100,000 in 1878 (687 in 1803) to 42 in 1946. This is a decline of 88%. This suggests that although streptomycin did not make a significant impact on the mortality rate during its introduction, it still was aiding the decline already occurring.
Discussion
The decline of tuberculosis
In Switzerland, England and Wales and the United States (New York), the decline of mortality due to TB was continuous and steady throughout a period of more than 100 years. Medical intervention in the form of pharmacotherapies, including the antibiotic streptomycin, was not responsible for the majority of the decline. Mortality rates in Switzerland, England and Wales and the United States (New York) had declined by 71%, 90% and 88%, respectively, before the introduction of streptomycin. There was no specific event that was responsible for the majority of the decline; instead it was a combination of many smaller changes in public health and disease control.
In Japan, mortality did not decline from an originally high level as was observed in Switzerland, England and Wales and in the United States (New York). Instead, the mortality increased from an originally low level, which would be associated with an increasing level of industrialization at this time. During the 1930s, the Great Depression affected the living conditions of the Japanese, resulting in an increase in TB mortality. This occurred just before World War II, which resulted in a continuation of the same trend. It was not until after the war, when anti-TB drugs were introduced, that TB in Japan was reduced to low mortality rates and controlled. Thus in Japan, the decline in TB mortality was largely due to the implementation of drug therapy for the disease. It could be postulated that the improvements in sanitation and living conditions in post-war Japan may have lowered TB mortality rates even without the introduction of pharmacotherapies, but it is impossible to separate the effects of these measures from those of chemical intervention.
In Brazil, drug therapy was the major factor in the decline of TB mortality, though the data show a slow decline approximately halving mortality rates between the end of the 19th century and the time pharmacotherapies became available. Then when drug therapy was introduced, mortality declined quickly within several years. The shape of this mortality decline is not observed for Switzerland, England and Wales, or, New York (United States) indicating that the major factors in the decline in TB mortality were different from medical intervention in those countries. Sierra Leone shows the data for a country where TB is becoming a major health problem. This trend would probably have been observed for Switzerland, England and Wales and the United States in earlier years not captured by the sources of information used.
Logistic fitting
Logistic curves were fitted to the mortality data for Switzerland, England and Wales and the United States (New York) and all had R 2 values above 0.97, indicating a good fit. This also indicates that the decline of TB mortality followed a logistic pattern. One single logistic equation was not satisfactory for a good fit and consequently multiple equations were needed. This indicated that multiple processes of decline in TB mortality were operating during different years. In the years at the beginning of the study data, it may be expected that implementation of public health reforms addressing hygiene, nutrition, living conditions, etc. were the reason for the mortality decline. The mortality decline associated with drug treatment was in some cases substantially faster than for conservative methods and public health, but both had clear effects on the decline in mortality rates. Extrapolation of the models to exclude the influence of antibiotics showed that the mortality decline would have continued into the 21st century, even without the introduction of pharmacotherapies. However, the mortality rates declined quicker and reached lower values with antibiotic therapy.
Limitations of the study
One limitation of this study is the reliance on historical records. However, it includes data from multiple countries over a number of years, all of which show the same trend over time. These data also include years when TB notification was compulsory and the records can be considered reasonably accurate during these time periods.
One other limitation of this study is the change in cause of death nomenclature through time. The disease has been recorded under many names including ‘tuberculosis’, ‘phthisis’ and ‘consumption’. Non-pulmonary TB has been known by multiple names including ‘scrofula’ and ‘King's Evil’. However, the nomenclature was defined by the ICD codes for causes of death in 1900, which was used by all Western as well as some Eastern countries (including Japan). Thus this limitation is only a concern before this year while much of the decline in TB mortality occurred during the early years of the 20th century.
Another problem with this study is the difficulty in differentiating the factors responsible for the mortality decline. Each factor cannot be distinctly assessed for its role in the mortality decline because the data provide only an overview of the effects of all factors operating at that time.
Conservative measures and public health interventions can help to control TB
It is shown here that pharmacological interventions were not responsible for the majority of the decline in TB in Switzerland, England and Wales and the United States (New York). Instead, conservative and public health measures were effective in reducing the mortality from TB. This is even despite the obvious problems with compliance and efficiency of the introduction of various public health measures. Hygiene/sanitation and availability of proper health care were not uniformly distributed in the 19th and early 20th centuries. This is shown by data from Drolet & Lowell (Reference Drolet and Lowell1952), describing the differences in mortality rates for different areas of New York between 1900 and 1950. This is also true for many other cities in this time period. Clearly, however, even partly ineffective implementation of conservative measures and public health can help to control TB and this can be used in situations where TB is currently at high levels. Conservative methods and public health will also be effective at controlling drug-resistant TB, as pharmacotherapeutics are not the focus of treatment.
However, phamacotherpeutics can be used to aid the control of TB as they can help break transmission of the disease. Overall, as suggested by McKeown (Reference McKeown1976), a reduction in prevalence will result in a lower level of exposure and transmission, which, in the case of airborne infections, is the most important part of controlling the disease. The only concern with using drug therapies as a major part of a disease control programme is the development of drug resistance. This may be exacerbated by patient non-compliance. Unlike public health measures and conservative methods, drug therapy needs to be fully and efficiently implemented to be successful in controlling infections.
The World Health Organization initiated a ‘Stop TB Strategy’ in the 1990s when HIV began to appear, resulting in an increase in the global burden of TB. A large part of this strategy is the Directly Observed Treatment Short-Course (DOTS) regime. This involves five separate elements including additional funding allocation, improved detection of cases, standardized treatment where patients are assisted in finishing their anti-TB drug programmes, development and maintenance of a reliable system for providing anti-TB drugs and an improvement in the recording system for cases (World Health Organization, 2013). These elements, while important, do not address the patient's current environment such as poor living conditions and nutrition. Consequently, many of these patients may receive a full course of anti-TB therapy, but may not be cured or may relapse. With the addition of conservative measures as well as public health interventions, many cases of TB may be curable and many others preventable. The results from this combination of treatments are shown by the data from Japan and Brazil. There is a rapid reduction in TB mortality due mostly to pharmacological interventions, accompanied by conservative measures and public health interventions.
Another problem with the DOTS strategy is the lack of active searching for cases. In all countries (except Brazil) described here, an Act or Law was introduced that required the recording and treatment of all TB cases. Switzerland introduced this in 1928, England and Wales in 1913, New York in 1897 and Japan in 1931. This type of health policy would be helpful to implement in developing countries where TB cases often go unnoticed until signs and symptoms have developed significantly. While DOTS does include assistance to patients for completing drug programmes through visits from nursing staff, the focus is solely on the treatment rather than the living standards of the patient. In New York, starting from 1939, nurses were required to visit the homes of diagnosed TB patients and addressed the patient's living conditions and social status to aid recovery (Drolet & Lowell, Reference Drolet and Lowell1952). Switzerland, England and Wales, New York and Japan all introduced a Housing Law or Public Health Act aimed at improving living conditions of all individuals. In 1901, New York outlined a specific set of criteria that every building needed to meet in order to be satisfactory as a living space. These included adequate lighting, ventilation, water supply, sanitary facilities and a fire escape (Drolet & Lowell, Reference Drolet and Lowell1952). In particular, the requirement of ventilation helped to prevent transmission of TB by dust particles in poorly ventilated areas. In addition to these housing laws, factory laws were also introduced in all countries studied here. These laws were aimed at improving the working conditions of those involved in industry. These changes were very successful in reducing mortality; Japan in particular saw a decrease in the mortality rate from TB in factory workers after the Factory Law in 1926 allowed them to commute from home (Johnston, Reference Johnston1995). The situation in Switzerland was different in that workers for common industries (e.g. cotton) had their work facilities installed in their own homes (Steinberg, Reference Steinberg1996). Child labour was used in Switzerland, but there was a restriction on the number of hours that a child could work and schooling was still compulsory.
In England and Wales and New York, segregation of individuals with TB began from the early 1900s, which helped prevent the spread of the disease in addition to improving ventilation of living spaces (Drolet & Lowell, Reference Drolet and Lowell1952; Fairchild & Oppenheimer, Reference Fairchild and Oppenheimer1998). Specific institutions were constructed, called sanatoria, for TB patients and treated patients using conservative measures such as improving nutrition through a high-quality diet, allowing the patient to rest and providing a well-ventilated and sanitary environment to reduce exposure to the pathogen (Roberts & Buikstra, Reference Roberts and Buikstra2003; Warren, Reference Warren2006).
Gross domestic product (GDP) can give an indication of the level of economic success and standard of living in a country. GDP per capita was very similar in Switzerland, England and Wales and the United States for 1900–1950. In Switzerland, GDP per capita increased from 3833 to 4314 and finally to 9064 (all units: 1990 International Geary-Khamis dollars) over the years 1900, 1920 and 1950 (Maddison, Reference Maddison2003). Comparative values for the UK are 4492, 4548 and 6939 dollars for 1900, 1920 and 1950, respectively. For the US, the values are 4091, 5552 and 9561 dollars. When these values are compared with Japan and Brazil, there is a large difference. In Japan, GDP per capita for 1900, 1920 and 1949 was 1180, 1696 and 1800 dollars, well below the levels of Switzerland, England and Wales and the United States. In Brazil, the values are 678, 963 and 1672 dollars. Economic success plays an important role in disease prevention because it provides the necessary resources to improve infrastructure and the community. These values show that Switzerland, England and Wales and the United States had higher economic success compared with Japan and Brazil, which is reflected in a slower decline of TB mortality in the latter.
Public education was also very successful in reducing the overall burden of the disease because TB patients were able to help control the disease by educating others (Drolet & Lowell, Reference Drolet and Lowell1952). Implementation of public health policies was widespread throughout all countries described here and were all aimed at improving living conditions of the entire population. These polices have been proven to be very effective in aiding the decline of TB by providing a higher standard of living and hence an improvement in the general level of health, allowing individuals to better combat infectious pathogens. If these types of policies can be implemented in developing countries, the DOTS strategy can be more effective and the risk of relapse can be reduced.
Conclusion
The decline in TB mortality during the 19th and 20th centuries in Switzerland, England and Wales and the United States was largely due to a combination of conservative measures (rest, good nutrition, ventilation, etc.) and public health interventions (addressing hygiene, nutrition, reducing exposure to infections and education about TB). The introduction of anti-TB drug therapy played a small role in the mortality decline in these countries. In Switzerland, 80% of the decline in TB mortality had occurred before the introduction of streptomycin. In England and Wales and New York, the declines were 90% and 88% complete, respectively, before anti-TB therapies. Antibiotics were effective in combination with conservative measures and public health interventions in Brazil and Japan, suggesting that different strategies can reduce mortality from TB, depending upon the local situation. Pharmacotherapies can be useful to reduce mortality due to TB, but must be implemented efficiently in order to prevent resistance. With regard to drug-resistant forms of TB it should be recommended to use the time-honoured and proven methods of increasing general immunity and implementing conservative measures as well as public health interventions in addition to the expensive and short-lived chemical therapies aimed at killing germs that have already entered the bodies of patients. These conservative measures and public health interventions have been proven to be effective, even when not implemented at full efficiency. Improving the economies and public health policies of TB-infested countries is a life-saving imperative.
Acknowledgments
Information derived from historical records was accessed at the StadtArchiv and Staatsarchiv (Zürich) and the staff at these organizations are acknowledged for their assistance with locating the records of interest. This research is supported by the Australian Postgraduate Award, Dorothy and Walter Duncan Trust Award, School of Medical Sciences Postgraduate Travel Award, Research Abroad Scholarship, Faculty of Health Sciences Postgraduate Travelling Fellowship, University of Adelaide, and the Mäxi Foundation Zürich. The authors wish to express no conflicts of interest.