Introduction
Grandparents increasingly take on an important role for their families (Hoff Reference Hoff2007; Silverstein, Giarrusso and Bengtson Reference Silverstein, Giarrusso, Bengtson, Bengtson and Lowenstein2003), often satisfying the demand for child care (Aassve, Arpino and Goisis Reference Aassve, Arpino and Goisis2012; Arpino, Pronzato and Tavares Reference Arpino, Pronzato and Tavares2014). In Europe, 58 per cent of grandmothers and 50 per cent of grandfathers provide care to their grandchildren (see Glaser et al. Reference Glaser, Ribé Montserrat, Waginger, Price, Stuchbury and Tinker2010 for a review). Despite the apparent common trend, however, differences across European countries emerge when considering the extent to which grandparents actively engage in caring for their grandchildren. In Mediterranean countries, when grandparents look after grandchildren they often do it on a daily basis. However, if one considers the percentage of grandparents engaged in child care with any frequency, the highest rate in Europe is found in Northern countries (Hank and Buber Reference Hank and Buber2009). So, grandparents play very different roles across Europe. This is reflected in previous studies showing that for about one in two pre-teens in Italy, grandparents are perceived as the main providers of care (after the parents) (Keck and Saraceno Reference Keck, Saraceno, Leira and Saraceno2008). Instead, in the Nordic countries grandparents represent a reserve army of support, ready to step in when needed (Hagestad Reference Hagestad2006), while in most of the Western European countries child-care provision by grandparents is mainly understood as complementary to public services, as suggested by Geurts et al. (Reference Geurts, Van Tilburg, Poortman and Dykstra2015) for the Netherlands.
This heterogeneity in the role of grandparents as providers of child care may be related to the policy context and to the institutional aspects of female labour force participation. Previous studies show that in countries where formal child-care coverage is minimal, such as Mediterranean countries, it is the family (mostly the women within it) that bears the main care responsibilities (Saraceno and Keck Reference Saraceno and Keck2010). Other countries, such as Germany or Austria, despite the male breadwinner-oriented policies, have more developed services to families. These countries do not have labour markets as flexible as those of Northern Europe, but there part-time employment among women is common because the state has developed a family policy based on the family and not on the individual (Saraceno Reference Saraceno2008).
Therefore, the aim of this paper is twofold. First, avoiding somewhat arbitrary country grouping and going beyond the usual North–South divide, we assess how existing policies as well as availability of part-time jobs for women relate to patterns of grandparental child care across different European countries. In particular, we draw on the classification of policy contexts in three models concerning the division of intergenerational responsibilities between the state and the family (defamilialisation, familialism by default, supported familialism) (see Keck, Hessel and Saraceno Reference Keck, Hessel and Saraceno2009; Saraceno and Keck Reference Saraceno and Keck2010). Thus, we relate grandparental child care to two key policy indicators focusing on the so-called ‘early care gap’ (Saraceno and Keck Reference Saraceno and Keck2011). With this term we refer to the responsibility to care for children left to families net of effective parental paid leave and the availability of child-care services. Second, we build on previous research that has found that grandparental child care helps women to combine motherhood and paid work (Aassve, Arpino and Goisis Reference Aassve, Arpino and Goisis2012; Arpino, Pronzato and Tavares Reference Arpino, Pronzato and Tavares2014; Geurts et al. Reference Geurts, Van Tilburg, Poortman and Dykstra2015). We show for the first time how the different provision of grandparental child care to working versus not-working mothers differs across contexts characterised by different family policy models and degree of flexibility of the female labour market in terms of part-time jobs. In doing so, the article does not discuss individuals' preferences, but aims to shed light on how family policies and female labour market conditions relate to patterns of grandparental child care across Europe.
Our empirical analyses are based on data from the Survey of Health, Ageing and Retirement in Europe (SHARE), integrated with information about country-specific policy characteristics, drawn from the Multilinks database (Multilinks 2011). We consider 12 countries that are included in both SHARE and Multilinks: Austria, Belgium, Czech Republic, Denmark, France, Germany, Greece, Italy, the Netherlands, Poland, Spain and Sweden.
In the next section, we review the relevant literature on grandparental child care and family policies in Europe as well as on the association between grandparental child care and female labour force participation. The following section presents data and methods of analysis. We then show the results and discuss them in the concluding section.
Background
Grandparental child care and family policies in Europe
Given the differences across European countries in grandparental child care, it is clear that welfare and its embedded policies are potentially important keys of explanation for the different role assumed by grandparents in the various contexts (Albertini, Kohli and Vogel Reference Albertini, Kohli and Vogel2007; Di Gessa et al. Reference Di Gessa, Glaser, Price, Ribe and Tinker2015; Hank and Buber Reference Hank and Buber2009; Igel and Szydlik Reference Igel and Szydlik2011). The literature postulates two opposite scenarios. Assuming that family solidarity is only provided if such a demand is not satisfied by formal services, Cox and Jakubson (Reference Cox and Jakubson1995) suggest that a strong welfare arrangement may replace family services and thus ‘crowd out’ intergenerational solidarity (see also Künemund and Vogel Reference Künemund and Vogel2006). However, family ties are not solely based upon functional necessities, but also driven by reciprocity (Kohli et al. Reference Kohli, Künemund, Motel-Klingebiel, Szydlik, Künemund and Kohli2005) and ‘exchange expectations’ (Künemund and Rein Reference Künemund and Rein1999). Therefore, expansion of welfare services may instead stimulate – i.e. ‘crowd in’ – intergenerational solidarity (Daatland and Herlofson Reference Daatland, Herlofson, Lowenstein and Ogg2003; Daatland and Löwenstein Reference Daatland and Löwenstein2005; Künemund and Rein Reference Künemund and Rein1999). The more recently suggested concept of ‘mixed responsibilities’ reconciles these two hypotheses, showing that family and state provisions tend to interact (Attias-Donfut and Wolff Reference Attias-Donfut, Wolff, Arber and Attias-Donfut2000; Brandt, Haberkern and Szydlik Reference Brandt, Haberkern and Szydlik2009; Motel-Klingebiel, Tesch-Römer and von Kondratowitz Reference Motel-Klingebiel, Tesch-Römer and von Kondratowitz2005).
Our analysis complements those of Igel and Szydlik (Reference Igel and Szydlik2011) and Di Gessa et al. (Reference Di Gessa, Glaser, Price, Ribe and Tinker2015) who investigated grandparental child care across Europe. Igel and Szydlik (Reference Igel and Szydlik2011) showed that public expenditure for families crowds in the occurrence of grandparental child care and crowds out its intensity, supporting the ‘mixed responsibilities’ thesis. Di Gessa et al. (Reference Di Gessa, Glaser, Price, Ribe and Tinker2015) found that variation in grandparental child care across Europe is mostly explained by differences in female labour market structure and formal child-care provision. Differently from these previous studies: (a) we embed the analysis of the relationship between the policy context and grandparental child care within the familialism–defamilialisation framework (Keck, Hessel and Saraceno Reference Keck, Hessel and Saraceno2009; Saraceno and Keck Reference Saraceno and Keck2010); (b) at the country level, we consider not only family policies but also the role of female labour market characteristics – in particular, while also Di Gessa et al. (Reference Di Gessa, Glaser, Price, Ribe and Tinker2015) took into account female labour force participation, we consider the availability of part-time jobs for women; (c) we distinguish daily from weekly grandparental child care and we show that this difference is clearly associated with some country-features; (d) from a methodological point of view, we use ordinal regression models estimated separately by countries. We will discuss in more detail each of these points later in the paper.
Several authors (Korpi Reference Korpi2000; Leitner Reference Leitner2003; Leitner and Lessenich Reference Leitner, Lessenich, Clasen and Siegel2007; Saraceno Reference Saraceno, Knijn and Komter2004, Reference Saraceno2010; Saraceno and Keck Reference Saraceno and Keck2010) described a threefold conceptualisation of policies that identifies three different models of division of intergenerational responsibilities between the state and the family:
-
1. Defamilialisation is characterised by policies that partially relieve the family from its duties to provide hands-on care or financial support shifting care services to the state.
-
2. Supported familialism refers to policies that, usually through financial transfers (including taxation and paid leave), support families in keeping up their financial and caring responsibilities towards the younger and older generations.
-
3. Familialism by default, or unsupported familialism, refers to the absence of policy support and therefore is defined as a rather residual category encompassing everything which is left to the responsibility of the individual or family.
Drawing on this theoretical framework, we can gain insight into the role of grandparental child care in European countries and on the influence of country-level policies on the role of grandparents. We consider two policy indicators that have been previously used (e.g. Saraceno and Keck Reference Saraceno and Keck2010) to describe the position of countries with respect to the three ideal models described above.
We consider the provision of public child-care services to children age 0–2 years. Entitlement to receiving care reduces family responsibilities and dependencies and therefore countries with very high provision of care services can be described as defamilialistic. However, defamilialisation in the case of children is never total and it is not in contrast with intergenerational solidarity (e.g. Keck Reference Keck and Saraceno2008; Künemund Reference Künemund and Saraceno2008; Künemund and Rein Reference Künemund and Rein1999). In principle, defamilialisation may occur through both state and market provisions, but recourse to the market of services is inevitably mediated by family resources.
We use effective leave (including parental and maternity leave) as an indicator of supported familialism because it encourages parents to stay at home and take care of their children (Leitner Reference Leitner2003). This type of family-linked transfer supports families in keeping up their caring responsibilities at the intergenerational level. Those countries with the most generous effective leave policies are the closest to the supported familialism model.
Countries characterised by low offers of both services and paid leave impose that care of (young) children is mostly shouldered by the family. These countries are close to the familialism by default model. We will go back to this discussion in the Data and Method section when describing how European countries position themselves with respect to these three policy models.
We test how these policy indicators are associated with grandparental child care. We expect that the role of grandparents as providers of child care is more important in countries characterised by familialism by default, where both child-care services and provision of paid leave are scarce and therefore the ‘early care gap’ is high. In these countries grandparents will be intensively engaged in child care. In contrast, we expect to find no need for grandparental child care (at least not on a regular basis) in countries characterised by both defamilialistic and supported familialistic policies that reduce the ‘early care gap’. Countries characterised by either high services or paid leave (medium level of the ‘early care gap’) are expected to have an intermediate position in terms of grandparental child care (e.g. on a weekly rather than on a daily basis).
As previous studies have shown (e.g. Keck Reference Keck and Saraceno2008; Künemund Reference Künemund and Saraceno2008; Künemund and Rein Reference Künemund and Rein1999; Saraceno and Keck Reference Saraceno and Keck2010), defamilialisation does not stand in contrast to family solidarity and intergenerational feelings of responsibility. Grandparental child care is not only motivated by the need to cover policy deficiencies. It may derive from an intrinsic motivation to keep intergenerational contacts. Moreover, altruism may be an intrinsic motivation to provide care (and other resources) to family members to enhance or maintain the other person's wellbeing (Becker Reference Becker1974).
Some economic models have hypothesised that inter vivo transfers from older to younger generations have also an egoistic component (Cigno Reference Cigno1993). According to the self-interested exchange view, downward transfers may be motivated by the anticipation of future need and the hope that younger generations will be altruistic towards their (grand)parents in return (e.g. Laferrère and Wolff Reference Laferrère, Wolff, Kolm and Ythier2006). Grandparents’ motivation may also arise from considering the provision of child care as beneficial for grandparents’ health (e.g. Arpino and Bordone Reference Arpino and Bordone2014).
As noticed by Arpino, Pronzato and Tavares (Reference Arpino, Pronzato and Tavares2014), grandparental child care may depend on the grandparents’ willingness and ability to look after their grandchildren, but also on women's preference regarding the ‘externalness’ of child care (El-Attar Reference El-Attar2007). While the preference for taking care of the children themselves (the most internal type of child care) is mainly observed in contexts where family ties are strong and employment rates are low (Alesina et al. Reference Alesina, Algan, Cahuc and Giuliano2015), women with a stronger preference towards participating in the labour market form a heterogeneous group. Some working mothers might choose the next more internal child-care type, grandparental child care; others might trust the most external type of (formal) child care on the grounds of, for example, its benefits with respect to child development (Brilli, Del Boca and Pronzato in press).
‘Social conventions’ and expectations of grandparenthood nowadays play a rather marginal role as reasons for grandparental child care (Silverstein, Giarrusso and Bengtson Reference Silverstein, Giarrusso, Bengtson, Bengtson and Lowenstein2003) in comparison with ‘opportunity’ and ‘need structures’ in terms of, for example, young mothers’ employment; a topic we now turn to in order to consider the heterogeneity of contextual variability in grandparental child care by mothers’ working status.
Grandparental child care and women's labour force participation
Women's activity rates have substantially increased in all European countries over the last decades, contributing to an increasing need for external child care (Geurts et al. Reference Geurts, Van Tilburg, Poortman and Dykstra2015; Lewis et al. Reference Lewis, Knijn, Martin and Ostner2008). Yet, while about 85 per cent of Swedish and Danish women between 25 and 54 years old were employed in 2004 (i.e. at the time of the survey data we use), the corresponding figures for Italy (about 64%), Greece (67.7%) and Spain (69%) were the lowest among the countries considered. Western European countries had an in-between position, with about 75–81 per cent of women employed, similar to the Czech Republic and Poland.Footnote 1
Availability of part-time jobs partly explains between-country differences in female labour force participation (D'Addio and Mira d’Ercole Reference D'Addio and Mira d'Ercole2005). In the Mediterranean and Eastern European countries, women tend to polarise between working full-time and not working at all. On the contrary, Nordic countries are close to a full-time, dual-earner family model. In Germany, as well as in the Netherlands, relatively high participation rates have been driven by high availability of part-time jobs (Saraceno Reference Saraceno2008).
The different roles that grandparents take in different contexts can therefore also be related to the specific characteristics of the (female) labour market (Di Gessa et al. Reference Di Gessa, Glaser, Price, Ribe and Tinker2015). Previous studies show that grandparental child care is fundamental for women to juggle family and work (Aassve, Arpino and Goisis Reference Aassve, Arpino and Goisis2012; Gray Reference Gray2005), especially in countries where grandparents substitute (scarce) formal child care (e.g. Arpino, Pronzato and Tavares Reference Arpino, Pronzato and Tavares2014 for Italy). In other words, we can expect that working mothers in countries characterised by familialism by default have the highest need of grandparental child care. These countries also tend to be characterised by a low availability of part-time jobs. Therefore, it is plausible to assume that working mothers there seek an intensive (e.g. daily) provision of grandparental child care. On the other hand, working mothers in countries characterised by a high prevalence of part-time jobs, that also tend to be characterised by supported familialism, may need the intervention of grandparents with a lower frequency. Previous studies (e.g. Igel and Szydlik Reference Igel and Szydlik2011) have lumped together daily and weekly grandparental child care into ‘regular’/‘intensive’ child care. However, we argue that it is crucial to distinguish between daily and weekly provision. The motives behind a more-/less-intensive provision of grandparental child care may be different. In particular, both policy context and female labour market characteristics contribute to explaining the different prevalence of daily and weekly grandparental child care.
In our multivariate analyses, we test whether the frequency of grandparental child care is differently associated with mothers’ working status in different contexts. We focus on the dichotomy working versus not-working mothers for sample size reasons. In fact, although 13 per cent of the working women in our sample work part-time, this percentage varies considerably across countries and only in a few of them could we further distinguish between part-time and full-time working mothers. However, the variability in the prevalence of part-time jobs will be considered when interpreting the results.
We acknowledge that it is also possible that mothers participate in the labour market because of the availability of grandparents to care for their children. For example, in Scandinavian countries in our sample around 62 per cent of grandparents are not working, while in Italy, Greece and Spain the not-working grandparents are about 90 per cent. This variability in grandparents’ labour market participation reflects the variability of employment rates among older people (e.g. in 2004, 69% of Swedes aged 55–64 were working, while the corresponding figures for Italy and Spain were 30.5 and 41.2Footnote 2 ) and differences in the average effective age of retirement (as high as 65.1 among men and 62.4 among women in Sweden and as low as 58–59 for both women and men in Belgium, Poland and Austria in 2000–2005Footnote 3 ). Yet, in our analysis we control for the working status of the grandparent.
Data and method
Macro-level data
Policy indicators are drawn from the Multilinks database on intergenerational policies built by Saraceno and Keck (Reference Saraceno and Keck2008).Footnote 4 Entailing over 70 indicators on social policy rights and care-service usage, Multilinks is the only collection of consistent and comparable measures of intergenerational support established through existing policies that quantitatively describe social policies in Europe. The data for the indicators were collected through a variety of comparative and national sources, in many cases also with the help of national informants, and refer to the year 2004, which coincides with the year of the first SHARE round (see Saraceno and Keck Reference Saraceno and Keck2008 for the conceptualisation of the indicators; Keck, Hessel and Saraceno Reference Keck, Hessel and Saraceno2009 for the methodology and sources).
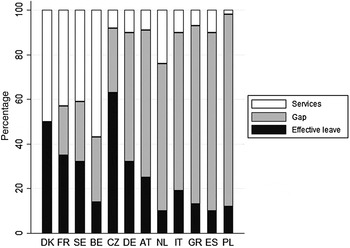
As anticipated above, we selected two indicators from Multilinks. Figure 1 shows the value of ‘services’ (white bars) and ‘effective leave’ (black bars) for each country considered. Both indicators are reported as percentage of time covered within the first three years of life of children (i.e. 156 weeksFootnote 5 ). ‘Effective leave’ considers the number of weeks of both maternity and parental leave, weighted by the level of compensation during leave time (Saraceno and Keck Reference Saraceno and Keck2008, further developing Plantenga and Remery Reference Plantenga and Remery2005). By providing a single measure of generosity of leave, it reduces cross-country complexity and allows for comparison between countries (Saraceno Reference Saraceno2011). For example, in Italy maternity leave is 20 weeks compensated at the 80 per cent of average income; while parental leave is 11 months (i.e. 47.14 weeks) compensated at 30 per cent of average income. The effective leave measure will therefore be equal to 30.14 (= 20 × 0.8 + 47.14 × 0.3). As the focus is on children in the age category 0–3 (156 weeks), this leave entitlement covers 30.14/156 weeks, that is about 19 per cent of the total time of care needed.
Effective leave, services and time of care left to families (gap), by country.

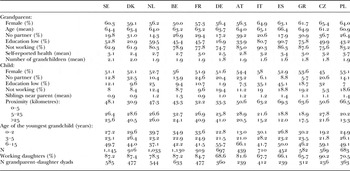
Descriptive statistics for the independent variables used in the regression analyses.

Notes: SE: Sweden. DK: Denmark. NL: the Netherlands. BE: Belgium. FR: France. DE: Germany. AT: Austria. IT: Italy. ES: Spain. GR: Greece. CZ: Czech Republic. PL: Poland.
Source: Own elaboration on the Survey of Health, Ageing and Retirement in Europe data.
Concerning child-care services, given the country's coverage rate, Saraceno and Keck (Reference Saraceno and Keck2008) calculated how many weeks a child could attend public child care if all children were enrolled. For example, in Italy the available time period for each child under age 3 would be about 17 weeks, therefore the coverage rate is around 10 per cent (of 156 weeks).
By adding the two measures of effective leave and services we obtain an estimate of the time of care covered by state support, the complement to 100 being the ‘gap’ left to family resources. In the case of Italy that would be: 100 − (19 + 10) = 71.
The grey bar in Figure 1 indicates an estimate of the ‘gap’ left to families in terms of the percentage of time they have to care for their children without state support. Countries are ordered in ascending order accordingly. The figure shows a larger burden for Mediterranean and Polish families (right side) as compared to their Scandinavian counterparts (left side), with Denmark even registering an overlap of services and effective leave. In the following, we shall refer to this gap as ‘early care gap’ because it concerns child care below the age of 3.
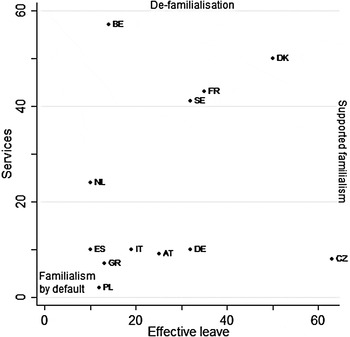
Figure 2 represents the countries under study in the space defined by the two policy indicators. It shows how close each country is to the three policy models described above (i.e. familialism, defamilialisation and supported familialism). In the bottom-left corner there are the closest countries to the familialism by default model: Poland and the Mediterranean countries (Greece, Spain and Italy). Countries in the other areas of the figure are characterised by a considerable part of the time to care for young children being taken up by the state either through child-care services or through paid leave (a low ‘early care gap’). The first policy option would correspond to the defamilialisation model (the more we move from the bottom to the top of the graph); the second to the supported familialism (the more we move from the left to the right side of the graph). Countries do not locate themselves perfectly in one of the three policy models and classifying them would be difficult, other than hiding some heterogeneity (see also Saraceno and Keck Reference Saraceno and Keck2010). For example, while Belgium seems to be mainly characterised by defamilialisation and the Czech Republic by supported familialism, Denmark, Sweden and France are characterised by a mix of the two. German-speaking countries and the Netherlands appear to be closer to the familialism by default model than to the other two typologies. However, they show either higher service coverage (the Netherlands) or more generous paid leave (Austria and Germany) than the Mediterranean countries and Poland.
Position of countries with respect to three ideal policy models: familialism by default, supported familialism and defamilialisation.

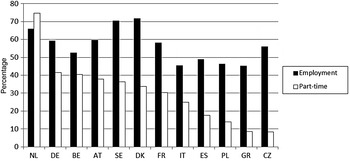
Additionally, we consider as a contextual factor female part-time employment. Figure 3 shows female employment rate (black bars) and share of part-time female employment on total female employment (white bars) in 2004. We can see that countries characterised by familialism by default (i.e. Mediterranean countries and Poland) are also those with the lowest female employment rates as well as share of part-time female workers. Sweden, Denmark and the Netherlands show the highest female employment rates among the countries considered, but the latter stands out in terms of part-time employment: more than 70 per cent of Dutch women who work do so part-time.
Female employment rate (black bars) and share of part-time female employment out of total female employment (white bars).

Individual-level variables
Our analysis is primarily based on SHARE. SHARE is a cross-national panel survey collecting micro-data on health, socio-economic status, and social and family networks of the non-institutionalised population aged 50 and older (Börsch-Supan and Jürges Reference Börsch-Supan and Jürges2005; Börsch-Supan et al. Reference Börsch-Supan, Brugiavini, Jürges, Mackenbach, Siegrist and Weber2005). Five rounds have been implemented so far. We use data from the first wave, collected in 2004, and the refresher sample from the second wave, in 2006. For the countries that entered the survey in the second wave, namely the Czech Republic and Poland, we use the 2006 sample. SHARE wave 3, so-called SHARELIFE, is a retrospective survey which does not include the main questionnaire. We did not use the fourth and fifth waves to avoid inconsistency with the year at which the policy indicators were collected in Multilinks, i.e. 2004. Our analysis focuses on the 12 countries that are included in both SHARE and Multilinks: Austria, Belgium, Czech Republic, Denmark, France, Germany, Greece, Italy, the Netherlands, Poland, Spain and Sweden.Footnote 6
Since we are interested in studying the probability of receiving help in child care from grandparents, our unit of analysis is each adult child of SHARE interviewees (i.e. the parent of the grandchild) who has at least one child still in need of care, i.e. below the age of 16 years (additional robustness check analyses were also carried out on the sub-sample whose youngest child is aged 10 or younger and results were very similar to those reported here). Given the selection of the computer-assisted personal instrument used for interviews in SHARE (Börsch-Supan and Jürges Reference Börsch-Supan and Jürges2005), we can create up to four grandparent–adult child dyads for each grandparent responding to the survey. Within the sample of SHARE respondents with at least one child, only less than 8 per cent have more than four children. We excluded those dyads where the grandparent reported disabilities at the time of interview as these may considerably reduce a person's probability to look after grandchildren. The resulting sample includes 9,275 grandparent–adult child dyads with at least one grandchild below age 16.
SHARE first asks the grandparents whether during the 12 months before the interview they have looked after any child of each of their children without the presence of the parents (yes; no). Those answering positively are then asked how often they engaged in grandchild care (almost daily; almost every week; almost every month; less often). Based on this information, we have constructed an ordinal dependent variable measuring the frequency of grandparental child care within the grandparent–adult child dyad with the following categories: never; less often than weekly; almost weekly; and almost daily.Footnote 7 When we consider the four categories separately, we label them as: ‘never’, less often’, ‘weekly’ and ‘daily’, respectively. When we cumulate daily and weekly child care and all frequencies of child care we use the labels ‘at least weekly’ and ‘any child care’. Therefore, ‘weekly’ does not include daily grandparental child care, while ‘at least weekly’ does.
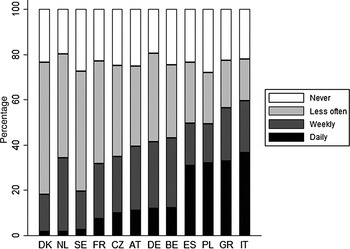
Figure 4 illustrates the distribution of the frequency of grandparental child care by country. In all the 12 European countries, only between 20 and 30 per cent of parents did not turn at all to grandparents to care for the own children in the year before the survey (the white part on the top of the bars). On the contrary, large differences across European countries appear when looking at the black part of the bars: while daily grandparental child care in Denmark, Sweden and the Netherlands is observed only in about 2 per cent of the cases, about 35 per cent of Italians in our sample benefit from grandparental child care on a daily basis. A high prevalence of weekly grandparental child care characterises Western European countries, with about 20–30 per cent of parents benefiting from grandparental child care on a weekly basis. Nordic countries are characterised by the largest proportion of parents turning to grandparents for child care on a less-often-than-weekly basis. Among the Eastern European countries, the Czech Republic behaves similarly to Western European countries and Poland looks similar to the Mediterranean ones.
Frequency of grandparental child care, by country.

In the multivariate analysis, we control for several demographic and socio-economic characteristics of the three generations involved in grandparental child care. Concerning grandparents, we control for gender, age, age squared, marital status (1 if the grandparent lives alone; 0 if living with a partner), education (0–2 low International Standard Classification of Education (ISCED); 3–6 middle-high ISCED), self-perceived health (ranging from 1 excellent to 5 poor) and employment status (1 if the grandparent is working; 0 otherwise). The characteristics considered for the middle generation are gender, marital status (1 if living alone; 0 if living with a partner), education (0–2 low ISCED; 3–6 middle-high ISCED) and employment status (1 if not working; 0 otherwise). To account for the fact that for an adult child the probability of benefiting from grandparental child care can be limited by the presence of siblings’ children, we control for the total number of grandchildren of the grandparent in the dyad, as well as for the number of siblings (of the child) living sufficiently close to the grandparent (i.e. within 25 kilometres (km)) potentially to ask for support. Additionally, geographical proximity within the child–parent dyad is included (less than 5 km – including dyads living in the same house(hold); 5–25 km; more than 25 km).Footnote 8 Unfortunately, the information on grandchildren is quite limited in SHARE. However, we are able to control for the age of the youngest grandchild within each grandparent–adult child dyad (0–2; 3–5; 6–15 years old). Given that the need for care is more important in the first years of life, the age of the youngest child is expected to be a driving factor of the probability to receive help in child care from grandparents. Table 1 shows the distribution of the independent variables in our working sample by country.
The second part of the analyses focuses on the sub-sample of grandparent–daughter dyads and on the differences between those where the daughter is working and those where she is not. The bottom rows of Table 1 show the percentage of working daughters and sample sizes by country.
Method
Our dependent variable is categorical, where the categories can be ordered according to the frequency of grandparental child care: never; less often than weekly; weekly; and daily. Therefore, we use a generalised ordered logit model to estimate the probability to receive help in child care from grandparents with different levels of frequency:
 $$P(Y_i \gt j) = \displaystyle{{\exp (\alpha _j + X_i \beta _j )} \over {1 + \exp (\alpha _j + X_i \beta _j )}}$$
where j = 1, 2, 3 indicates the frequency levels of grandparental child care (from 1 = no child care to 4 = daily). The generalised ordered logistic model is the most flexible model for analysing ordinal responses and can be considered an extension of the multinomial regression model (Greenland Reference Greenland1994). In fact, this model, differently from a multinomial regression, takes into account the ordinal nature of the outcome variable; while, similarly to a multinomial regression, it does not force the effect of covariates to be the same for the various categories.
Given that our unit of analysis is the adult child and that there may be up to four adult children for the same older respondent, we control for the within-family correlation by estimating robust standard error clustered at the respondent level (the grandparent).
We implement separate country-specific analyses. Similarly to Schenk, Dykstra and Maas (Reference Schenk, Dykstra and Maas2010), because of the small number of countries, we do not use multilevel modelling which might lead to biased estimates (see e.g. Moineddin, Matheson and Glazier Reference Moineddin, Matheson and Glazier2007). To assess the association between country-level policies and frequency of grandparental child care, we calculate predicted probabilities and marginal effects and estimate their association with policy indexes from Multilinks and with the share of female part-time employment.
Results
Grandparental child care and policies
We start by analysing how frequency of grandparental child care varies by country. To this end, we estimate separate generalised ordered logit regressions by country (complete estimates are available on request). To ease interpretation of results, we calculate predicted probabilitiesFootnote 9 of benefiting from grandparental child care at different frequency levels for adult children whose youngest child is aged 0–2. This focus is motivated by the fact that our policy indicators are more relevant to measure the uncovered need of care for very young children. While this makes it not necessary to account for characteristics of the school systems, we acknowledge that the results may not extend to grandparental child care in general. All other variables are kept at the observed values and predictions are averaged by country. This means that when calculating the predictions, the true (observed) value for each of the covariates for each person in a country sample is substituted in Equation (1) instead of using the average value of covariates, as often done. This allows us to estimate predicted probabilities using the observed distribution of each variable in each country sample rather than for a hypothetical (‘ideal type’) person with ‘average’ characteristics. By estimating separate models by country, we take into account non-homogeneity in the distribution of covariates and of their effects on grandparental child care across countries.
Figure 5 shows how the predicted probability of grandparental child care provided with different frequency is associated with the policy indicators we focus on and with female part-time employment. Panel (a) refers to daily grandparental child care, while panel (b) refers to weekly grandparental child care. Panels (c) and (d) refer to less than weekly and no grandparental child care, respectively. Countries are located in the plan according to their level of services (y-axis) and effective leave (x-axis), as in Figure 2. As we move from the bottom to the top of the graph, the coverage level increases, moving towards defamilialisation. As we move from the left to the right, the level of effective leave increases, moving towards supported familialism. The size of the circles is proportional to the predicted probabilities of benefiting from grandparental child care and it is comparable across the four panels of Figure 5: the larger the area, the higher the probability.
Predicted probabilities (proportional to circles’ areas) of (a) daily, (b) weekly, (c) less often and (d) no grandparental child care by three policy indicators: services (y-axis), effective leave (x-axis) and female part-time employment (markers).
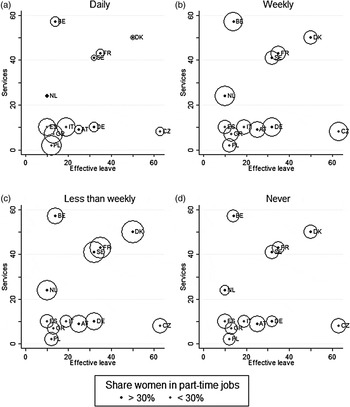
A clear association between grandparental child care and the policy context emerges. Figure 5a shows that in countries positioned in the bottom-left corner (i.e. Mediterranean countries and Poland), with low state support and characterised by familialism by default, the predicted probability of grandparental child care on a daily basis is the highest (large circles), with values around 40 per cent, the maximum being 41.7 per cent for Poland. For all the other countries, characterised by higher state support on at least one of the two dimensions, the predicted probabilities of daily grandparental child care are much lower (small circles), the minimum being 1.9 per cent for the Netherlands. The differences between the predicted probability of daily grandparental child care for Poland and Mediterranean countries, on the one hand, and those of the other countries, on the other hand, are statistically significant at the 5 per cent. In fact, none of the 95 per cent confidence intervals for countries in the first group (Mediterranean countries plus Poland) overlap with any of the confidence intervals for the other countries. Among the countries characterised by familialism by default there are no statistically significant differences in the probability of daily grandparental child care (complete values of the predicted probabilities are available on request).
Interestingly, a different pattern emerges from Figure 5b where the probabilities are calculated for weekly grandparental child care. Some countries with small circles in Figure 5a (i.e. low values of daily grandparental child care) now show relatively large circles (i.e. high values of weekly grandparental child care). The clearer example is the case of the Netherlands that has the lowest predicted probability of daily grandparental child care but shows the highest probability of weekly grandparental child care (42.1%) among the countries considered. A similar pattern is observed for Belgium, Czech Republic and Germany (41.4, 41.2 and 37.3 per cent, respectively). The predicted probabilities of weekly grandparental child care for these four countries are significantly higher (at the 5% level) than those for each of the other countries. The only exception is Austria that shows a predicted probability of weekly grandparental child care of 28 per cent but its confidence interval overlaps with those of Germany and the Czech Republic. We notice that the Netherlands, Belgium, Czech Republic and Germany are characterised by an intermediate position between familialism by default countries and countries with both presence of defamilialisation and supported familialism, i.e. they have medium levels of ‘early care gap’ (see also Figure 1).
The ‘less often’ category of grandparental child care (Figure 5c) is a sort of complement to the ‘daily’ and ‘weekly’ options: in those countries where the policy context does not favour/stimulate an intensive involvement of grandparents in the care of their grandchildren, their involvement tends to be sporadic but with high probability. In this case, France, Sweden and Denmark show the highest probabilities (48.4, 52.8 and 55.4%, respectively). These are significantly higher (at the 5% level) than the values estimated for all the other countries with the exception of the Netherlands. This indicates that in these contexts there is no need, in general, for an intensive engagement of grandparents, who constitute a ‘reserve army’ rather than a ‘regular army’ (Hagestad Reference Hagestad2006). We notice from Figures 1 and 2 that France, Sweden and Denmark have the lowest levels of the ‘early care gap’ and are characterised by both defamilialisation and supported familialism policies.
The ‘never’ category (Figure 5d), instead, does not show a clear association with the policy variables. In this case the estimated predicted probabilities are similar across countries and differences among them are usually not statistically significant at the 5 per cent level. This indicates that the probability of not providing any grandparental child care is not explained by the policy context and it may mostly depend on micro-level factors such as health of grandparents, distance between grandparents and grandchildren, etc.
Grandparental child care and female participation in the labour market
We now turn to testing whether the frequency of grandparental child care is differently associated with mothers’ working status in different contexts. As for the role of the share of part-time jobs for women, we notice that the countries where daily grandparental child care is more common are those characterised by the lowest percentage of women working part-time (grey dots in Figure 5 indicate countries with the lowest shares of part-time jobs, i.e. values between 8 and 25%). Since in these countries when women work they usually do it full-time, this result indicates a need for full-time engaged grandparents. Interestingly, countries with the highest proportions of weekly grandparental child care have the highest availability of part-time jobs. In particular, among the countries considered, the Netherlands shows the highest proportion of women working part-time (74.7%, see Figure 3) and the highest proportion of weekly grandparental child care (42.1%, see Figure 5b). Germany and Belgium also have both a high share of female part-time jobs and weekly grandparental child care probabilities. The Czech Republic is an exception to this association, as it shows a low share of female part-time jobs, but high frequency of weekly grandparental child care.
Our results indicate that daily grandparental child care prevails in contexts where policies are less generous and the female labour market is less flexible. This corroborates the idea that a very intensive involvement of grandparents in young children care is motivated by a need of working mothers. To provide further evidence to this hypothesis, we tested whether the provision of grandparental child care to working women is heterogeneous across contexts. To this end, we estimated a second set of regression models where we selected only grandparent–daughter dyads (complete estimates are available on request). The sample sizes are considerably lower than before and estimates should be interpreted with more care. We had to drop Austria from this analysis because of a particularly low number of working women in the sample (49).
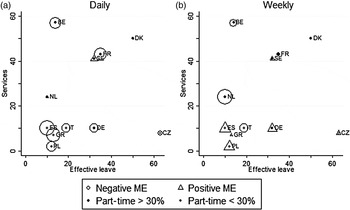
As before, to ease interpretation of the results we calculate predicted probabilities for different frequencies of grandparental child care, by country and working status of the female adult child considered. In Figure 6 we present the marginal effects (MEs) of women's working status on the probability of receiving daily or weekly grandparental child care. The ME in this case is simply the difference between the probability of daily (or weekly) grandparental child care for not-working women and that for working women. A negative value (indicated with a circle) means that working women receive more grandparental child care. Positive MEs (higher probabilities of grandparental child care to not-working women) are indicated with triangles. Circles and triangles are proportional to the size of the ME (absolute value) and are comparable across the two panels of Figure 6. We do not consider the predicted MEs for the categories ‘less often’ and ‘never’ because, as hinted at by panels (c) and (d) of Figure 5, we did not expect them to be associated with women's working status.
Marginal effects (ME) of daughters’ working status on grandparental child care on a (a) daily and (b) weekly basis by country.

The results of Figure 5 showed that the level of daily grandparental child care was highest in Poland and Mediterranean countries, i.e. the countries characterised by familialism by default. Figure 6a shows that in these countries the MEs are negative, meaning that daily grandparental child care is more common for working than for not-working mothers. In particular, the MEs are highest and statistically different from 0 at the 5 per cent level in Spain and Greece. The probability of receiving daily grandparental child care for working mothers is 26 percentage points (pp) higher than for not-working mothers in Spain and 20 pp in Greece. Although the estimated MEs are also negative for Italy and Poland, given the large confidence intervals they are not statistically significant.
We notice that the MEs are negative and statistically significant also for Germany, Belgium and France (16, 13 and 10 pp, respectively). Therefore, even though in these countries more oriented to defamilialisation and familialism by default less women receive daily grandparental child care than in the Mediterranean countries, working mothers are more likely to receive it than not-working mothers.
Figure 6b shows the MEs of women's working status on the probability of receiving weekly grandparental child care. In this case, the only statistically significant ME is that for the Netherlands. Its negative value (−26 pp) indicates that Dutch working mothers are 26 percentage points more likely to receive weekly grandparental child care than their not-working counterparts. This result may be explained by the already noted highest share of women part-time employment in the Netherlands.
Discussion
Socio-demographic changes of the family in modern societies have driven the attention towards three-generation interactions, emphasising the role of grandparents as an important source of help for their (grand)children. In this work, we assessed how family policies and female labour market conditions relate to patterns of grandparental child care across European countries. In particular, drawing on the classification of policy contexts in three models concerning the division of intergenerational responsibilities between the state and the family (defamilialisation, familialism by default, supported familialism) (see Saraceno and Keck Reference Saraceno and Keck2010), we relate grandparental child care to two key policy indicators: public services offered for child care and effective parental leave.
Avoiding somewhat arbitrary country grouping and going beyond the usual North–South divide, we estimated separate ordinal regression models on 12 European countries using comparable micro data from SHARE complemented with macro indicators on child-care services and effective leave from the Multilinks database and data on the share of female part-time jobs from Eurostat.
With an ordinal model we were able to analyse simultaneously different frequencies of grandparental child care and avoid lumping together daily and weekly grandparental child care into ‘regular’ child care as done in previous studies. In this way, our results clearly showed the existence of three different models of grandparental child care associated with different contexts. In the first model identified, represented by countries characterised by familialism by default (i.e. Mediterranean countries and Poland), when grandparents provide child care they do it daily. On the contrary, in countries with low ‘early care gap’ (i.e. Nordic countries and France) grandparents take on a secondary role, intervening when needed. In these countries, characterised by the presence of both defamilialisation and supported familialism policies, and therefore by a low ‘early care gap’, the probabilities of both daily and weekly grandparental child care are low. Indeed, the availability of public child-care services and generous parental leave lighten the need to turn to grandparental child care on a regular basis.
A third intermediate model is represented by most of the Western European countries and the Czech Republic, where grandparents are strongly involved in child care but with a lower frequency than in the first model and higher than in the second, i.e. usually on a weekly basis. In these countries, characterised by levels of policy support that are in-between the other two models, grandparental child care is complementary to public policies rather than substituting them.
As noted by Saraceno and Keck (Reference Saraceno and Keck2010: 675), ‘contrary to widespread opinion, supported familialism and defamilialisation are not always contrasting policy approaches’ and countries usually adopt a mix of them. Our results show that what matters in influencing the frequency of grandparental child care is not so much the type of policy adopted but the level of ‘early care gap’ attained.
The three models identified also tend to be characterised by different female labour market characteristics. In principle, one could expect stronger needs where the percentage of women in the labour force is higher. But this is not the case. In countries with the highest female labour force participation, both daily and weekly grandparental child care are the lowest. These are the Nordic countries and France where the ‘early care gap’ is low. In the other countries, when women want to participate to the labour market they often need to rely on regular involvement of grandparents in child care. In particular, we find a positive association between share of female part-time jobs and weekly grandparental child care. The prototypical example is given by the Netherlands, where a combination of a high offer of child-care service and female part-time jobs is paired with a high prevalence of weekly grandparental child care.
The need for daily involvement of grandparents in Mediterranean countries and Poland, on the contrary, can be explained by a large ‘early care gap’ but also by the low availability of part-time jobs: there, if women work they usually do it full-time.
To corroborate further the idea that the highly intensive involvement of grandparents in countries characterised by familialism by default is mainly motivated by the mothers’ need (unmet by the welfare) to combine work and family, we estimated the difference in the probability of receiving daily or weekly grandparental child care for working and not-working women (marginal effect of working status on grandparental child care). Overall, these results support the idea that intensive grandparental child care is highly related to women's needs to combine motherhood and work. In fact, when marginal effects for daily or weekly grandparental child care were statistically significant, they were negative, indicating a higher need of intensive grandparental child care for working mothers than for their not-working counterparts. Moreover, the highest values of the marginal effects for daily grandparental child care were found for Spain and Greece which are among the countries with the highest levels of ‘early care gap’ and the lowest levels of female part-time jobs. In these countries working women are about 20 percentage points more likely to receive daily grandparental child care than not-working women. In the Netherlands we found a similar gap with respect to weekly grandparental child care, confirming that in the Dutch context the involvement of grandparents is needed on a less intensive, though still regular, basis.
We can therefore conclude that there is a clear association between the policy context and the frequency of help with child care that parents receive from grandparents. The impact of the policy context on grandparental child care appears to be stronger for working mothers, who presumably try to balance a working career with family life. The evidence presented here highlights the need to consider three-generation intergenerational relationships when framing retirement policies aiming at increasing retirement age, employment policies pointing to an increase of women in the labour force, as well as policies planning for child and elderly care.
Our focus was on the association between some selected country-level factors and grandparental child care. As explained in the background section, grandparental child care is not only motivated by the need to cover policy deficiencies. Altruism, motivation to keep intergenerational contacts, but also self-interested exchange as well as women's preference regarding the ‘externalness’ of child care may be (intrinsic) motivations to provide care to family members. We acknowledge that our results would be biased in the presence of other important country-level factors, for example if individual motivations for organising child care correlate with the country-level policy variables. This would be the case if countries where effective leave and services were higher were also those where familialistic values were weaker. However, it is very difficult, if not completely hopeless, to try to establish what came first between values and policies and in this paper we do not aim to establish causality between them. Therefore, our results should be interpreted with care. They may imply that in contexts where policies are lacking there is more need for child care, but such association may also reflect more willingness to look after grandchildren because of more familialistic values (Dalla Zuanna Reference Dalla Zuanna2001; Jappens and Van Bavel Reference Jappens and Van Bavel2012). Unfortunately, SHARE has very limited availability of measures of preferences and family values. For example, questions about parents’ and grandparents’ duties are asked only to a sub-sample in the so-called drop-off questionnaire.
An interesting avenue for future research may consider mothers’ education as an additional explanatory factor of their likelihood to seek grandparents’ help in child care. Higher-educated women tend to have higher income that enables them to afford formal child-care services. Moreover, they are exposed to stronger geographical mobility than their lower-educated counterparts (Bordone Reference Bordone2009) and they are also more likely to hold positive attitudes towards external sources of child care. This would suggest higher-educated women to be less likely to seek help from grandparents for child care (as found by Arpino, Pronzato and Tavares Reference Arpino, Pronzato and Tavares2014). However, higher-educated women are more likely to work (and to be employed full-time) than their lower-educated counterparts (Aassve, Arpino and Goisis Reference Aassve, Arpino and Goisis2012; Bordone and Rosina Reference Bordone and Rosina2013). Therefore, they may seek more help within the family for child care, especially in contexts where child-care services are scarce. In low ‘early care gap’ countries, policies are well developed to support working mothers; on the contrary, the scarce level of services in the high ‘early care gap’ countries makes it necessary for most working women to seek help from grandparents for child care. In middle ‘early care gap’ countries, however, higher-educated working women may make more use of daily grandparental child care than their lower-educated counterparts. German higher-educated women in the SHARE sample, for example, are on average more likely to work full-time, but in a context where public child-care coverage for children under 3 years of age is poor and kindergartens are often only open in the morning (Salles, Rossier and Brachet Reference Salles, Rossier and Brachet2010). This speculative interpretation of our results unfortunately cannot be explored further with our data for limited sample sizes within education and working groups.
Acknowledgement
The work on this article was made possible through the support from the European Union's seventh Framework Programme (FP7/2007-2011) under grant agreement n. 217523 for the project MULTILINKS (How demographic changes shape intergenerational solidarity, well-being, and social integration: A multilinks framework). Arnstein Aassve gratefully acknowledges financial support through Starting Grant no StG-201194 (Consequences of Demographic Change) from the European Research Council (ERC). This paper uses data from SHARE release 2.5.0, as of May 24th 2011. The SHARE data collection has been primarily funded by the European Commission through the 5th framework programme (project QLK6-CT-2001- 00360 in the thematic programme Quality of Life), through the 6th framework programme (projects SHARE-I3, RII-CT- 2006-062193, COMPARE, CIT5-CT-2005-028857, and SHARELIFE, CIT4-CT-2006-028812) and through the 7th framework programme (SHARE-PREP, 211909 and SHARE-LEAP, 227822). Additional funding from the U.S. National Institute on Aging (U01 AG09740-13S2, P01 AG005842, P01 AG08291, P30 AG12815, Y1-AG-4553-01 and OGHA 04-064, IAG BSR06-11, R21 AG025169) as well as from various national sources is gratefully acknowledged (see HYPERLINK “http://www.share-project.org” www.share-project.org for a full list of funding institutions).