I. INTRODUCTION
Recent interest in the environment friendly technology gives impetus for the research on greenhouse gas-free devices such as water steam electrolysers (hydrogen production) and fuel cells (electricity production).Reference Ni, Leung and Leung1, Reference Olah2 Among the family of solid oxide electrolytes, the perovskite ceramics appear especially promising.Reference Iwahara, Esaka, Uchida and Maeda3–Reference Coors15 These compounds, with a general formula A2+ (Ba, Sr, etc.) B4+(Zr, Ce, Ti, …) O3, exhibit significant proton conduction at medium temperature range.
The presence of protonic species is not intrinsic to the host perovskite structure. To incorporate them, the B4+ site has to be partially substituted with a trivalent element, usually Lanthanide (Ln) or Rare Earth, which allows the oxygen vacancies formation [Eq. (1)].

where VO¨ denotes the oxygen vacancy.
Such oxygen-deficient perovskites have to be then exposed for days at temperature under various water vapor pressureReference Schober and Bohn8, Reference Baikov, Gunther, Gorelov, Colomban and Baddour-Hadjean10–Reference Ricote, Bonanos and Caboche14, Reference Sala, Lacroix, Willemin, Rhamouni, Takenouti, Van der Lee, Goeuriot, Bendjeriou and Colomban16, Reference Colomban, Slodczyk, Lamago, Andre, Zaafrani, Lacroix, Willemin and Sala17 to incorporate the protonic species. Note that optimum protonation conditions have not been determined yet. The protonation process is usually schematized by the following equation based on Kröger–Vink notation [Eq. (2)]:

This equation suggests that inserted protonic species are in the form of hydroxyl ions, which is rather ambiguous, because the true proton nature: hydroxyl ion? and/or interstitial ionic proton? is/are a subject of debates.Reference Slodczyk, Colomban, Zaafrani, Lacroix, Loricourt, Grasset, Sala, Halasyamani, Clarke, Mandrus and Choi18–Reference Zaafrani21 Actually, the observed IR signatures, considered as a proof of hydroxyl ion formation, seem to originate from surface moieties.Reference Slodczyk, Colomban, Zaafrani, Lacroix, Loricourt, Grasset, Sala, Halasyamani, Clarke, Mandrus and Choi18
The aim of successful protonation is a homogenous distribution of the bulk protonic species—the only species responsible of proton conduction, within a sample. Simultaneously, it is extremely important to avoid the absorption of the so-called surface protonic species in the form of undesirable second phases on a material surface.
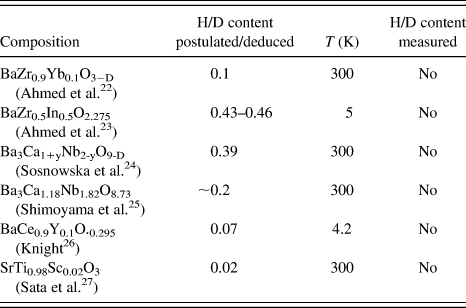
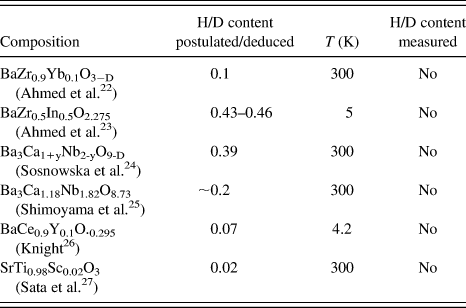
The first aim of this article was to determine the real content of the bulk protonic species. It should be stressed that this procedure is widely ignored in the literature, especially in the case of structural studies.Reference Ahmed, Eriksson, Ahlberg, Knee, Karlsson, Matic, Engberg and Borjesson22–Reference Sata, Hiramato, Ishigame, Hosoya, Niimura and Shin27 Indeed, the exact determination of (bulk) proton content is difficult. As listed in Table I, in many cases, the proton content is simply estimated or postulatedReference Ahmed, Eriksson, Ahlberg, Knee, Karlsson, Matic, Engberg and Borjesson22–Reference Sata, Hiramato, Ishigame, Hosoya, Niimura and Shin27 from the substitution level according to the charge equilibrium law that requires the knowledge of all defects (Ref. Reference Colomban4 and references therein). Moreover, a differentiation between bulk protons and surface protonic moieties is usually not considered. This is dangerous since most of measurements were performed at low temperatures (5–300 K) and on powder samples, i.e., conditions which enhance the presence of secondary surface phases such as hydrates, carbonates, etc.Reference Slodczyk, Colomban, Zaafrani, Lacroix, Loricourt, Grasset, Sala, Halasyamani, Clarke, Mandrus and Choi18, Reference Zaafrani21, Reference Slodczyk, Tran, Colomban, Hertz, DiVona, Knauth and Tuller28 Note that an important presence of the surface protonic species can significantly confuse the results of conductivity measurementsReference Jalarvo, Haavik, Kongshaug, Norby and Norby29 as well as a study of fundamental aspects concerning the physics and chemistry of proton conductors, i.e. a proton site and a true nature of bulk conducting proton.Reference Colomban and Tomkinson20, Reference Zaafrani21, Reference Slodczyk, Tran, Colomban, Hertz, DiVona, Knauth and Tuller28
The H content in structural studies of perovskites proton conduction.
Once it is sure that the bulk protons are considered only, the further problems, which require clarifications, can be investigated: (i) the modification of the host perovskite structure by the presence and dynamics of bulk protonic species after protonation under high water pressure and (ii) the optimum temperature range of proton bulk dynamics, their correlations with the conductivity, and structural modifications.
The neutron scattering experiments, well suited to study the properties of materials containing hydrogen, even in small quantity, appear as the best tools to measure the proton content as well as to determine their structure and dynamicsReference Colomban4, Reference Colomban19, Reference Hempelmann31–Reference Colomban and Novak35 of large samples representative of a ceramic membrane used in electrolyser/fuel cell devices.
The quasielastic neutron scattering experiment is a powerful tool for studying the motion of the protonic species: local reorientational motion in a meV range (suitable for triple axis and time-of-flight spectrometers) and translational motions being expected in the μeV range (appropriate for time-of-flight and backscattering spectrometers).Reference Colomban4, Reference Colomban19, Reference Hempelmann31–Reference Colomban and Novak35 Usually, assumption is made that translational diffusion, rotational diffusion, and vibration take place in energy range sufficiently different to allow the study of each motion independently. However, previous measurements on superprotonic conductors (β″-alumina, CsHSO4) obtained on different time-of-flight instruments questioned the above hypothesis.Reference Colomban4, Reference Lassègues, Fouassier, Baffier, Colomban and Dianoux34, Reference Colomban and Novak35
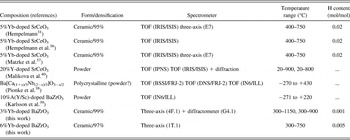
The quasielastic studies performed as a function of temperature and momentum transfer have been already performed for different perovskite-type compounds using different neutron instruments.Reference Hempelmann31, Reference Hempelmann, Karmonik, Matzke, Cappadonia, Stimming, Springer and Adams36–Reference Malikova, Loong, Zanotti and Fernandez-Alonso40 As it can be seen in Table II, most of the available literature studies were carried out on cerate-based perovskite materials. Hempelmann,Reference Hempelmann31 Hempelman et al.,Reference Hempelmann, Karmonik, Matzke, Cappadonia, Stimming, Springer and Adams36 and Matzke et al.Reference Matzke, Stimming, Karmonik, Soetratmo, Hempelmann and Guthoff37 performed the QNS study of SrCe0.95Yb0.05H0.02O2.985. Malikova et al.Reference Malikova, Loong, Zanotti and Fernandez-Alonso40 carried out simultaneous diffraction and QNS experiments on yttrium-doped (∼20%) barium cerate. Some different perovskites were also investigated. Pionke et al.Reference Pionke, Mono, Schweika, Springer and Schober38 studied Ba[Ca(1+x)/3Nb(2−x)/3]O3−x/2, whereas Karlsson et al.Reference Karlsson, Matic, Engberg, Bjorketun, Koza, Ahmed, Wahnstrom, Borjesson and Eriksson39 studied BaZr0.90A0.10O2.95 (A = Y and Sc).
Some details of literature data concerning the QNS studies of perovskite proton conductors.

However, these previous studies suffer from important weaknesses. Some measurements were performed on powder/polycrystalline samples,Reference Karlsson, Matic, Engberg, Bjorketun, Koza, Ahmed, Wahnstrom, Borjesson and Eriksson39, Reference Malikova, Loong, Zanotti and Fernandez-Alonso40 what makes impossible is the discrimination between protonic species adsorbed at the sample surface and the bulk ones. The obtained results are therefore questionable. It is very difficult to avoid the surface protonic species pollution in the case of studies carried out at low temperature (−270 °C till ∼400 °C). Moreover, the temperature range does not correspond to that expected for application: 550–750 °C.
Pure powder neutron diffraction studies have been reported for rather similar perovskites.Reference Ahmed, Eriksson, Ahlberg, Knee, Karlsson, Matic, Engberg and Borjesson22−Reference Sata, Hiramato, Ishigame, Hosoya, Niimura and Shin27 The studies have been also performed mostly on poorly sintered ceramics and powders at temperatures far below the operating conditions.
To study the material close to its state in operating conditions (fuel cell, electrolyser), we have performed the quasielastic neutron scattering measurements on dense and ultradense BaZr1−xYbxO3−δ ceramics in a wide temperature (20—1150 °C) and wavevector Q (up to 4 Å−1) range using triple axis spectrometers. It is noteworthy that a great advantage of a three-axis spectrometer is the quasisimultaneous recording of the quasielastic peaks (incoherent neutron scattering) and diffraction patterns (coherent). Additional structural data have been obtained with the neutron diffraction measurements performed using a neutron diffractometer. Very preliminary results have been previously published.Reference Colomban, Slodczyk, Lamago, Andre, Zaafrani, Lacroix, Willemin and Sala17, Reference Slodczyk, Colomban, Lamago, Limage, Romain, Willemin and Sala41
II. EXPERIMENTS
A. Samples
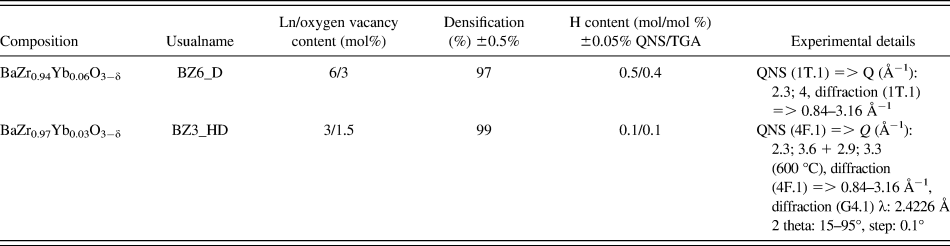
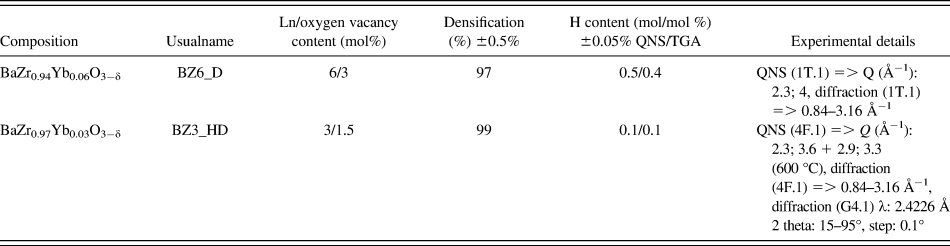
Round shaped Yb-modified BaZrO3 perovskite ceramic pellets (12-mm diameter, 2-mm thick) were prepared by the AREVA NP group at Montpellier University using the technique described elsewhere.Reference Sala, Lacroix, Willemin, Rhamouni, Takenouti, Van der Lee, Goeuriot, Bendjeriou and Colomban16, Reference Colomban, Slodczyk, Lamago, Andre, Zaafrani, Lacroix, Willemin and Sala17, Reference Slodczyk, Colomban, Lamago, Limage, Romain, Willemin and Sala41 The samples from two synthesis batches were used. The used ceramics exhibit different density and Yb content: BaZr0.94Yb0.06O3−δ (dense, 97% of theoretical density) called hereafter BZ6_D and BaZr0.97Yb0.03O3−δ (highly dense, 99%) called hereafter BZ3_HD. The ceramic density was measured by Archimedes principle. The Yb content was determined by a chemical analysis before and after firing. Useful details concerning both samples are listed in Tables II, III, and IV. The proton insertion was performed using the high temperature/high pressure water vapor (∼220 °C, 20 bars, decarbonated water) autoclave during 5 days that assures the high stability of the materials versus H2O vapor. Note that the ceramics containing the second phases at the grain boundary crumbled after a few hours of treatment in autoclave.Reference Slodczyk, Dabrowski, Malikova, Colomban, He, Swider-Lyons, Park and Kohl42 The homogeneity of the protonation was controlled by checking the intensity of the broad signal centered at ∼2500 cm−1 according to the so-called Raman profilometry method.Reference Slodczyk, Colomban, Willemin, Lacroix and Sala43
Main characteristics of the studied ceramics.
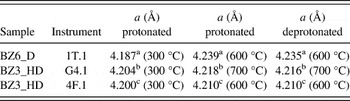
Lattice parameter values characteristic for protonated and deprotonated samples.

The following errors are determined: a±0.003; b±0.001; and c±0.005.
B. Quasielastic neutron scattering measurements
The quasielastic neutron experiments were performed using two spectrometers from the Triple Axis Equipment Pool available at the Léon Brillouin CEA-CNRS Laboratory at Saclay (Orphee Reactor, Saclay, France)44: a double focusing thermal triple axis spectrometer 1T.1 (called hereafter 1T.1) and a cold neutron three-axis spectrometer 4F.1 (called hereafter 4F.1). Both spectrometers allow collecting successfully the QNS data and diffraction patterns. The 1T.1 measurements were carried out on the BZ6_D, whereas the BZ3_HD ceramic was used for the 4F.1 experiment. A furnace requiring secondary vacuum conditions was used. During both campaigns of measurements, the ceramic pellets (∼3 g in 1T.1 and ∼5 g in 4F.1) were mounted on the top of a boron nitride (BN) sample holder. The sample holder is not gas tight to facilitate the sample drying by the surrounding dynamic ultravacuum. Before experiments, a careful calibration recording the vanadium and empty cell signals was performed. The measurements were carried out in a wide temperature range (Table II) both on heating and cooling cycles. The heating/cooling rate is about 10 °C/min. Note that the heating cycle represents the behavior of protonated sample, whereas the cooling one corresponds to the behavior of deprotonated material (see explications below). The time between the closure of the sample chamber and the first run performed at 300 °C in stable high vacuum was approximately 3 h, which ensures the departure of adsorbed surface protonic species. The energy transfers were measured from −4 to +4 meV at a few different Q values (Table III). Additionally, in the case of the 4F.1 experiment at 600 °C, both during the heating and cooling, the additional elastic/quasielastic peaks were recorded (Table III). Diffraction patterns were collected in the limited Q-range (Table III) at a few selected temperatures, both on heating and cooling cycles. Approximately 80 runs were recorded; a typical run duration was 2 h.
C. Neutron diffraction
The BZ3_HD ceramic was used also during the neutron diffraction experiment. This experiment was carried out using the cold neutron two-axis diffractometer PYRRHIAS G 4-1 (Léon Brillouin CEA-CNRS Laboratory, Saclay, France).44 Samples, previously broken in an agate mortar (pieces ∼2–4 mm long), were placed into the vanadium cylindrical sample holder. The furnace requiring secondary vacuum conditions allowed collecting the data in the temperature cycle: 300 °C–900 °C–100 °C, in heating and cooling. The details concerning the measurement conditions are given in Table III.
D. Thermal analysis
Thermal expansion measurements were carried out under argon atmosphere using the Setaram Setsys dilatometer instrument (Setatram, Caluire, France) equipped with the amorphous silica rod and support on a sample cut (4 × 4 × 2 mm) from the ceramic pellet. The measurements were recorded in the 25–800 °C temperature range in both heating and cooling cycles with rates of 10 °C/min. Thermogravimetric analysis (TGA) was performed in 40–1000 °C temperature range using a Setaram Setsys Evolution microbalance. The use of Pt crucible and dry inert He gas atmosphere allowed to significantly enhance the heat transfer and hence the measurement accuracy. To eliminate the surface protonic species adsorbed on the ceramic surface, a drying cycle up to 300 °C can be performed. Note that our studies show that in the case of high dense ceramic piece, the environment of measurement (inert gas, air, primary vacuum, …) has no visible influence on the temperature onset of bulk proton departure. The duration of heating/cooling cycles is rather similar for all used techniques.
III. RESULTS AND DISCUSSION
A. Content of the bulk protonic species
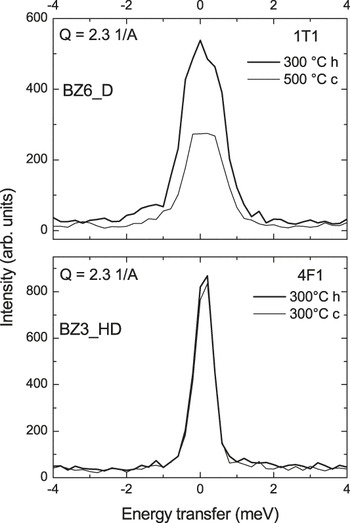
Due to the extremely high value of the incoherent cross section of hydrogen element, i.e., ∼80 barns, in comparison with the other elements constituting the here investigated zirconates (Ba ∼ 0.15, Zr ∼ 0.02, Yb ∼ 4, and O ∼ 0.0008 barns), the important advantage of the neutron experiments is its huge sensitivity to the hydrogen content measurement.Reference Colomban4, Reference Colomban19, Reference Hempelmann31, Reference Eckert and Kearley32, Reference Dianoux, Tachez, Mercier and Malugani45Figure 1 compares the intensity of quasielastic peaks recording using the 1T.1 and 4F.1 experiments: the first data collected at the beginning of the measurement campaign at 300 °C and the last data measured at the end of cooling cycle, after a few hours above 750 °C. Note that the data recorded above 300 °C are consider only; after ∼3 h of progressive thermal treatment in secondary vacuum conditions, a sample put in nontight cylinder has been cleaned out from a water and species adsorbed at the ceramic surface. For both samples, the decrease of intensity is observed at the end of the measurement after the cooling cycle. An important intensity difference is observed between the peak measured with the 1T.1 spectrometer on dense ceramic BZ6_D (97% of theoretical density) and rather small using the 4F.1 one on ultradense BZ3_HD sample (99% of theoretical density). Such a decrease of the intensity reveals the departure of protons due to the thermal treatment. Similar background differences arising from the incoherent contribution were observed by Hampelmann et al.Reference Hempelmann, Karmonik, Matzke, Cappadonia, Stimming, Springer and Adams36 and Malikova et al.Reference Malikova, Loong, Zanotti and Fernandez-Alonso40 Moreover, the intensities ratio between the protonated and deprotonated compound allows to calculate the hydrogen content. Namely, the ratio of incoherent neutron cross sections (σincoh) calculated for protonated and deprotonated compounds is proportional to the ratio of the elastic peak intensity (I) recorded for protonated and deprotonated materials:

Comparison of the quasielastic neutron scattering spectra at Q = 2.3 Å−1 for BZ6_D and BZ3_HD ceramics in their protonated (heating cycle, 300 °C) and deprotonated (cooling cycle 500 and 300 °C, respectively) states.

Therefore, the following proton content values can be proposed for samples used during the both campaigns of neutron experiments:
(i) BaZr0.94Ln0.06O3−εH0.005 for BZ6_D sample (1T.1), which corresponds to the TGA weight loss of 0.004 above 600 °C.
(ii) BaZr0.97Ln0.03O3−εH0.001 for BZ3_HD sample (4F.1), which corresponds to the TGA weight loss of 0.001 above 600 °C.
Note that these determined hydrogen contents might contain a systematic uncertainty. First of all, the error is related to the proposed chemical formula. Yb content reproducibility determined by chemical analysis is approximately ±0.02 mol. Its incoherent cross-sectional factor, i.e., 4 barns, has the highest values within the perovskite elements, except hydrogen of course. However, the Yb content is approximately 25 times more important than the bulk proton one. Consequently, the Yb content uncertainty can significantly contribute to the hydrogen error determination. The oxygen vacancy content, estimated due to the Yb content, can be considered as another important source of uncertainty; note that actually, there is no technique to measure the true oxygen vacancy content. Consequently, the error of H content determined by the neutron scattering method can be estimated to ±0.0005.Reference Zaafrani21 Taking into account the high accuracy of thermogravimetric (TG) measurements due to the He atmosphere and platinum crucible maximizing the heat transfer as well as the considered temperature range (samples free from the surface protonic impurities), the error of H content in TG analysis is estimated in a similar way.
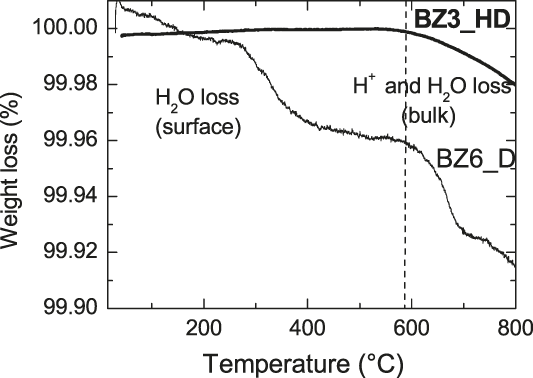
The determined H content values in the QNS measurements can be compared with those estimated from the TGA results (Fig. 2). Note that once the high dense samples are preliminary dried at 300 °C, the observed TG mass loss near 600 °C is characteristic of bulk proton content only: temperature range and rate are very similar for both techniques. Consequently, the neutron and TGA measurements, performed during the similar time cycle on the high dense of the same size sample, protonated in the same way reveal the bulk proton/water diffusion and departure. As we mentioned in experimental part, the different measurement environment, high vacuum and He inert gas, has no influence on the bulk proton departure for the used samples. The total weight loss detected in the case of BZ6_D samples is more important than that one characteristic for BZ3_HD. In general, a few weight loss steps appear: the first one below 200 °C related to the departure of water molecules, the second one near 300 °C attributed to the departure of the protonic species adsorbed at the ceramic surface, and the third one above 600 °C related to the departure of the bulk protons. It should be stressed that the TGA does not allow determining the H content as direct as the neutron measurements. Namely, the total weight loss observed during the temperature increasing can reveal the departure of free water molecules, chemically bounded water, and protonic entities such as OH− and H+ (Ref. Reference Zaafrani21 and references therein). Note that to maintain the overall electroneutrality, the departure of H+ under the form of H2 gas molecules should be associated with the electron acceptance. Consequently, the appearance of the holes (p defects) and/or reduction of added Ln3+ and associated Ln′-impurities into Ln/Ln′2+ can be observed. Note that protonation is associated to a broad light scattering assigned to electronic defects.Reference Slodczyk, Colomban, Willemin, Lacroix and Sala43
Comparison of the TGA curves characteristic of BZ6_D and BZ3_HD ceramics. BZ3_HD ceramic was previously dried to eliminate surface protonic species.
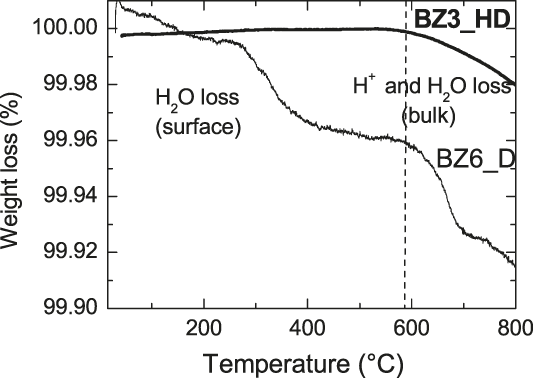
The determined values of H content are quite different for both samples. This shows that the bulk proton content depends on the ceramic density and/or Ln-level determining the quantity of the oxygen vacancies. The samples used for the experiment on 1T.1 are less dense (97% instead of 99% of the theoretical density) and contain more Yb atoms (6%). Note that the TGA results show a larger amount of surface protonic species ∼0.3% (Fig. 2), which are eliminated below ∼400 °C in air and most likely below 300 °C under high dynamic vacuum. Therefore, to eliminate as much as possible the surface protonic species, the measurements carried out on the 4F.1 were done with the ultradense ceramics (∼99%). Origin of such significant difference in the H content may be then assigned to the difference in Ln level and in the kinetic access to the sample surface, a factor that depends on the sample open porosity. The Ln elements substitute the Zr atoms allowing the oxygen vacancies. The formation of 1 mol of oxygen vacancies requires 2 mol of Ln elements. If the proton content depends on the Ln content, the BZ6_D sample should exhibit the H content approximately two times higher than that one in BZ3_HD. As we have shown, the less dense BZ6_D sample contains ∼5 times more protonic species. This suggests that density—open porosity—active surface area is in addition a very important parameter determining the proton content. On the one hand, the porosity promotes the protonation kinetics, but on the other hand, it can favor the adsorption of the protonic moieties at the sample surface. We assume that the oxygen vacancies close to the ceramic surface are first filled by oxygen atoms and in consequence, the penetration of dissociated water molecules is strongly decreased.Reference Colomban, Slodczyk, Lamago, Andre, Zaafrani, Lacroix, Willemin and Sala17 The diffusion of O2− ions and  necessary to homogenize the protonation is however weak below 600 °C.Reference Nivot, Legros, Lesage, Kilo and Argirusis46 Note that thermal treatment, even under high water pressure, above 400 °C led to vanishing of the broad light scattering associated to electronic defects.Reference Zaafrani21 Consequently, a significant duration of the autoclave treatment allows obtaining a constant H profile determined by Raman profilometry method.Reference Slodczyk, Colomban, Willemin, Lacroix and Sala43 The study shows that the effective protonation is then a compromise between the Ln and oxygen vacancy contents, the density as well as the protonation process conditions.
The bulk proton content values characteristic for investigated zirconates are smaller i.e., 0.001–0.005 mol/mol, than the content determined by the Hempelmann groupReference Hempelmann31, Reference Hempelmann, Karmonik, Matzke, Cappadonia, Stimming, Springer and Adams36, Reference Matzke, Stimming, Karmonik, Soetratmo, Hempelmann and Guthoff37 for cerate ceramic, i.e., ∼0.02. The difference can be explained first of all by the different nature of the compound, i.e., strontium cerate with a different substitution level. The lower density value, equals to ∼95%, can be a complementary reason. Finally, one may ask a question: does the Hempelmann groupReference Hempelmann31, Reference Hempelmann, Karmonik, Matzke, Cappadonia, Stimming, Springer and Adams36, Reference Matzke, Stimming, Karmonik, Soetratmo, Hempelmann and Guthoff37 measures the bulk protonic species only, i.e., unique species responsible of proton conduction or bulk and surface protonic moieties as well?
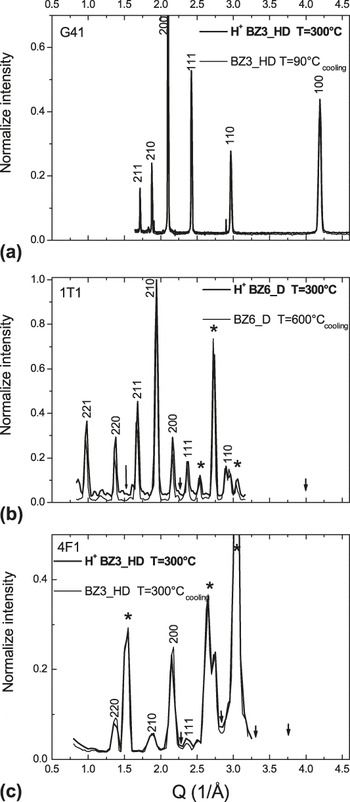
The analysis of the diffraction patterns can also be useful to control the protonic species content. Figure 3 compares the first (300 °C, beginning of measurement) and the last (end of the cooling cycle) normalized neutron diffraction patterns recorded using the three-axis spectrometers and the neutron diffractometer. Some differences can be observed (see also Table IV) rather important in the case of BZ6_D ceramic, whereas small for BZ3_HD. Note that relatively, low resolution and low intensity of the diffraction patterns collected on the 4F.1 spectrometer where the contribution of the ancillary equipment is dominant. Therefore, further, we will focus on the results based on the 1T.1 and G4.1 experimental data. The diffraction patterns characteristic for BZ6_D (1T.1) and BZ3_HD (G4.1) are very similar. The differences related to the Bragg peak intensity can be explained by the contributions of some preferential grain orientation within the ceramic pellets, experiment geometry, and mainly by the different Yb content.
Neutron diffraction patterns recorded on BZ6_HD (b) and BZ3_D (a, c) using G4.1, 1T.1, and 4F.1 neutron instruments, respectively. Arrows indicate the momentum transfer at which QNS spectra are recorded. Asterisks mark the parasite diffraction line of the metal support.

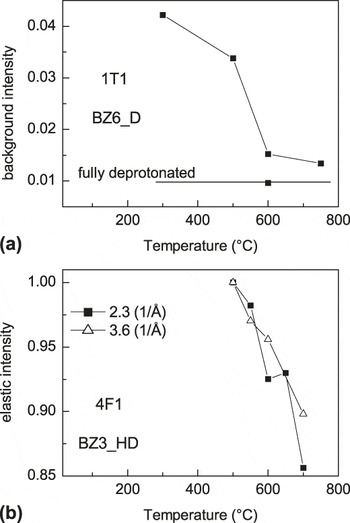
The highest background values are recorded in the case of the first diffraction patterns (Fig. 3), which is in agreement with the highest level of the inserted protons. This phenomenon is especially well seen in the case of BZ6_D sample exhibiting the highest proton content. Figure 4(a) presents the temperature dependence of the background (mainly incoherent) measured during the diffraction runs between 1.3 and 1.6 Å−1 (arrows in Fig. 3). Obviously, the background intensity decreases with the temperature increase. This is due to the incoherent contribution of protonic species [H+, OH−, H2O, Mp+(OH)p(H2O)n] in the sample and successive diffusion/departure of bulk protons at high temperatures under ultravacuum. Similar results were observed for other perovskite proton conductors, e.g., 20%Y-doped SrCeO3Reference Malikova, Loong, Zanotti and Fernandez-Alonso40 and BaZr0.5In0.5O3−δ.Reference Slodczyk, Dabrowski, Malikova, Colomban, He, Swider-Lyons, Park and Kohl42
Evolution of the incoherent inelastic scattering versus temperature for BZ6_D [(a) recorded using 1T1 instrument)] and BZ3_HD [(b) 4F1 instrument]; in the (a) part, the background intensity is measured between 1.3 and 1.6 Å−1; the straight line indicates the background level of fully deprotonated sample. (b) The intensity of elastic component extracted after fitting.

Note that the intensity background observed at 500 °C (heating) is still high; however, it remains smaller than the intensity measured at 300 °C. This confirms the multistep departure of protonic species in good agreement with the TGA results. The high vacuum environment and the rather slow heating rate guaranty the departure of the surface protonic species till 300 °C.
B. Does the proton doping modify the host perovskite structure?
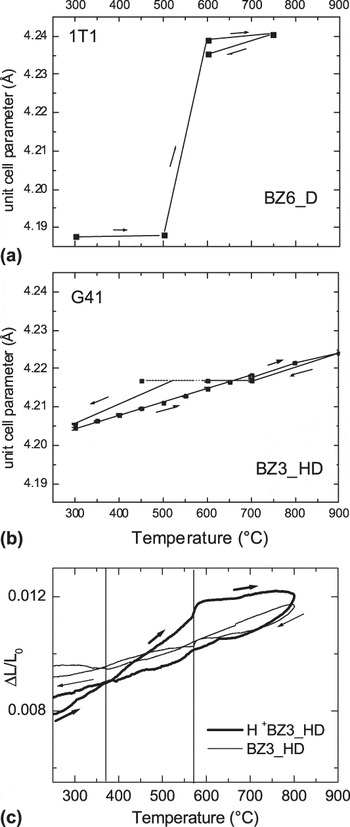
The limited Q range (0.84 and 3.16 Å−1) and Q-resolution offered by the experimental setup on 1T.1 do not allow the reliable use of the Rietveld methodReference Rietveld47 to refine the atom positions. It is however possible to determine successfully the temperature evolution of the lattice parameters (and symmetry) during the protonic species motion and the deprotonation process. Temperature dependence of the lattice parameter determined due to the evolution of (210) Bragg peak is presented in Fig. 5. For comparison, the temperature evolution of the lattice parameter determined for BaZr0.97Ln0.06O3−d due to the profile matching methodReference Rodriguez-Carvajal48 (G4.1 data) is also shown. The values of the lattice parameter, calculated within the cubic symmetry with the Pm3m space groupReference Minichelli, Ricciardiello and Sbaizero49 according to the diffraction pattern recorded at 300 °C (protonated samples, beginning of measurement), are given in Table IV. Note the small difference between them. Since these values concern the protonated samples, such a difference can be explained by the different Ln/H content, which influences the structural modifications. The changes of the RT lattice parameters values/unit cell volume after proton insertion have been already presented in literature.Reference Ahmed, Eriksson, Ahlberg, Knee, Karlsson, Matic, Engberg and Borjesson22–Reference Sata, Hiramato, Ishigame, Hosoya, Niimura and Shin27 Sosnowska et al.Reference Sosnowska, Przenioslo, Schafer, Kockelmann, Hempelmann and Wysocki24 and Shimoyama et al.Reference Shimoyama, Tojo, Kawaji, Atake, Igawa and Ishii25 detected the increase of the lattice parameter value for Ba3Ca1+yNb2−yO9−δ. Our previous x-ray diffraction resultsReference Slodczyk, Colomban, Willemin, Lacroix and Sala43 showed an increase of RT unit cell volume for titanates. This is then highly probable that the higher the protonic content, the higher modifications of lattice parameter values are observed.
Comparison of the unit cell parameter jumps for BZ6_D (H = 0.005 mol/mol) (a) and BZ3-HD (H = 0.001 mol/mol). (b) Heating cycle: starting material is protonated; cooling cycle, the material has been deprotonated at 750 and 1150 °C, respectively. (c) Thermal expansion curves characteristic for protonated and deprotonated BZ3_HD ceramic. The lines marked the presence of structural phase transition.

The rather monotonous increase of the lattice parameter with the temperature increase is observed for both samples (Fig. 5) as expected for ionocovalent structures. Large jumps are only observed when protonic species are destroyed, e.g., in ammonium β alumina.Reference Parlier, Sassolas, Boilot and Colomban50 At ∼550 °C, a up jump is detected for BZ6_D ceramic. After the deprotonation of the system, the value of the lattice parameter decreases slightly (Table IV). This phenomenon is especially well seen in the case of BZ3_HD sample. Namely, at 700 °C, the three points [Fig. 5(b)] represent the values of unit cell parameter characteristic of: i) the first measurement, ii) the 32nd measurement [32 diffraction patterns (1 h/pattern) were recorded to follow the evolution of the lattice parameter as a function of proton departure], and iii) the measurement recorded during the cooling cycle, respectively. As it can be seen, the unit-cell parameter is the highest for protonated sample (1st measurement). In consequence, the curves characteristic for heating and cooling cycles differ, revealing that the structural behavior for protonated and deprotonated samples is different. The differences between the protonated and deprotonated ceramic are more significant in the case of BZ6_D. This confirms that the structural modifications strongly depend on proton doping level.
Figure 5(c) presents the results of the thermal expansion measurements characteristic of protonated and deprotonated BZ3_HD ceramic. Note the very big similarity of the dilatometry curve events and the temperature evolution of lattice parameter shown in Fig. 5. The differences between the protonated and deprotonated behavior confirm the important role of the proton in the structural modifications of this system despite the very low H doping level. The significant area delimited by the up and down thermal expansion curve is related to the energy dissipated during the heating/cooling cycle. Such a significant dissipation phenomenon can appear as a source of material aging. The presence of subtle structural phase transitions can be detected: near 570 °C, probably of the first order, and in the vicinity of 400 °C, weaker, rather continuous. These phase transitions, especially the first-order one, are more significant in the case of protonated sample. In the case of material with the cubic symmetry (Pm3m space group), the presence of structural phase transitions is not expected. The observed results show then that the cubic symmetry is a mean one only, in agreement with the presence of a strong Raman spectrum (the Pm3m cubic perovskite does not have active Raman modes).Reference Slodczyk, Colomban, Willemin, Lacroix and Sala43, Reference Pasto, Condrate and Mathieu51
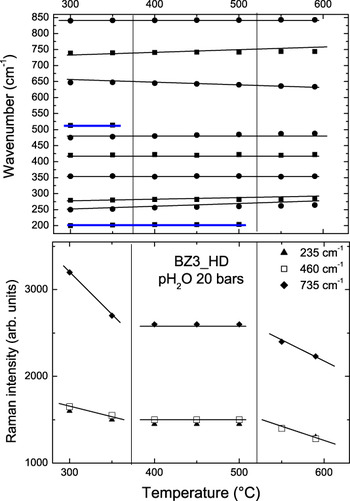
To go deeper in analysis of these structural modifications, we performed in situ Raman study as the function of temperature under 20 bars of water vapor pressure.Reference Colomban, Slodczyk, Lamago, Andre, Zaafrani, Lacroix, Willemin and Sala17Figure 6 shows temperature dependences of Raman wave number of all detected modes and Raman intensity of three selected modes characteristic of nonprotonated Yb-modified BZ3_HD. The disappearance of some Raman modes: ∼200 cm−1 (mode involving Sr cation translation and BO6 octahedron libration) and ∼500 cm−1 (bending mode of BO6 octahedron) as well as the decrease of the Raman mode intensities detected with the temperature increase confirmed the presence of two structural phase transitions in the 350–550 °C temperature range.
Temperature dependences of Raman wave numbers for all detected modes and Raman intensity of some selected modes in the case of nonprotonated BZ3_HD ceramic measured in situ under 20 bars of H2O vapor pressure.

C. Optimum temperature range of bulk proton dynamics
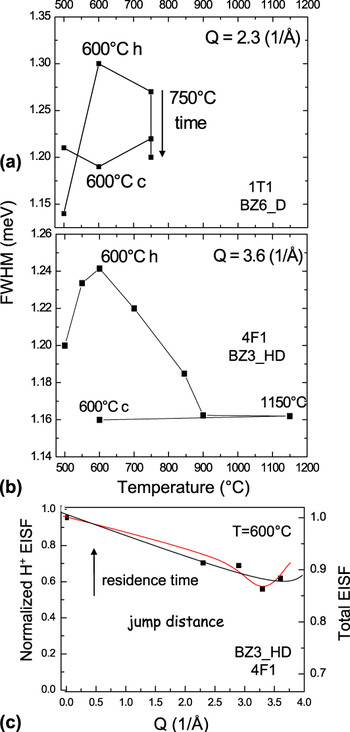
The elastic/quasielastic scattering was measured in a wide temperature range as a function of energy at the momentum transfers 2.3 and 4 Å−1 using the 1T.1 spectrometer for BZ6_D sample and at Q = 3.6 Å−1 using the 4F.1 for BZ3_HD to analyze the H dynamics. The Q values (small arrows marked in Fig. 3) were chosen to avoid the contribution of the Bragg peaks, which represents an advantage of the triple axis spectrometer. In the case of the time-of-flight spectrometer, the Q values change with energy transfer and thus some detectors are contaminated by Bragg reflections.
The QNS peaks have been first decomposed by the superposition of two Gaussian bands: narrow intense peak for elastic contribution and less intense broader one for quasielastic contribution. Note that the Gaussian shape was used because it fits the best with the instrument function of the used spectrometers. The elastic contribution is related to the host lattice, whereas the quasielastic component is dominated by the hydrogen dynamics. This assumption agrees very well with the results obtained for BZ6_D sample where the H content is significant; on the other hand, the incoherent contribution can be contaminated by the incoherent contribution of other element than hydrogen, especially for BZ3_HD sample. Since the contribution of the quasielastic part is not very big, the data have been fitted also using one single Gaussian band. The determined temperature dependences of the full width at half maximum (FWHM) are very similar for both fitting methods. Figures 7(a) and 7(b) show the results obtained due to the simplest solution, i.e., single band fitting. The results of both measurement campaigns are very similar; namely, a significant increase of the peak widths is observed for all studied Q values between 500 and 600 °C. This confirms that scattering arises from the bulk species. With further temperature increase, the FWHM values decrease. Such characteristic broadening of peak, as observed previously, e.g., in SrCe0.95Yb0.05H0.02O2.985,Reference Matzke, Stimming, Karmonik, Soetratmo, Hempelmann and Guthoff37 is connected with the broadening of the quasielastic components due to the local motion of the protons in the system. The highest FWHM values observed at 600 °C point out that near this temperature, the reorientational proton motion is the most important.
Temperature dependences of FWHM of QNS peaks measured at (a) Q = 2.3 Å−1 for BZ6_D using 1T1 three-axis spectrometer and (b) Q = 3.6 Å−1 for BZ3_HD using 4F1 three-axis spectrometer. Maximum proportional to the highest proton motion is achieved at ∼600 °C. Deprotonation is achieved after thermal treatment at 750 °C during 8 h (a) or continuous heating till 1150 °C (a priori, a full deprotonation was achieved at 900 °C), respectively. (c) Q-dependence of the EISF determined for protonated BZ3_HD ceramic at 600 °C.

A serious problem in superionic/proton conductors is that the clear energy separation between long distance translational (diffusion) and local orientational motion is not straightforward. The Q dependence of the elastic incoherent structure factor (EISF) can give further information concerning the geometry of this motion. During the 4F.1 experiment at 600 °C, both on heating and cooling cycles, the elastic/quasielastic scattering was recorded at the momentum transfers 2.3, 2.9, 3.3, and 3.6 Å−1. The data obtained during the heating cycle were fitted by the superposition of two Gaussian bands: narrow intense peak for elastic contribution and less intense broader one for quasielastic contribution as explained above. Note that the data recorded at 600 °C during cooling cycle characteristic for deprotonated sample without the quasielastic contribution were used as the reference for best possible fitting parameters (width, resolution, etc.). The determined Q dependence of the EISF for BZ3_HD, presented in Fig. 7(c), is rather similar to that presented by HempelmannReference Hempelmann31 and Matzke et al.Reference Matzke, Stimming, Karmonik, Soetratmo, Hempelmann and Guthoff37 for strontium cerate. Such big similarity can suggest that in investigated here zirconates, the model of free rotation can be excluded and the proton jump over n sites should be rather considered. However, the experimental data are difficult to interpret. The experimental points do not differ much, which makes the interpretation quite ambiguous. The comparison between the incoherent cross-sectional characteristic for protons and the rest of elements in sample gives approximately about 30% only. Consequently, two curves suggesting different values of jump length distance and residence time can be plotted [Fig. 7(c)]. Further study performed on the spectrometer offering a better resolution is then necessary to clarify the Q dependence of EISF and then the exact proton motion type.
The FWHM values observed for Q = 3.6 Å−1 at 900–1150 °C are almost temperature independent and smaller than those recorded at 600 °C. The decrease of the peak widths at higher temperature or then during cooling cycle is related to the departure of the mobile (protonic) species. Our TGA (Fig. 2) as well as diffraction and QNS results [Figs. 4(a) and 4(b) and Fig. 7] showed clearly the full deprotonation of the system between 700 and 900 °C. The comparison of the 1T.1 and 4F.1 results reveals that the effective deprotonation can be obtained in two different ways: (i) by long thermal treatment at >700 °C, i.e., the sample during the 1T.1 experiment was maintained 12 h at 750 °C and (ii) by short thermal treatment but at higher temperature, i.e., sample during the 4F.1 measurements was heated till 1150 °C for 2 h. The very similar curve obtained by TGA recorded under He (Fig. 2) and neutron scattering (Fig. 6) indicates that the deprotonation in the investigated dense ceramic pieces is not affected by the high vacuum and confirms that these studies concern the bulk protonic species exclusively.
IV. CONCLUSIONS
The simultaneous QNS and diffraction studies have been performed on high dense (97–99% of theoretical density) BaZr1−xYbxO3−δ ceramics. The results show that the bulk proton content is relatively low, i.e., 0.001–0.005 mol/mol. Such a doping level, lower than that expected from the filling of oxygen vacancies, depends on the Yb content and a sample density. This should be stressed that the use of highly dense ceramics is necessary to understand the complex behavior of the perovskite proton conduction as well as to use these materials in the industrial applications.
The most important proton dynamics, probably the reorientational local motion, is observed between 400 and 600 °C. In the similar temperature range: 400–570 °C, the presence of two more or less marked phase transitions was detected showing that the proton doping leads to the long-range order structural modifications. The big similarity with the Sr-homologue (SrZr0.9Yb0.1O3-δH0.002)Reference Colomban, Slodczyk, Lamago, Andre, Zaafrani, Lacroix, Willemin and Sala17 allows us to suppose that the highest proton dynamics are accompanied not only by the structural modifications but also by the energy activation changes of conductivity. Namely, a comparison of conductivity measured in situ in water steam electrolyserReference Colomban, Slodczyk, Lamago, Andre, Zaafrani, Lacroix, Willemin and Sala17 shows clearly the significant decrease of the activation energy values once the ceramic is protonated. These relatively small E a values, i.e., 0.26–0.3 eV, observed below 560 °C are typical for the proton conduction.Reference Colomban4, Reference Baliteau, Mauvy, Fourcade and Grenier52 The increase of activation energy value above 560 °C points out to a more complex phenomenon.Reference Colomban4, Reference Baliteau, Mauvy, Fourcade and Grenier52 Namely, the activation energy equal to 1.25 eV is characteristic for the diffusion of bigger species than the interstitial proton, e.g., the OH−, O2−, or VO¨. Since this value is very close to that describing the O2− diffusion in zirconates,Reference Nivot, Legros, Lesage, Kilo and Argirusis46, Reference Baliteau, Mauvy, Fourcade and Grenier52 one of possible interpretation is that above 560 °C, O2−/VO¨ diffusion starts to contribute to the diffusion and conductivity measurements. These results reveal the optimum temperature range of proton dynamics and applications: 400–560 °C. Such optimum temperature range has been established for the high dense ceramics protonated in static condition under high water vapor pressure. The next necessary step is to compare the behavior of a system in real operating condition, under H2/O2 atmospheres and under electric field. Further, in situ study is necessary.
Finally, it should be stressed that the presence of significant structural modifications caused by the presence, dynamics, and departure of small quantity of bulk protons as well as the small value of activation energies below 560 °C are in good agreement with the proposed ionic covalent bonded-free nature of protonReference Slodczyk, Colomban, Zaafrani, Lacroix, Loricourt, Grasset, Sala, Halasyamani, Clarke, Mandrus and Choi18–Reference Colomban and Tomkinson20 in the proton conducting perovskites.
ACKNOWLEDGMENTS
The financial support of ANR PAN-H CELEVA is acknowledged. The authors are grateful to Dr. Natalie Malikova and Dr. Stephane Longeville from LLB (France) for valuable discussions.