INTRODUCTION
Invaluable information can be gained from modelling environments to explore different scenarios associated with changing climatic conditions (Cramer et al. Reference Cramer, Bondeau, Woodward, Prentice, Betts, Brovkin, Cox, Fisher, Foley, Friend, Kucharik, Lomas, Ramankutty, Sitch, Smith, White and Young-Molling2001) or modelling vegetation dynamics across different scales (Moorcroft et al. Reference Moorcroft, Hurtt and Pacala2001). Models represent the surface of the Earth across a range of spatial resolutions, breaking up the surface into a regularly gridded pattern in which a single value of some parameter is assigned to each grid cell to represent a process or phenomena. Collections of geospatial data have been used within a multitude of applications to assess habitat (Carollo et al. Reference Carollo, Reed, Ogden and Palandro2009), map ecosystem services and conservation priorities (Naidoo et al. Reference Naidoo, Balmford, Costanza, Fisher, Green, Lehner, Malcolm and Ricketts2008), estimate vegetation community impacts due to global changes (Barbosa et al. Reference Barbosa, Rambal, Soares, Mouillot, Nogueira and Martins2012), measurement and monitoring of deforestation (Korhonen-Kurki et al. Reference Korhonen-Kurki, Brockhaus, Duchelle, Atmadja and Thuy2012), and to also monitor net primary productivity (NPP) as a complex model of multiple controlling parameters on a global scale (Field et al. Reference Field, Randerson and Malmstrom1995; Cramer et al. Reference Cramer, Kicklighter, Bondeau, Moore, Churkina, Nemry, Ruimy and Schloss1999).
Geospatial data have great utility when combined with multiple parameter simulation models to solve complex problems and where data are lacking to conduct an exploratory interpolation exercise (Field et al. Reference Field, Randerson and Malmstrom1995; Cramer et al. Reference Cramer, Kicklighter, Bondeau, Moore, Churkina, Nemry, Ruimy and Schloss1999; Gmur et al. Reference Gmur, Vogt, Zabowski and Moskal2012). Geospatial data have been linked to complex models to monitor and estimate NPP across multiple ecological space and time scales. For example, models have been used to assess the impacts of climate change and alternative land uses on ecosystem productive capacity. Since the resolutions of geospatial data can range from 10° × 10° to 1-km2 cell sizes, the output of these studies could potentially introduce data inconsistencies, depending on the spatial sampling resolutions and occupancy selection criteria used by each study.
Discussion of potential carbon uptake by tropical forests, which has been estimated to account for almost half global terrestrial NPP (Brown & Lugo Reference Brown and Lugo1982), has been shaped by estimates derived from a number of models (Solomon Reference Solomon2007). A partnership between spatial data and field collected information can provide insight into the relationship of NPP to climate and terrestrial conditions (Vogt et al. Reference Vogt, Patel-Weynand, Shelton, Vogt, Gordon, Mukumoto, Suntana and Roads2010). Before geospatial data and models become a common approach in landscape assessments, there is a need to know whether these data overestimate or underestimate NPP at any site, and what is the influence of the use of inconsistent resolution scales and occupancy selection criteria on the estimated NPP.
The spatial resolution of models has continued to increase, capturing greater amounts of local variability through a more detailed representation of the Earth's surface. This can be seen in models predicting CO2 sequestration in vegetation due to climate change, where cell sizes were 0.5° latitude (55.5 km at equator) by 0.5° longitude (Melillo et al. Reference Melillo, McGuire, Kicklighter, Moore, Vorosmarty and Schloss1993), or 3.75° longitude (416.5 km at equator) by 2.5° latitude (277.5 km at equator) (Cramer et al. Reference Cramer, Kicklighter, Bondeau, Moore, Churkina, Nemry, Ruimy and Schloss1999), but changing satellite technologies with resolutions of 1-km2 cell sizes have increased the complexity of carbon models (Running et al. Reference Running, Nemani, Heinsch, Zhao, Reeves and Hashimoto2004; Richardson et al. Reference Richardson, Anderson, Arain, Barr, Bohrer, Chen, Chen, Ciais, Davis, Desai, Dietze, Dragoni, Garrity, Gough, Grant, Hollinger, Margolis, McCaughey, Migliavacca, Monson, Munger, Poulter, Raczka, Ricciuto, Sahoo, Schaefer, Tian, Vargas, Verbeeck, Xiao and Xue2012). Sizes of individual grid cells within a modelling domain determine the amount of local variation captured, increasing the overall variance and noise of the data distribution as the cell size decreases. Accordingly larger cell sizes generalize spatial variations across a sampling area (Bellehumeur et al. Reference Bellehumeur, Legendre and Marcotte1997).
Use of environmental models has gained momentum as a method of predicting changes in global ecosystems due to climate change or land-use alterations, including detection of local changes, upscaled to a country level. To facilitate these analyses, environmental models have evolved from simple process-based models of coarse resolution into multiple parameter simulation models. These multiple parameter simulation models are now able to integrate information from field-based observations, literature values and, more recently, spatial information derived from satellite observations.
These multiple parameter simulation models diverge in spatial sampling resolutions and vary considerably between studies. For example, the resolutions can range from 10° (c. 1100 km at the equator) down to 1-km cell sizes. Since ecological processes can change due to climate change or land use, it would be prudent to model at the scale that would enable the capture of that local variability in NPP, and this would provide a common metric allowing comparisons among different landscape units (Vogt et al. Reference Vogt, Patel-Weynand, Shelton, Vogt, Gordon, Mukumoto, Suntana and Roads2010). NPP would be logical to use as one such unit of measurement since it records the state of an ecosystem and its responses to disturbances (Vogt et al. Reference Vogt, Gordon, Wargo, Vogt, Asbjornsen, Palmiotto, Clark, O'Hara, Keeton, Patel-Weynand, Witten, Larson, Tortoriello, Perez, Marsh, Corbett, Kaneda, Meyerson and Smith1997). We hypothesize that models predicting NPP are sensitive to the spatial sampling resolution and occupancy selection criteria used to represent the inputs which can affect the significant variables identified across prediction models. Here we report the results of a study which used five different spatial sampling resolutions to predict the NPP using climatic, terrestrial and biophysical variables. The objective was to examine whether variables identified as significant when predicting NPP would vary with the spatial resolution or cell size used, and whether sampling across the cell sizes or applying different occupancy selection criteria significantly changed the distribution of NPP values.
This study was restricted to analysing tropical forest areas in Indonesia that are designated as ‘production forests’, which are unfertilized natural forest areas under selective harvest management (Suntana et al. Reference Suntana, Vogt, Turnblom, Vogt and Upadhye2013 a). We used the randomForest statistical method (Liaw & Wiener Reference Liaw and Wiener2002) to identify at each scale the significant variables in the predictive models.
METHODS
Study area
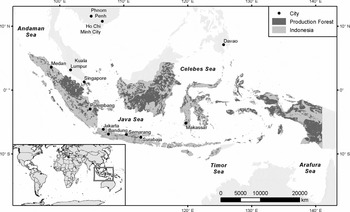
Indonesia comprises 17504 islands (Biro Pusat Statistik 2012) and is located between 6° N and 11° S and between 95° and 141° E (Fig. 1). It has three prevailing climatic zones (equatorial, tropical and monsoon). The geomorphology is variable, with mountain ranges, volcanic features and expansive plains. Vegetation is generally a reflection of the different climatic conditions, being described as tropical rainforest, tropical monsoon forest and tropical savannah forest (Tan Reference Tan2008).
Map indicating locations of production forest areas in Indonesia.

Spatial datasets
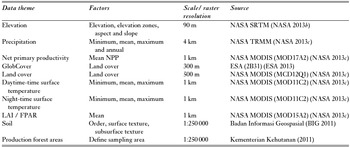
Collecting spatial datasets that represented the terrestrial, climatic and biophysical conditions of the study area allowed for the creation of a common database (Table 1). Datasets were obtained from spatial data gateways maintained by USA federal agencies (NASA [National Aeronautics and Space Administration] 2013a , b , c ), the European Space Agency (ESA 2013) and Indonesian ministries that create geographic information systems (GIS) databases (BIG [Badan Informasi Geospasial] 2011; Kementerian Kehutanan 2011). Datasets which originated from NASA were delivered in 10° × 10° tiles in hierarchical data format (HDR), with many different layers representing satellite conditions and data quality of each pixel. Soils and land-use vector datasets were collated and translated into English, and then rasterized to the smallest common unit with the other spatial datasets in the database. Translation of datasets from the source formatting into a rasterized format was undertaken using tools that summarized values across the different spatial sampling resolutions.
Spatial datasets used to create a common database from which sample populations were drawn (acronyms: LAI = leaf area index, FPAR = fraction of absorbed photosynthetically active radiation, NPP = net primary productivity, NASA = National Aeronautics and Space Administration, SRTM = Shuttle Radar Topography Mission, TRMM = Tropical Rainfall Measuring Mission, MODIS = Moderate Resolution Imaging Spectroradiometer, ESA = European Space Agency).

Dependent and independent variables
The MODIS (Moderate Resolution Imaging Spectroradiometer) NPP model (MOD-17) was chosen as the dependent variable (NASA 2013 c). Daily NPP was derived from a combination of other MODIS products, including temperature, fraction of photosynthetically active radiation (FPAR), leaf area index (LAI) and radiation conversion efficiency parameters from biome properties look-up-table (BPLUT) as outlined in ‘algorithm theoretical basis’ documentation (Running et al. Reference Running, Nemani, Glassy and Thornton1999). Many studies have validated the MOD-17 algorithm for different field sites in biomes around the globe (Running et al. Reference Running, Nemani, Heinsch, Zhao, Reeves and Hashimoto2004; Zhao et al. Reference Zhao, Heinsch, Nemani and Running2005; Turner et al. Reference Turner, Ritts, Cohen, Gower, Running, Zhao, Costa, Kirschbaum, Ham, Saleska and Ahl2006). The independent variables included, but were not limited to, those parameters from the MOD-17 algorithm such as LAI, minimum temperature and FPAR. Additional variables, such as elevation, precipitation, land cover and soil characteristics (Table 1), were added as independent variables based on data availability and relation to ecological processes. Expanded temperature variables such as night-time/daytime: maximum, mean and minimum values were used to capture effects of temperature on dark and daytime respiration as night-time temperatures affect tree growth (Larcher Reference Larcher1975; Kramer & Kozlowski Reference Kramer and Kozlowski1979). Variables which reflect topographic features, such as aspect and slope, were calculated using surface analysis tools within the ESRI spatial analyst toolbox (Environmental Systems Research 2013). Ecological elevation zones were calculated using the elevation ranges: lowland (< 400m), pre-montane (400–1200m), montane (1200–3000m) and alpine (> 3000m) (Hertel et al. Reference Hertel, Moser, Culmsee, Erasmi, Horna, Schuldt and Leuschner2009).
Spatial sampling resolution
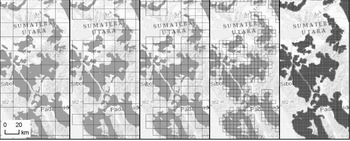
The study area was gridded into cells using a fishnet function, with the coordinate system for the study area being an Albers equal area conic projection for South Asia. Five different grid cell sizes (20, 15, 10, 5 and 1 km) were used for the spatial sampling (Fig. 2), and a single value for each grid cell area was extracted for input into the models. Three different occupancy selection criteria methods were used to filter which grid cells were to be included in each analysis. The first sample was composed of every cell intersecting an area defined as containing production forest, while cells without production forest areas were exempted from analyses. The second sample consisted of cells where > 60% of the cell area was occupied by production forest. In the third approach, analyses only included cells where > 95% of the cell area was occupied by production forest.
Five maps illustrating how the different spatial sampling resolutions capture the area of a selected production forest. The grid cell sizes are (from left to right) 20, 15, 10, 5 and 1 km.

Software environment and data processing
The common database of spatial datasets used the GIS software ESRI ArcGIS Desktop (Environmental Systems Research 2013), in combination with the programming language Python, to create automated tools for data processing. Those tiles from NASA's MODIS satellite platform which cover the study area were obtained, layers from each tile were extracted, and then values were transformed from integer values to floating point data using conversions provided by data documentation. Using Python, tools were created which automated processing tasks, ensuring consistent processing of all spatial information. The land surface temperature (MOD-11A2) values, reported as averages for eight-day intervals, were obtained for years 2000 through 2012 (NASA 2013 c). Maximum, minimum and mean daytime and night-time temperatures were calculated for each 1-km pixel from the 12-year data. The same procedures were used to extract data on precipitation and temperature, resulting in raster spatial datasets representing the variability in climate. Terrestrial conditions were obtained using elevation sourced from NASA's Shuttle Radar Topography Mission (SRTM) dataset (NASA 2013 b) creating ecological elevation zone, aspect and slope datasets. Processing of these data resulted in the creation of a spatial database representing the dependent and independent variables from which the sample populations were drawn. Using the ESRI Zonal Statistics as Table tool, mean values from numerical rasters or the majority from categorical rasters were obtained in a cell-by-cell operation to derive a single value for each grid cell. This operation was repeated for each input layer across the five different spatial sampling resolutions resulting in five flat files. Themes such as temperature or precipitation, which have temporal variability, were captured using the mean, minimum and maximum values across the lifetime of that data product. For example temperature was derived from the MODIS land surface temperature and emissivity (MOD 11A2 version 005) dataset (NASA 2013 c). All graticules covering the area of study were downloaded, layers one and five were extracted from the HDF file, tiles were mosaicked together and multiplied by 0.02 to convert to Kelvin. From all the processed mosaics, the minimum, mean and maximum values were calculated for each 1-km grid cell for the period 2000–2012 across the study area.
Prediction model variables
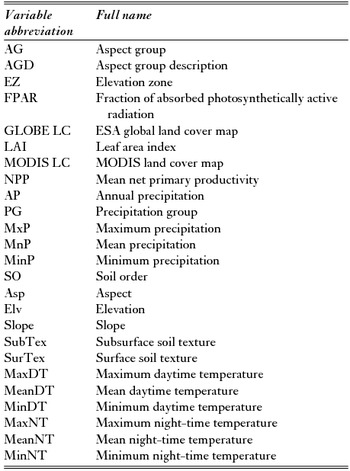
A library of spatial datasets was assembled and used to create prediction models for NPP (Table 2).
A complete list of variable acronyms and their full name description used within the NPP prediction model.

Statistical model
Equality of means between the populations of values created by the different spatial sampling resolutions and occupancy selection criteria were tested using a one-way analysis of variance (ANOVA). Post hoc pairwise comparisons between individual sampling resolutions and cell occupancy selection criteria (Table 3) used a multiple comparisons Tukey HSD (α = 0.05; Zar Reference Zar1999). Testing of prediction methods to identify significant variables used the randomForest method within the R program environment (Breiman Reference Breiman2001). Binary trees were created using recursive partitioning where a random sample of dependent variables at each possible split were selected using an out-of bag method, breaking the data into increasingly smaller pieces (Berk Reference Berk2011). The creation of a binary tree on a random sample from the training data and 3000 binary trees for each prediction model were used to create a forest. Once the forest was created, the importance of each variable was assessed by surveying all nodes and where each was used in the trees (Garzón et al. Reference Garzón, Blazek, Neteler, Dios, Ollero and Furlanello2006). Using standard methodology, the number of variables selected at each node when performing a split in creating the binary regression trees was chosen randomly using the tuneRF method with a mtry value of three (Liaw & Wiener Reference Liaw and Wiener2002). The algorithms within the randomForest library store the forest of binary trees with attributes such as node impurity (variable importance) and decrease in accuracy (mean squared error). These attributes were derived using a vote method, which tallied where each variable appeared within all binary trees, how many times it was used and strength of the split. Using the voting method, tallies were taken for each variable then ranked against all other variables used within the model. Due to the dimensionality of the prediction models and complex interactions between variables, the randomForest model creates independent trees which characterize the true importance of individual variables (Cutler et al. Reference Cutler, Edwards, Beard, Cutler, Hess, Gibson and Lawler2007). Using this importance value, all other values were normalized to this highest score so that importance values were ranked between zero and one. This step was then applied to the other four models using different spatial sampling resolutions. Thus full models using all input variables compared the importance of variables between the five different grid cell sizes with the occupancy selection criteria set at >0%.
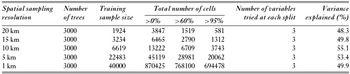
Descriptions of the predictive models from each of the spatial sampling resolutions, highlighting the variance explained by each randomForest model. The size of the training dataset and number of cells that are (1) > 0% = include any production forest (PF) land areas, (2) > 60% = consist of at least 60% PF, (3) > 95% = consist of at least 95% PF.

In addition to the importance of each variable, the amount of variance explained by each variable when added to a binary tree was reported by randomForest. Those variables which were added at or near the first split explained a greater amount of variance, increasing the mean squared error (MSE) or R2 compared to those variables added later to the same binary tree. Averaged over many trees using an out-of-bag variable selection method, the MSE of a particular variable was normalized by using a large number of binary trees creating the prediction model. Again, as with the node impurity normalization, the MSEs were normalized to the highest MSE and were ranked between zero and one.
RESULTS
Variable spatial scaling effects on NPP estimates
The 20, 15, 10, 5 and 1 km sampling resolutions showed initial differences in the variance explained by each full model. The spatial data used to create the sample population for the statistical models were the same, but the variance explained by the prediction models varied by spatial sampling resolution (Table 3). The variance explained by each prediction model ranged from 48.3 to 55.1%. The detailed representation of each production forest area showed that the area decreased as the spatial sampling resolution decreased. ANOVA and Tukey HSD pairwise comparisons among spatial sampling resolutions indicated mean NPPs were significantly different. ANOVA indicated occupancy selection criteria were significantly different, but Tukey HSD pairwise comparisons were not all significantly different at the 0.01 level. For example all sample populations created from occupancy selection criteria for the 1-km spatial sampling resolution were significantly different. NPP was significantly different between all three occupancy selection criteria of intersection (namely > 0%, ≥ 60% and ≥ 95%) at all spatial sampling resolution populations (20, 15, 10, 5 and 1 km) (Table 4).
Mean net primary productivity (NPP) estimates by sampling resolution for production forests (PFs) in Indonesia. Cell selection methods were (1) > 0% = inclusion for any cell intersecting PF land areas, (2) > 60% = model only considers cells consisting of at least 60% PF, (3) > 95% = model only considers cell consisting of at least 95% PF. We assumed 50% C for biomass. Total PF area in Indonesia is c. 47 707 000 ha (Suntana et al. Reference Suntana, Vogt, Turnblom, Vogt and Upadhye2013 b). Tukey HSD comparisons across columns (*) are significantly different, Tukey HSD comparisons across rows (+) cells with same letter are not significantly different.

Independent variables affecting NPP (importance)
Node impurity
As anticipated, some type of temperature variable may be important in affecting NPP. For example, outcomes from determining the variable importance from the five randomForest prediction models found the minimum daytime temperature variable from the 20, 15 and 10-km spatial sampling resolution models had the highest node impurity score or highest importance value. However, for the 5-km model, the mean daytime temperature had the highest importance value and for the 1-km model the mean night-time temperature had the highest importance value. Comparing this across the different models, minimum daytime temperature remained the most important variable for the 20, 15 and 10-km grid cell sizes but then decreased to the third and tenth most important variable for 1-km and 5-km grid cell sizes, respectively. Besides the different temperature variables, other variables that showed somewhat high importance in affecting NPP were elevation, fraction of absorbed photosynthetically active radiation and leaf area index; however, none of these variables were as important as the temperature variables (Appendix 1, Fig S1, see supplementary material at Journals.cambridge.org/ENC).
Mean squared error
For the spatial sampling resolutions of 20 and 10 km, the variable with the greatest MSE (explaining more NPP variance) was minimum daytime temperature. The MSE for spatial sampling resolutions of 1-km and 5-km grid cell size did not identify one single variable as being the most significant, but showed an overall effect of multiple variables. In the case of MSE, the explained variance of NPP by each variable was similar to variable importance. Prediction models using cell sizes of 20, 15 and 10 km identified two to five significant variables from the model. Prediction models using 5-km and 1-km cell sizes captured local variablity, thus nine or more significant variables were identified in these models (Appendix 1, Fig S2, see supplementary material at Journals.cambridge.org/ENC).
Partial dependence plots
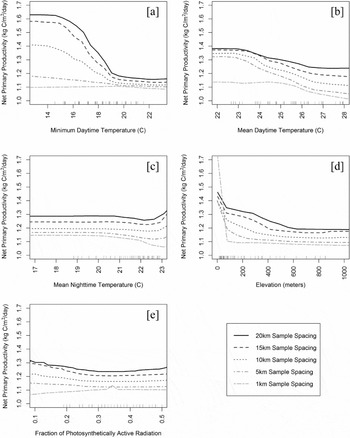
A partial dependence plot displays the relationship between the dependent variable NPP and single independent variables, given all other variables are in the prediction model. The plot can be used to compare the performance of a variable between the five models to understand how spatial sampling resolution changes a model. Five variables (minimum daytime temperature, mean daytime temperature, mean night-time temperature, elevation and FPAR) had the greatest change in importance across the five spatial sampling resolutions (Fig. 3).
Partial dependence plots between NPP and (a) minimum daytime temperature, (b) mean daytime temperature, (c) mean night-time temperature, (d) elevation and (e) fraction of photosynthetically active radiation for each of the five different spatial sampling resolutions.

Minimum daytime temperature
The partial dependence plot between minimum daytime temperature and NPP showed NPP decreased as the minimum daytime temperature increased (Fig. 3 a). While the 20-km model highlighted a significant decrease in productivity as the minimum daytime temperature increased, the 1-km and 5-km models removed that significant relationship and showed almost no change in productivity as the daytime minimum temperature increased.
Mean daytime temperature
The partial dependence plot for NPP and mean daytime temperature showed an increase in temperature with a decrease in NPP (Fig. 3 b). The mean daytime temperature was a variable ranked as being least important at the 20-km spatial sampling resolution. However, it increased in importance as the grid cell size decreased. It was ranked as having the highest importance variable for the 5-km grid cell size and was among the top four in the 1-km grid cell size. Compared to the 1-km grid cell size, the 20-km spatial sampling resolution showed a consistent decrease in NPP as there was an increase in temperature X axis of mean daytime temperature was adjusted, this sentence is no longer applicable.
Mean night-time temperature
The partial plot between NPP and mean night-time temperature shows variability in predictions of variable behaviour at different sampling cell-sizes (Fig. 3 c). The 1-km cell size prediction model showed a decrease in NPP at higher night-time temperatures, while 20-km grid cell model showed little to no change in NPP at higher night-time temperatures. The mean night-time temperature had a similar behaviour to mean daytime temperature, gaining importance as the spatial sampling resolution size decreased the grid cell size. This variable was ranked as most important for the 1-km grid cell size and third most important for the 5-km grid cell size.
Elevation
Elevation was a variable that had a low importance in the 20-km spatial sampling resolution model, but gained importance through the other four grid cell sizes. There was a sharp decrease in productivity as there was a gain in elevation (Fig. 3 d). Depending on the grid cell size used, NPP appeared to decrease rapidly as elevations increased to c. 100–600 m. The spatial sampling resolution defined a sharper drop-off in productivity for smaller grid cell sizes than found for the 15-km or 20-km spatial sampling resolution models.
Fraction of absorbed photosynthetically active radiation
FPAR, which is a component of the MODIS NPP model (Running et al. Reference Running, Nemani, Glassy and Thornton1999), did not rank as a significant variable in the 20-km spatial sampling resolution, but gained importance as the grid cell size decreased. In the 5-km NPP model, FPAR was the third most important variable. The partial dependence plot of NPP and FPAR showed there was no consistent relationship across the different grid cell sizes (Fig. 3 e). The 15-km and 20-km spatial sample spacing showed a decreasing relationship between NPP and FPAR initially, but this relationship disappeared as the available photosynthetically active radiation increased. This behaviour might be because the study area was located near the equator and therefore was not subject to large variations in the angle of the sun.
Change in grid cell size
The differing spatial sampling resolutions (the five different cell sizes) affected variable importance, MSE ranking and individual variable interactions with NPP. The change in grid cell size affected which production forest areas were sampled. In addition to the change in variable importance and MSE rank, the partial dependence plots had significantly higher NPP values for larger grid cell sizes than smaller grid cell sizes (1.245 versus 1.107 kg C m−2 yr−1). These comparisons translated into about 1188 × 106 t versus 1056 × 106 t vegetative biomass annually for all of Indonesia's production forest in 20-km and 1-km grid cell sizes, respectively. Therefore an annual biomass difference of up to 131.6 × 10⁶ t could occur depending upon which cell size is used (Table 4).
DISCUSSION
Sampling scale and NPP estimates
This study suggested that NPP estimates will vary with the sampling resolution used and cell occupancy selection criteria chosen. For example, the lowest mean NPP estimate (1.107 kg C m−2 yr−1) was found for the 1-km sampling scale using the intersecting method (if > 0% cell occupancy occurs, the cell is retained for analyses), while the highest mean NPP (1.245 kg C m−2 yr−1) was found at the 20-km sampling resolution (Table 4). Hence the higher resolution 1-km sampling scale had 11% lower mean NPP compared to the 20-km sampling resolution scale. If the 1-km sampling resolution is found to have the more realistic total NPP estimate, the 20-km sampling resolution provides an example of how generalization can alter model results.
Determining what sampling resolution scale should be used to estimate NPP values cannot be established from the results in this study. A comprehensive field study that systematically measured total productivity and the various drivers of productivity at each of the sampling scales used in this analysis is required. Since a comprehensive field study was not possible for this research, value can still be obtained by knowing if and how NPP changes with respect to changing scales or cell occupancy selection criteria, and this can be used to provide insights into the potential range of carbon sequestration found in Indonesian forests.
Several reasons might explain the different estimates found for NPP from using the different sampling resolutions. The 20-km scale may: (1) include other land use or forest types, such as plantation forests for producing: (a) timber, such as teak forest plantation; (b) pulp and paper (mostly acacia in Indonesia), and (c) energy, and/or (2) the operation of averaging values over a variable area size will change the overall distribution. Trees respond to small changes in microclimate or soil nutrient thresholds, which are probably muted at the larger sampling resolutions because of their inherent variability across a larger geographic area.
The change in grid cell size can impact the magnitude of non-production forest values outside of the production forest areas that is integrated into the sample grid. If this occurs, it would impact the overall mean. In contrast, a smaller grid cell size would have a greater likelihood of sampling values predominately solely from the production forest areas. This reduces sampling from surrounding areas under different land-use management practices that are nonetheless still forests. In addition to the change in variable importance and MSE rank, the partial dependence plots showed significantly higher NPP values for larger grid cell sizes than for smaller grid cell sizes.
In this study, for the partial dependence plot of elevation to NPP within the tropical production forests of Indonesia, the greatest changes in NPP were observed for forests growing below 500 m elevation. This decrease in NPP with increasing elevation is not as pronounced at the 1-km sampling resolution as it is at the 20-km sampling resolution, where NPP decreased from 1.35 to 1.2 kg C m−2 yr−1 with increasing elevation to 500 m. Most of the sampling resolutions used in this study showed that higher elevations have lower rates of productivity and changed very little after 500 m elevation. A survey of the tropical forests in the Andes of Ecuador revealed productivity decreased with elevation (Moser et al. Reference Moser, Leuschner, Hertel, Graefe, Soethe and Lost2011), which supports the trend found in a survey comparing sites across an altitudinal transect in Borneo, where aboveground NPP decreased in relation to elevation (Kitayama & Aiba Reference Kitayama and Aiba2002). Our results indicate that increasing elevations above 500 m would have little effect on NPP. Indonesian elevations recorded by SRTM varied between 0 m and 4805 m, with a mean value of 340 m and standard deviation of 525m. Based on this distribution, and because there are so few data points above 1000 m in the Indonesian tropics, the previous statement would be subject to caution. However from sea-level to c. 750 m elevation, we observed elevation had a significant effect on NPP at all grid cell sizes, excluding perhaps the 1-km cell size.
Scale-dependent drivers of productivity change
We explored how different site specific variables may interact with NPP. We had hypothesized that NPP, which is derived from an algorithm having its own assumptions, is sensitive to spatial sampling at different grid cell sizes and that a prediction model would identify variables of significance not originally used in the original NPP algorithm. The objective of this study was to detect how the predictors of NPP would change with scale and also how NPP itself would change with scale and sampling criteria.
In this study, the dependent variable NPP did not have the same significant independent variables across the different spatial sampling resolutions. For example, the minimum daytime temperature was ranked most important for 10, 15 and 20-km sampling resolutions but not at 5-km and 1-km sampling resolutions. Studies of tropical forests have had varied results in quantifying what temperature parameter best corresponds with productivity. A meta-analysis of 113 tropical sites statistically showed the strongest correlation with aboveground NPP was mean annual temperature (Cleveland et al. Reference Cleveland, Townsend, Taylor, Alvarez-Clare, Bustamante, Chuyong, Dobrowski, Grierson, Harms, Houlton, Marklein, Parton, Porder, Reed, Sierra, Silver, Tanner and Wieder2011), while in Costa Rica, tree-ring growth was negatively correlated with annual means of daily minimum temperature (Clark et al. Reference Clark, Piper, Keeling and Clark2003).
Scale is an especially relevant issue for studies using satellite observations since these are typically obtained at very large scales where resolution is dictated by technology. It is important to determine what resolutions can adequately detect ecological changes occurring at smaller scales. Since field studies have shown that ecological and physiological processes, and therefore indicators of change, vary by scale (Lovejoy et al. Reference Lovejoy, Bierregaard, Rylands, Malcolm, Quintela, Harper, Brown, Powell, Powell, Schubar and Hays1986; Levin Reference Levin, Jacques, Ehleringer and Field1993), varying the scale of analysis will produce different estimates of an ecosystem's productive capacity and the drivers that control or modify it. This explains why field studies may identify a greater number of variables needed as input data to explain changes in NPP, compared to satellite observations using larger scales of NPP estimation. The number of indicators needed to explain ecological processes across scales was recognized more than 20 years ago by ecologists studying ecological changes in space and time (Gosz Reference Gosz1992). In a similar manner, our ecological research suggests that multiple parameter simulation models might not encompass all the available variables or, more specifically, the variables may not being selected at the scale at which they are statistically significant.
CONCLUSIONS
This study suggested that plotting the relationship of NPP to different climatic and terrestrial variables may provide the ability to refine multiple parameter-simulation models for estimating NPP. This study on Indonesian tropical production forests highlighted the multitude of driving variables that are part of the complex relationships that may be used to predict changes in productivity. This means that any multiple parameter simulation models must be able to determine the scale at which NPP changes are occurring to realistically model the impact of climate change and land-use changes on productivity. The use of randomForest enabled us to highlight how varying spatial sample resolutions can change the significance of different variables generated from the same source datasets. The use of different occupancy selection criteria may change the distribution of the sample population. Defining the sample set in different ways can impact the overall results of a statistical analysis, reinforcing the need for variability to be introduced into a model. Models continue to be the primary way to estimate climate scenarios or carbon sequestration potentials (Parry Reference Parry2007). Within this study, the variation in variable interaction with differing model cell size highlights the need to test and compare model results at different spatial sampling resolutions and using different cell occupancy criteria.
ACKNOWLEDGEMENTS
We thank the editors and three anonymous reviewers for the critical input which helped improve the submitted manuscript. Support for the statistical analyses for this research came in part from a Eunice Kennedy Shriver National Institute of Child Health and Human Development research infrastructure grant, R24 HD042828, to the Center for Studies in Demography and Ecology at the University of Washington.
A special thanks to SUCOFINDO of Indonesia, whose staff provided spatial information for many of the independent variables used in this study.