Introduction
Attrition, the loss of study participants, is a well-established challenge in longitudinal research. This is particularly concerning in studies on aging and dementia as two of the established risk factors for attrition are increasing age and lower levels of cognition (Burke et al., Reference Burke2019; Cacioppo and Cacioppo, Reference Cacioppo and Cacioppo2018; Chatfield et al., Reference Chatfield, Brayne and Matthews2005; Matthews et al., Reference Matthews, Chatfield and Brayne2006; Van Beijsterveldt et al., Reference Van Beijsterveldt2002). Other factors increasing attrition in longitudinal epidemiological aging studies may be the same ones influencing the risk of dementia and cognitive decline, including lower education (Cacioppo and Cacioppo, Reference Cacioppo and Cacioppo2018; Kuh et al., Reference Kuh2016; Matthews et al., Reference Matthews, Chatfield and Brayne2006; Young et al., Reference Young, Powers and Bell2006), lower levels of functioning in activities of daily living (Burke et al., Reference Burke2019; Matthews et al., Reference Matthews, Chatfield and Brayne2006), depressive symptoms (Burke et al., Reference Burke2019; Chang et al., Reference Chang, Yang, Tang and Ganguli2009), poorer subjective health (Kuh et al., Reference Kuh2016; Matthews et al., Reference Matthews, Chatfield and Brayne2006; Salthouse, Reference Salthouse2014), social isolation and loneliness (Cacioppo and Cacioppo, Reference Cacioppo and Cacioppo2018; Mein et al., Reference Mein2012), and comorbidities (Young et al., Reference Young, Powers and Bell2006). Attrition is not random, and those who have remained in the study for many years are systematically different from those who were lost earlier in the study. For example, those who remain are younger, healthier, and more socially engaged than those lost. These features can cause attrition bias by creating, for example, the spurious impression that youth and good health increase risk of dementia (Weuve et al., Reference Weuve2015).
Knowing the characteristics of those most likely to be lost to follow-up can potentially allow for methodological adjustments to minimize attrition bias. Here, we sought to characterize participants in a longitudinal population-based study who were lost over 10 years of follow-up.
Because longitudinal studies collect an abundance of variables over many years, characterizing lost participants and predicting attrition require navigation of complex interactions and hidden patterns in the data. Various statistical methods can be used for this purpose, including hypothesis-based logistic regression models and atheoretical machine learning models. Oftentimes, machine learning can be superior to traditional statistical methods (Amalakuhan et al., Reference Amalakuhan2012; Hsich et al., Reference Hsich, Gorodeski, Blackstone, Ishwaran and Lauer2011; Lo-Ciganic et al., Reference Lo-Ciganic2019; Thottakkara et al., Reference Thottakkara2016) by providing higher discrimination ability in prediction. We explored the use of machine learning tools, in addition to a traditional logistic regression method, to determine whether the former, atheoretical, approaches would provide a more precise prediction of attrition than the latter, hypothesis-based approach could do. We employed four familiar, commonly used, machine learning methods known to yield good prediction results (Chu et al., Reference Chu2008; Hastie et al., Reference Hastie, Tibshirani and Friedman2008). Although machine learning approaches often provide higher discrimination ability in prediction, traditional logistic regression methods are easier to understand for most readers, and the relationship between predictors and the outcome is less complex. Therefore, we used both approaches in our analysis and compared their performance when the final models were built.
Methods
Study setting and participants
The Monongahela-Youghiogheny Healthy Aging Team (MYHAT) is an age-stratified random sample drawn from the publicly available voter registration list for a group of small towns in southwestern Pennsylvania, U.S.A. This population-based cohort was recruited between 2006 and 2008 and is being followed annually for the development of mild cognitive impairment (MCI) and dementia. Inclusion criteria at study entry included 1) being 65 years and older, 2) living in one of the designated towns, 3) not residing in a long-term-care facility, 4) having vision and hearing sufficient to permit neuropsychological testing, and 5) not being decisionally impaired. Eligible participants who consented were briefly assessed using the mini-mental state exam (MMSE) (Folstein et al., Reference Folstein, Folstein and McHugh1975). Only participants without substantial cognitive impairment at recruitment (age- and education-adjusted MMSE score [Mungas et al., Reference Mungas, Marshall, Weldon, Haan and Reed1996] ≥21) were invited to complete the full assessment and thus eligible for annual follow-up. The University of Pittsburgh Institutional Review Board approved all study procedures, and all participants provided written informed consent (Ganguli et al., Reference Ganguli, Snitz, Vander Bilt and Chang2009).
Study assessment and predictor variables
At baseline and each annual follow-up, participants underwent detailed assessments including but not limited to demographic information, MMSE, health history, subjective memory complaints, functional ability, depressive symptoms, lifestyle, social support, and a review of current medications. Participants were rated using the Clinical Dementia Rating (CDR®) Dementia Staging Instrument (Morris, Reference Morris1993) by certified study staff, based on independence in cognitively driven everyday activities.
Demographic and personal information
Age was used as a continuous measure and other demographic variables were categorical: sex, education (less than or equal to high school, and greater than high school), marital status (currently married/living as married or not), living arrangement (alone or not), living with someone who was also a participant in the MYHAT study or not, and employment status (working or not). Caregiver status was defined by the participant being regularly depended on another person for help with activities like cooking and shopping. Self-reported family history of dementia was captured for first-degree relatives of the participant.
Cognition
MMSE scores were treated as continuous variables ranging from 0 to 30.
Clinical dementia rating
CDR was categorized into three groups (0 = normal, 0.5 = MCI, and ≥1= dementia).
Health history
Participants’ self-rated health was grouped into three categories (poor, fair/good/very good, and excellent). Medical history was captured as self-report in response to the question, “Has a doctor or nurse told you that you have…”. Endorsement of hypertension, myocardial infarction, congestive heart failure, arterial fibrillation, or cardiac arrest was included as “cardiovascular disease.” An indicator variable for “sleep problems” was created from four questions assessing sleep patterns including difficulty falling asleep, difficulty staying asleep, early morning awakening, and uncontrollable daytime sleepiness.
Blood pressure
Systolic blood pressure was grouped as <140 vs. ≥140 mmHg, and diastolic pressure was categorized as <90 and ≥90 mmHg.
Lifestyle and activities based on self-report
Smoking and alcohol consumption were based on use during the preceding year. Physical activity included both exercises done at moderate intensity and also physical activity from everyday activities (walking, housework, etc.). Hobbies and computer/electronic device use were dichotomized as having or not having a hobby and using or not using a computer/electronic device. A social activity indicator variable (any vs. none) was created from four questions assessing if participants left their homes in the past year to 1) attend a family occasion, 2) attend another social occasion, 3) go to work or a volunteer activity, or 4) attend place of worship. Social engagement was defined as belonging to any organizations including, but not limited to churches, lodges, societies, and volunteer groups, and also attending meetings/activities at least some of the time, dichotomized as any vs. no social engagement. Frequency of leaving the home was assessed and grouped into three categories (daily, 2–6 times per week, and less than weekly).
Social support
We assessed social support as the number of people (< 3 vs. ≥3) to whom the participant reported feeling close enough to confide, and the participantʼs satisfaction with the help they receive from others (much less/slightly less help vs. enough/more than enough help).
Depression
Depressive symptoms were assessed using the modified Center for Epidemiologic Studies – Depression scale (Ganguli et al., Reference Ganguli, Gilby, Seaberg and Belle1995; Radloff, Reference Radloff1977) and categorized as ≤3 vs. >3 symptoms endorsed as present during the preceding week.
Functional ability
Independence in instrumental activities of daily living (IADL) was examined and categorized as being completely independent vs. needing help in at least one activity on the Older Americans Resources and Services IADL scale (Fillenbaum, Reference Fillenbaum1988).
Subjective memory complaints
Subjective memory complaints were assessed using a 21-question assessment (Snitz et al., Reference Snitz2012) and categorized as 0–2 complaints vs. 3–4 vs. ≥5 complaints.
Outcome variables
Attrition
The outcome variable in our analyses was lost to the study at any point during the first 10 years of follow-up, regardless of the specific reason for attrition (death, dropout, etc.) and of any other changes in status such as incident MCI or dementia.
Tracking
Between annual assessments, interviewers telephoned participants every 3–6 months to “check in” with them and ask about any major events and changes in their lives. Quarterly study newsletters and personalized birthday cards were sent to all active participants. The phone calls and mailings served both to minimize attrition by building rapport with the participants and to track people who may have relocated, using a returned mail service. Participants were offered a “skip” option if they were too busy or otherwise unable to complete their assessment in a given year and were contacted the following year for continued participation in the study.
Statistical Analysis
To compare characteristics of participants who remained in the study to those who were lost at or before the end of the current observation period (Study Year 11), we examined categorical and continuous variables using frequencies with percentages and means with standard deviations, respectively. We also conducted between-group comparisons using chi-squared or Fisherʼs exact test for categorical variables and t-test or Mann–Whitney U test for continuous variables.
We used multivariable logistic regression models to assess the association between each predictor at each cycle and attrition at the next cycle, while adjusting for other covariates. Our main model reported here used a robust sandwich estimator of variance to account for correlated measurements within each participant from multiple data collection cycles. In a sensitivity analysis, we used generalized estimating equation (GEE) methods with various working correlation structures including independent, exchangeable, first-order autoregressive, and unstructured for post-hoc comparison. As the results of all GEE methods with different correlation structures were entirely consistent with the regression model, we do not show their results in the main paper. Instead, they are available as an online supplement (see Supplemental Tables 1–4).
For inclusion in the logistic regression model, we selected variables based on the stepwise procedure with the smallest Akaike information criterion. In the final multivariable logistic regression model, statistical significance of associations between predictors and attrition was determined using a two-sided P value <0.05.
In order to assure reproducibility and avoid overfitting, we randomly split the data into training and testing sets with 1:1 ratio. The model was developed from the training set, and prediction results were obtained to the participants in the testing sets.
For comparison with the regression model, we also implemented four other commonly used machine learning approaches to predict the attrition status in the next cycle based on covariates at the current cycle: the least absolute shrinkage and selection operator (LASSO) logistic regression, random forest (RF), gradient-boosting machine (GBM), and artificial neural network (ANN). We selected these four machine learning methods because they are familiar and commonly used and have been shown to provide very good prediction results (Chu et al., Reference Chu2008; Hastie et al., Reference Hastie, Tibshirani and Friedman2008). As we did for the logistic regression modeling, we split the data into training and testing sets and the prediction results were evaluated in the testing set. The discrimination performance of the final multivariable logistic regression model and the four machine learning approaches were compared via their areas under the receiver operating characteristic curves (AUCs). The AUCs were obtained by comparing the actual attrition status (yes/no) to the predicted probability of attrition among participants in the testing set.
All statistical analyses were carried out in R version 3.5.1 (R Core Team, 2014).
Results
Over 10 years of follow-up, 77% of our original cohort was lost to follow-up. Of these, 36.9% were due to death, 21.5% were due to drop out/refusal, 20.2% were too sick (physically or cognitively) to participate, 11.4% relocated out of the study area, 9.6% were untraceable or unreachable, and 0.5% were lost for other reasons. For the current analyses, we combined all causes of attrition into a single outcome variable.
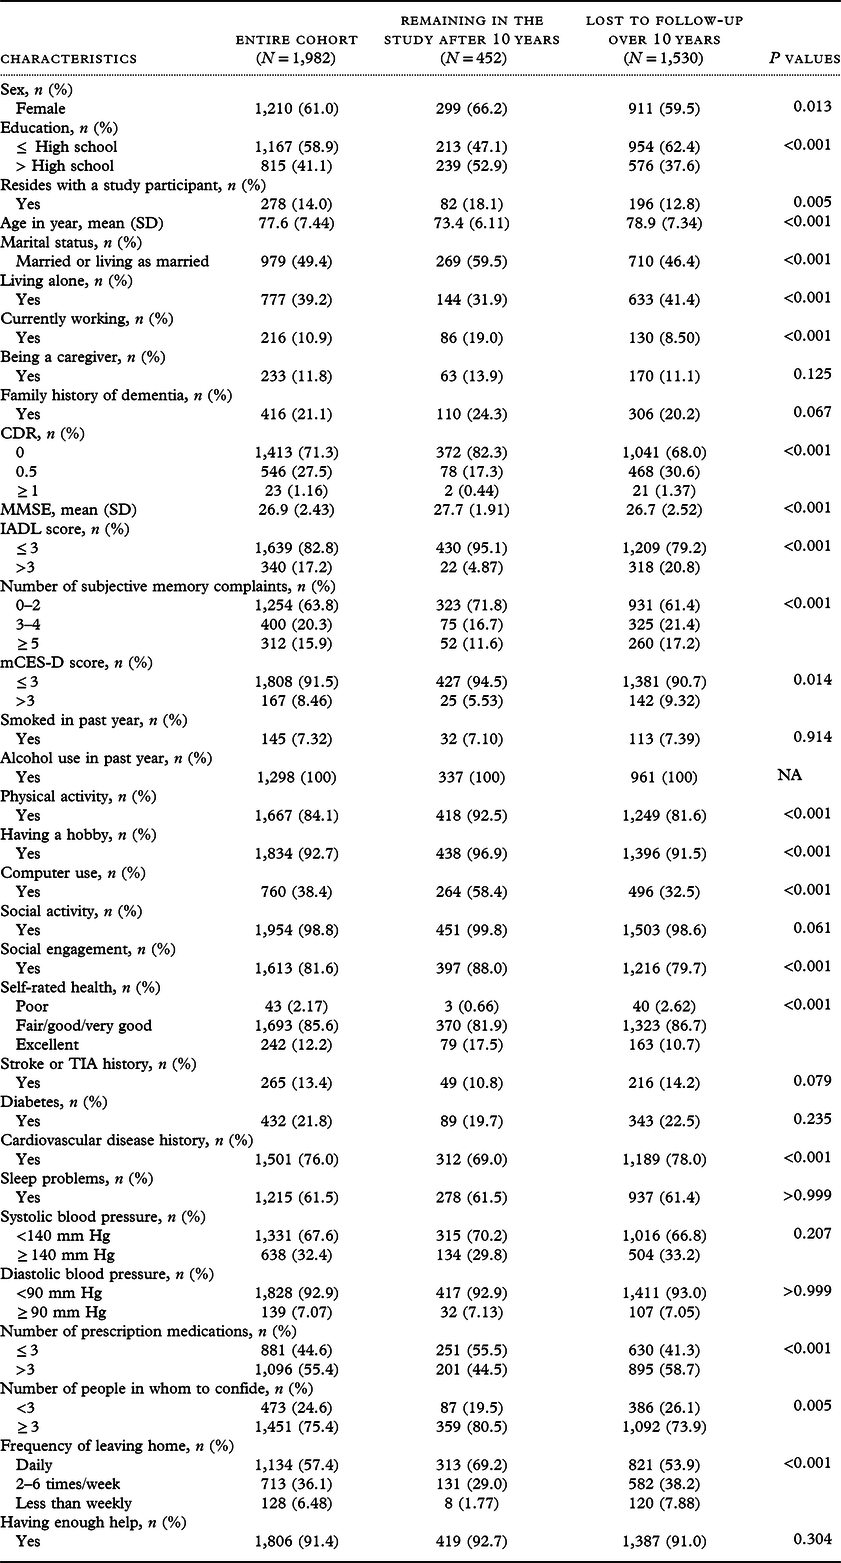
Table 1 shows the baseline characteristics of the participants by attrition status after 10 years of follow-up (still in the study after 10 years vs. loss before 10 years). Attrition is significantly associated with being older, male, having ≤HS education, not residing with another study participant, not being married, living with others, not currently working, leaving home less frequently, having lower MMSE scores, no physical activity, no hobbies, not using a computer, having no social engagement or activities, endorsing poor subjective health, having a history of cardiovascular disease, fewer confidants, more subjective memory complaints, taking more prescription medications, endorsing more depressive symptoms, being dependent in at least one IADL, and having a CDR > 0.
Baseline characteristics of those who had left or remained in the study at 10 years

P values were obtained from two-sample t-test for continuous variables and chi-squared or Fisherʼs exact test for categorical variables.
Abbreviations: CDR, clinical dementia rating; MMSE, mini-mental state exam; IADL, instrumental activities of daily living; mCES-D, modified Center for Epidemiologic Studies Depression scale; SD, standard deviation; TIA, transient ischemic attack.
At baseline, 1.16% of the sample was rated as CDR ≥ 1, that is, as having at least mild dementia. The proportion of attrition in participants with a baseline CDR ≥ 1 (91.3%) was much higher than those with a CDR = 0.5 (85.7%) or 0 (73.7%); therefore, for all statistical analyses, we included only participants who had a CDR < 1 at their baseline assessment (n = 1,959).
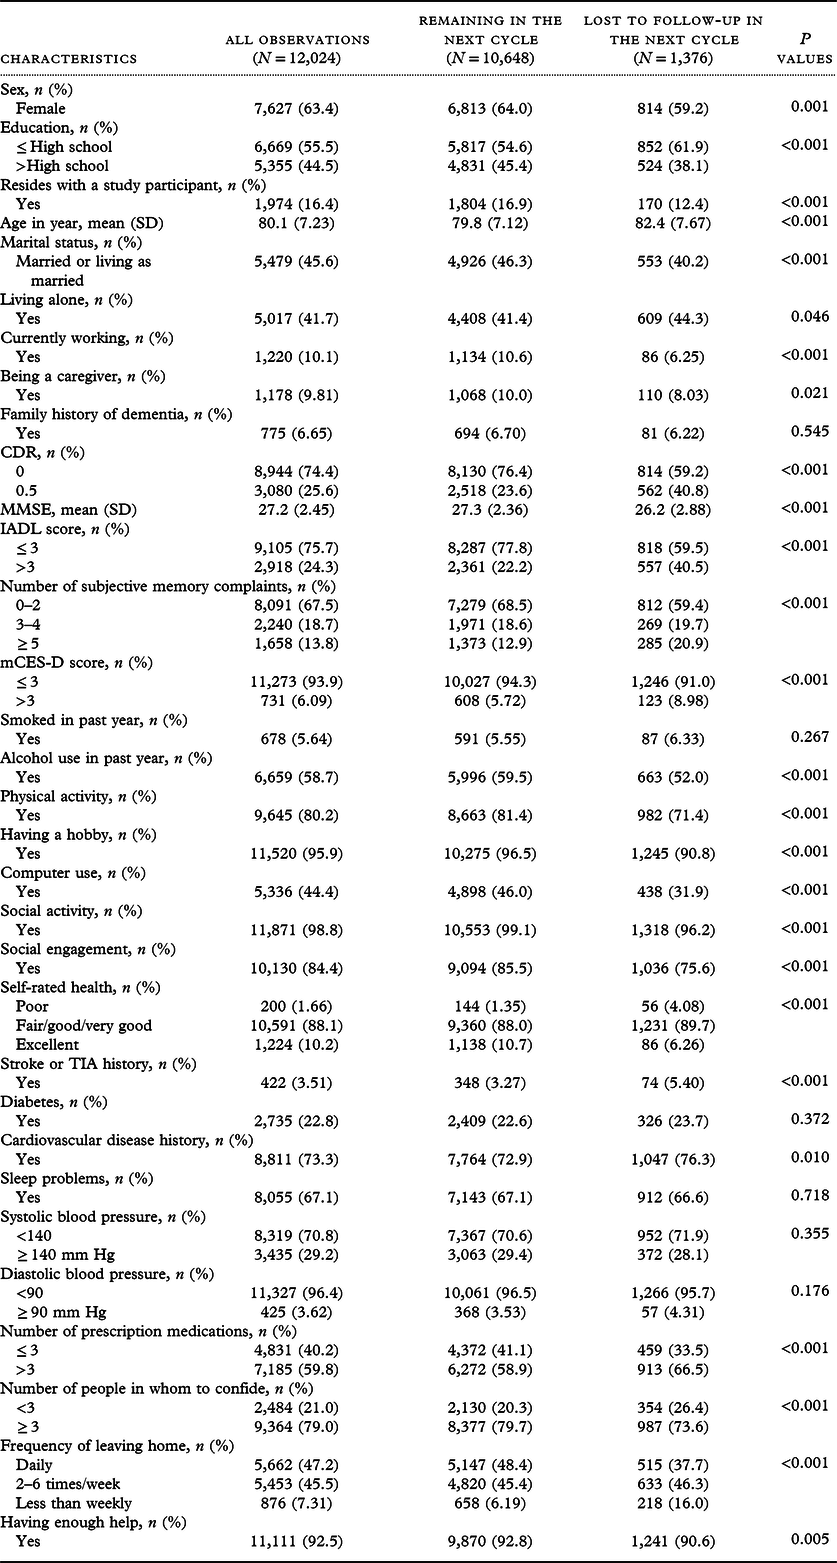
After combining data points from each participant at each annual visit (aka study cycle), Table 2 (1,959 participants with 12,024 records) shows the characteristics of participants who remained in the study vs. those who were lost in the next cycle. The association between attrition and the variables is similar to Table 1, except that attrition is also significantly associated with consuming alcohol during the preceding year, having no social activities, not being a caregiver, and feeling that one is not receiving enough help from others.
Characteristics by attrition status at the next cycle (combining data points from each participant at each annual visit*)

Table shows mean (SD) or frequency (%).
P values were based on t-test for continuous variables and chi-squared or Fisherʼs exact test for categorical variables.
Abbreviations: CDR, clinical dementia rating; MMSE, mini-mental state exam; IADL; instrumental activities of daily living; mCES-D, modified Center for Epidemiologic Studies Depression scale; SD, standard deviation; TIA, transient ischemic attack.
* Each participant can contribute to multiple records.
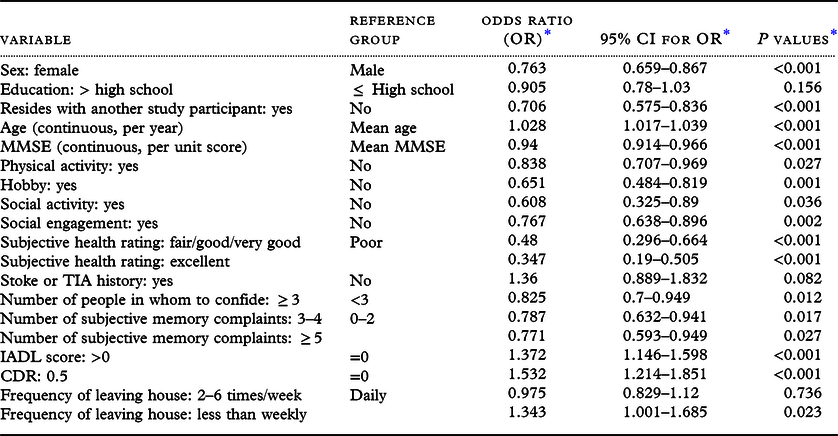
Table 3 shows the results of the multivariable logistic regression model. After adjusting for covariates, participants had a higher probability of leaving the study if they were older, male, not living with another MYHAT study participant, had no physical activities, no hobbies or interests, no social activities, no social engagement, left home less frequently, had lower MMSE scores, endorsed poor subjective health, had fewer confidants, fewer subjective memory complaints, were dependent in at least one IADL, and had a CDR > 0.
Results of multivariable logistic regression model using stepwise variable selection

Abbreviations: MMSE, mini-mental state exam; IADL; instrumental activities of daily living; TIA; transient ischemic attack; CDR, clinical dementia rating.
* For the categorical variables (all variables except age and MMSE), the odds ratio is the odds of attrition at the next cycle for this group compared to that of the reference group. For the continuous variables (age and MMSE), the odds ratio is the odds of attrition at the next cycle for a participant with one unit increase in that variable compared to another participant with a measurement of that variable at mean value. 95% confidence intervals and P values are calculated based on the robust standard errors.
The post-hoc sensitivity analyses using four different GEE structures produced results very similar to the multivariable logistic regression model. Data are not shown here but are available as an online supplement (see Supplemental Tables 1–4).
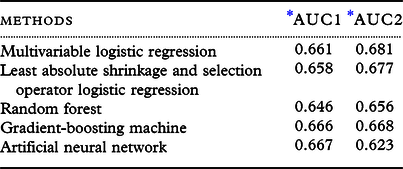
Table 4 shows the AUC allowing us to compare the discrimination performance of the final multivariable logistic regression model and four other commonly used machine learning approaches (LASSO, RF, GBM, and ANN). All five approaches produced a very similar discrimination performance (range: 0.623–0.681) in predicting the attrition status in the next cycle. The logistic regression model provided a relatively higher AUC compared to the machine learning approaches; it also provides the associations between each predictor and the outcome and estimates their effect sizes (Table 3). Therefore, we mainly present the final analysis outcome based on multivariable logistic regression model.
Classification performance via AUC using different machine learning methods

Abbreviations: AUC, areas under the receiver operating characteristic curves.
* We randomly split records into two sets (set 1 and set 2 with 1:1 splitting ratio). AUC1 used the training model from set 1 and calculating AUC by fitting the model to set 2 (the testing data). AUC2 used set 2 as the training data and set 1 as the testing data.
Discussion
In this 10-year population-based longitudinal aging study in a group of communities of low-socioeconomic status, we assessed participants annually. Although we employed several measures between visits to enhance retention, by the tenth follow-up we had lost 77% of the original cohort. Those who already had dementia at study entry had the highest subsequent attrition rate. Other longitudinal aging studies with a similar length of follow-up have reported lower rates of attrition but with younger cohorts (Cacioppo and Cacioppo, Reference Cacioppo and Cacioppo2018; Mein et al., Reference Mein2012), while an attrition rate closer to ours, after 11 years, was reported by Burke et al. (Reference Burke2019) for an older group.
At each visit, likelihood of leaving the study before the next annual visit was increased by several variables as shown in Table 3. Despite these associations having varying degrees of strength, we found several statistically significant predictors of attrition, some of which confirm the findings of previous studies, and some of which appear to be new, as we will highlight below.
In our cohort, every year of increasing age was associated with an odds ratio (OR) of 1.028 (a 2.8% higher risk) of attrition. Every point on the MMSE was associated with an OR of 0.94 (a 6% lower risk) of attrition. Older age and lower cognition have been shown to increase risk of study attrition in most previous studies, including in a systematic review of attrition in longitudinal population-based studies on aging (Burke et al., Reference Burke2019; Cacioppo and Cacioppo, Reference Cacioppo and Cacioppo2018; Chatfield et al., Reference Chatfield, Brayne and Matthews2005; Matthews et al., Reference Matthews, Chatfield and Brayne2006; Van Beijsterveldt et al., Reference Van Beijsterveldt2002), and these results are confirmed in our analyses. While we found male gender to be significantly associated with risk of attrition, the effect size was relatively smaller (OR 0.763, CI 0.659–0.867, P < 0.001). There is some consensus on this association (Mein et al., Reference Mein2012), but others have found the opposite. Van Beijsterveldt et al. (Reference Van Beijsterveldt2002) assessed dropout due to death and refusal separately and found that men were more likely to be lost due to death, while women were more likely to drop out due to refusal. Matthews et al. (Reference Matthews, Chatfield and Brayne2006) found that women were more likely to be lost but did not include attrition due to death in their analyses. We combined all forms of attrition for the current analyses as our primary objective is to understand, overall, who dropped out of our study for any reason over the first 10 years of follow-up.
In our analysis, poor subjective health had the strongest significant association with attrition of all the predictors examined (OR 0.347, CI 0.19–0.505, P < 0.001). This finding is in line with those several previous studies (Kuh et al., Reference Kuh2016; Matthews et al., Reference Matthews, Chatfield and Brayne2006; Salthouse, Reference Salthouse2014; Young et al., Reference Young, Powers and Bell2006), although other groups have found those with long-term health issues are more likely to remain in the study (Deeg et al., Reference Deeg, van Tilburg, Smit and de Leeuw2002; Mein et al., Reference Mein2012). We also found that participants who endorsed fewer subjective memory complaints were more likely to be lost to follow-up, a finding which, to our knowledge, has not been reported previously.
Social isolation and lesser engagement in social activities were also associated with attrition in our study and in other groups (Cacioppo and Cacioppo, Reference Cacioppo and Cacioppo2018; Mein et al., Reference Mein2012). Furthermore, a lack of other non-social activities (having a hobby or engaging in physical activity) were found to be associated with study loss. We also found a statistically significant association between exercise and attrition, although the effect size was relatively smaller (OR 0.838, CI 0.707–0.969, P < 0.027). To our knowledge, the association of having hobbies and interests with study attrition has not been previously examined, and very few have examined exercise and physical activity as an attrition predictor. One population-based study of a middle-aged Japanese cohort found those with lower physical activity were more likely to be lost after 5 years (Hara et al., Reference Hara2015). Although we could not determine why participants did not exercise or have hobbies, potential reasons could include apathy or depression, which are both common symptoms of MCI and dementia and may even precede cognitive decline (Gallagher et al., Reference Gallagher, Fischer and Iaboni2017).
Education did not appear to predict attrition in our study population whose median educational level was high school graduate. While other studies have demonstrated that lower education is a risk for study loss (Burke et al., Reference Burke2019; Cacioppo and Cacioppo, Reference Cacioppo and Cacioppo2018; Kuh et al., Reference Kuh2016; Matthews et al., Reference Matthews, Chatfield and Brayne2006; Young et al., Reference Young, Powers and Bell2006), the literature is mixed. Chatfieldʼs review of attrition in longitudinal aging studies failed to find an association between education and attrition (Chatfield et al., Reference Chatfield, Brayne and Matthews2005), and in the Whitehall II study, those with higher education were more likely to be lost due to non-response but not withdrawal (Mein et al., Reference Mein2012). Young adults with higher levels of education were less likely to continue participation in the Virginia Cognitive Aging Project, while there was no association in older adults who had a mean of 16 years of education (Salthouse, Reference Salthouse2014). Further investigation of education as a predictor for attrition is needed. This issue is challenging to compare across studies as not all reported a mean or median level of education, and the same grade or duration of education may represent different amounts and quality of education in different eras and generations or in different regions and populations (Liu et al., Reference Liu, Manly, Capistrant and Glymour2015).
Residing with another MYHAT study participant appeared to reduce the likelihood of attrition. While this has not previously been examined in other population-based longitudinal aging studies, similar findings have been noted for proxy partners or informants in other types of studies. Burke et al. (Reference Burke2019) examined attrition predictors in 35 Alzheimerʼs Disease Centers across the U.S.A. and found that a co-participant/informant with “questionable reliability” increased the risk of loss. Other, non-aging, studies have also found a similar association. In a cardiovascular prevention study of 2,000 middle-aged adults, having a spouse or partner in the study was associated with lower odds of attrition after 4 years (Bambs et al., Reference Bambs2013). Babatunde et al. (Reference Babatunde2017) observed that adult participants in a healthy eating and active living randomized controlled trial were more likely to continue participation after a year if they were enrolled with a partner.
All longitudinal studies, particularly of older adults, will lose participants over time. Recognizing that attrition is not random and will bias study results if ignored, the challenge is increased when the study outcome is cognitive impairment or dementia, which share common risk factors with mortality and attrition in general. If the goal is to estimate the effect of an exposure variable on cognitive impairment or incident dementia, methods to address potential attrition biases are necessary. The commonly used statistical methods include joint modeling and competing risks modeling, which simultaneously model both the primary outcome and the attrition (Agogo et al., Reference Agogo, Ramsey, Gnjidic, Moga and Allore2018; Ganguli et al., Reference Ganguli, Fu, Snitz, Hughes and Chang2013; Henderson et al., Reference Henderson, Diggle and Dobson2000; Li and Su, Reference Li and Su2018). In such analyses, attrition is not treated as missing completely at random or non-informative; instead, covariates are used to model attrition and incorporate this into the main model of cognitive impairment or incident dementia (joint modeling) or take the method that has taken informative dropout into model specification (competing risks modeling). Other approaches via propensity score modeling (Dorsett, Reference Dorsett2010; Ganguli et al., Reference Ganguli2015; Wolinsky et al., Reference Wolinsky2010) and inverse probability weighting (Daza et al., Reference Daza, Hudgens and Herring2017; Ganguli et al., Reference Ganguli2020) can be used to reform the original dataset via matching or weighting in accordance with non-response or attrition bias, thus allowing results to be generalized back to the original cohort. We caution that these post-hoc methods only help to minimize attrition bias and do not “magically” repair serious biases in the data. We have previously published work classifying attrition as informative (death and illness) and non-informative/random (loss for other reasons, e.g. relocation) and accounted for only informative attrition in the joint models (Ganguli et al., Reference Ganguli, Fu, Snitz, Hughes and Chang2013). However, here we have combined all types of attrition since all types lead to potential bias and a loss of sample size and power, and our current goal is to identify its associated factors to minimize these challenges in the future.
Identifying the characteristics of those likely to leave the study also provides researchers with the opportunity, at the time of cohort recruitment, to oversample individuals with those characteristics, thus attempting to counter the inevitable subsequent attrition bias and loss of sample size. Recruitment for our study was based on random sampling and gave us no choice in selecting potential participants; however, studies recruiting volunteers might do well to recruit two or more eligible members of the same household to increase the chance of study retention. Additionally, if one of the cohabitants became too physically or cognitively ill to continue in the study, the remaining partner could continue to provide some information about that individual by proxy, as is done in the English Longitudinal Study of Ageing (Steptoe et al., Reference Steptoe, Breeze, Banks and Nazroo2013). While it can be a challenge to oversample people who possess specific characteristics that are not known until after the study assessment is completed (e.g. cognitive status or self-rated health), opportunities can be taken to oversample the oldest-old and male participants.
Our study is novel in that, in addition to our standard regression modeling, we also employed four different machine learning approaches to predict attrition from our study cohort. It is gratifying to note that all produced similar discrimination results, thus internally validating the findings from multivariable logistic regression. Note the discrimination performance of the multivariable logistic regression and the four machine learning approaches was moderately low (AUCs <0.7 in all five methods). Other strengths of our study include its population-based nature, its large sample size at inception, its length of follow-up, as well as the relatively under-studied nature of the community, given its low-socioeconomic status. Given these study design features, it was not possible to conduct the kinds of in-depth clinical and laboratory assessments, including neuroimaging, that have become more common in aging studies. For example, Burke et al. (Reference Burke2019) found participants from various Alzheimerʼs Disease Centers with lower hippocampal volume measured by MRI were significantly more likely to be lost. In another longitudinal study of cognitive aging, greater white matter lesion volume and declines in hippocampal volume were significantly associated with attrition (Glymour et al., Reference Glymour, Chene, Tzourio and Dufouil2012). We did however include several variables which others have not, and which we found to be associated with attrition, including no reported physical activity or hobbies, and an increased number of subjective memory complaints, while residing with another study participant was protective against attrition. Finally, our study population is largely European American, reflecting the race and ethnicity of older adults in the targeted community. Our findings should be replicated in other cohorts with larger representation of ethnic minorities and a larger range of educational levels.
In conclusion, results from 10-year annual follow-up of an aging population-based cohort in a community of relatively low-socioeconomic status revealed a set of factors that predicted attrition from the study. These findings have implications for the design of future studies, including both selection/inclusion criteria to minimize attrition and appropriate weighting of study results to address potential bias from attrition.
Conflict of interest
The work reported here was supported in part by research grant R01 AG023651 from the National Institute on Aging, National Institutes of Health, and US DHHS. The National Institute of Aging had no role in the concept, design, methods, subject recruitment, data collection, preparation, or approval of the manuscript.
Dr. Ganguli served on the “AD Patient Journey Working Group” for Biogen, Inc., in 2016 and 2017. All other authors have no conflicts to disclose.
Description of authors’ roles
Erin Jacobsen contributed to the study concept and design, study supervision, data acquisition, interpretation of results, drafting, and critical revision of the manuscript.
Xinhui Ran contributed to the data analysis, interpretation of results, drafting, and critical revision of the manuscript.
Anran Liu contributed to the data analysis, interpretation of results, and critical revision of the manuscript.
Chung-Chou H. Chang contributed to the study design, interpretation of results, drafting, and critical revision of the manuscript.
Mary Ganguli contributed to the study concept and design, study supervision, interpretation of results, drafting, and critical revision of the manuscript.
Acknowledgements
The authors thank all MYHAT participants and the MYHAT project staff for their contributions to the study.
Supplementary material
To view supplementary material for this article, please visit https://doi.org/10.1017/S1041610220000447