1. Introduction
The fast-ion confinement is an important issue for the prediction of the heating efficiency in a fusion reactor. The fast-ion confinement depends not only on the collisional transport in the equilibrium magnetic field, but also on the fast-ion transport and losses induced by the fast-ion driven instabilities such as Alfvén eigenmodes (AE). Therefore, it is an important challenge to clarify the fast-ion transport due to the fast-ion driven magnetohydrodynamic (MHD) instabilities.
In the Large Helical Device (LHD), which is one of the largest helical devices, fast-ion confinement has been investigated by using the three tangential neutral beam injectors (NBIs) and two perpendicular NBIs. The fast-ion driven MHD instabilities such as the toroidal Alfvén eigenmodes (TAEs) have been observed in the LHD experiments (Osakabe et al. Reference Osakabe, Yamamoto, Toi, Takeiri, Sakakibara, Nagaoka, Tanaka and Narihara2006). In addition, the AE-induced fast-ion losses were observed by a scintillator-based fast-ion loss detector (FILD) (Ogawa et al. Reference Ogawa, Isobe, Toi, Spong and Osakabe2012). On the other hand, since there is a poloidal dependence of fast-ion loss in the LHD even without AE instabilities, it is difficult to get an overall understanding of fast-ion loss process only by the local measurements. Computer simulation is a powerful tool to investigate the interaction between fast-ions and fast-ion driven AE instabilities, such as the fast-ion transport and losses induced by the AEs.
Magnetohydrodynamic hybrid simulation models have been constructed to study the interaction between fast ions and MHD instabilities (Park et al. Reference Park, Parker, Biglari, Chance, Chen, Cheng, Hahm, Lee, Kulsrud and Monticello1992; Spong, Carreras & Hedrick Reference Spong, Carreras and Hedrick1992; Briguglio et al. Reference Briguglio, Vlad, Zonca and Kar1995; Todo et al. Reference Todo, Sato, Watanabe, Watanabe and Horiuchi1995; Todo & Sato Reference Todo and Sato1998; Fu et al. Reference Fu, Park, Strauss, Breslau, Chen, Jardin and Sugiyama2006; Wang, Zonca & Chen Reference Wang, Zonca and Chen2010; Burby & Tronci Reference Burby and Tronci2017). The multiphase MHD hybrid simulation, which is a combination of classical simulation and MHD hybrid simulation, has been developed and implemented in the MEGA code to investigate the fast-ion distribution formation process with the interaction of the MHD instabilities in the collisional time scale (Todo et al. Reference Todo, Van Zeeland, Bierwage and Heidbrink2014). The multiphase hybrid simulations were successfully validated with the tokamak experiments on the significantly flattened fast-ion pressure profile, the electron temperature fluctuations brought about by the AEs and the AE bursts (Todo et al. Reference Todo, Van Zeeland, Bierwage, Heidbrink and Austin2015; Todo Reference Todo2016; Todo, Van Zeeland & Heidbrink Reference Todo, Van Zeeland and Heidbrink2016; Bierwage et al. Reference Bierwage, Shinohara, Todo, Aiba, Ishikawa, Matsunaga, Takechi and Yagi2018; Todo Reference Todo2019). The MEGA code has been applied also to the LHD plasmas. Good agreement was found on the spatial profile and the growth rate of the ballooning modes between the MHD part of the MEGA code (MIPS code) and the CAS3D code (Nührenberg Reference Nührenberg1999; Todo et al. Reference Todo, Nakajima, Sato and Miura2010b). A reduced version of MEGA, where the AE spatial profile and the frequency are given in advance of the simulation and the evolution of the AEs and the fast ions are followed self-consistently, was developed and run to investigate the AE bursts and the fast-ion transport in LHD (Todo et al. Reference Todo, Murakami, Yamamoto, Fukuyama, Spong, Yamamoto, Osakabe and Nakajima2010a; Nishimura et al. Reference Nishimura, Todo, Spong, Suzuki and Nakajima2013). The multiphase hybrid simulation of the MEGA code was applied to the LHD experiments to investigate the fast-ion transport brought about by the AE bursts (Todo et al. Reference Todo, Seki, Spong, Wang, Suzuki, Yamamoto, Nakajima and Osakabe2017; Seki et al. Reference Seki, Todo, Suzuki, Spong, Ogawa, Isobe and Osakabe2019). The energetic-particle driven geodesic acoustic modes (EGAMs) in the LHD were simulated with MEGA. The sudden excitation of the half-frequency EGAM during the frequency chirping of the primary EGAM was reproduced, and the triggering mechanism through the nonlinear resonance overlap was discovered (Wang et al. Reference Wang, Todo, Ido and Suzuki2018). The MEGA code has been extended with kinetic thermal ions. The energy channelling from fast ions to thermal ions through the interaction with the EGAM was demonstrated for the first time (Wang et al. Reference Wang, Todo, Oasakabe, Ido and Suzuki2019), and the kinetic stabilizing effect of trapped thermal ions was found on the ballooning modes in LHD (Sato & Todo Reference Sato and Todo2019). The stabilizing effect of fast ions was also found on interchange modes in LHD if the initial total pressure profile is assumed to be the same for different fast ion pressure (Pinon, Todo & Wang Reference Pinon, Todo and Wang2018).
On the other hand, the fast-ion transport and losses due to AE burst in MEGA has not been compared with the experimental results in the non-axisymmetric three-dimensional magnetic configuration such as LHD. In the previous comparison of fast-ion losses due to AE burst in the LHD, the fast-ions detected by FILD were simulated by tracing fast-ion orbits with a model of the AE profile (Ogawa et al. Reference Ogawa, Isobe, Toi, Spong and Osakabe2012). In this comparison, the increase of fast-ion loss due to the AE burst is similar to experimental results. On the other hand, the energy of lost fast ions is only near the injection energy. Therefore, we apply the multiphase simulation to the LHD plasmas where the spatial and the velocity distribution of lost fast ions due to the AE burst was investigated with the FILD. In order to compare the MEGA simulation results with the FILD measurements, the ‘numerical FILD’ which solves Newton–Lorentz equation has been developed and implemented in the MEGA simulation where usually the guiding-centre orbits of fast ions are followed. In this work, we compare the velocity distribution of fast ions detected by ‘numerical FILD’ with that detected by the FILD in the LHD experiment. In addition, we investigate the difference between fast ions detected by the ‘numerical FILD’ and lost fast ions in the divertor region.
2. Simulation model of MEGA
We use the MEGA code (Todo & Sato Reference Todo and Sato1998), in which the bulk plasma is described by the nonlinear MHD equations and the fast ions are simulated with the gyrokinetic particle-in-cell (PIC) method. In this paper, we use the MHD equations with the fast-ion effects
 \begin{equation} \frac{\partial \rho }{ \partial t } = - \boldsymbol{\nabla} \left( \rho \boldsymbol{v} \right) + \nu_{n} \varDelta ( \rho -\rho_\textrm{eq} ), \end{equation}
 \begin{align} \rho \frac{\partial}{\partial t} \boldsymbol{v} & = - \rho \boldsymbol{v} \boldsymbol{\cdot} \boldsymbol{\nabla} \boldsymbol{v} - \boldsymbol{\nabla} p \nonumber\\ &\quad + (\, \boldsymbol{j} - \boldsymbol{j}_{h}) \times \boldsymbol{B} + \tfrac{4}{3} \boldsymbol{\nabla} \left(\nu \rho \boldsymbol{\nabla} \boldsymbol{\cdot} \boldsymbol{v} \right) - \boldsymbol{\nabla} \times \left( \nu \rho \boldsymbol{\omega} \right), \\[-2pc]\nonumber\end{align}
 \begin{align} \frac{\partial p}{\partial t} &=- \boldsymbol{\nabla} \boldsymbol{\cdot} \left( p \boldsymbol{v} \right) - \left( \gamma -1 \right) p \boldsymbol{\nabla} \boldsymbol{\cdot} \boldsymbol{v} \nonumber\\ &\quad + \left( \gamma -1 \right) [ \nu \rho \omega^{2} + \tfrac{4}{3} \nu \rho \left( \boldsymbol{\nabla} \boldsymbol{\cdot} \boldsymbol{v} \right)^{2} + \eta \,\boldsymbol{j} \boldsymbol{\cdot} (\, \boldsymbol{j} - \boldsymbol{j}_\textrm{eq} ) ] \nonumber\\ &\quad + \chi \varDelta ( p - p_\textrm{eq} ), \\[-1.5pc]\nonumber\end{align}
 \begin{equation} \frac{\partial \boldsymbol{B} }{ \partial t } = - \boldsymbol{\nabla} \times \boldsymbol{E}, \boldsymbol{j} = \frac{1}{\mu_{0}} \boldsymbol{\nabla} \times \boldsymbol{B}, \end{equation}
 \begin{equation} \boldsymbol{E} = - \boldsymbol{v} \times \boldsymbol{B} + \eta (\, \boldsymbol{j} - \boldsymbol{j}_\textrm{eq} ), \end{equation}
 \begin{equation} \boldsymbol{\omega} = \boldsymbol{\nabla} \times \boldsymbol{v}, \end{equation}
where  $\mu _{0}$ is the vacuum magnetic permeability,
 $\gamma =5/3$ is the adiabatic constant and
 $\nu$,
 $\nu _{n}$ and
 $\chi$ are artificial viscosity and diffusion coefficients chosen to maintain numerical stability. In this work, the dissipation coefficients
 $\nu$,
 $\nu _{n}$,
 $\chi$ and
 $\eta /\nu _{0}$ are assumed to be equal to each other. The dissipation terms play a physical role in enhancing the damping of AEs in the MHD simulation that does not include kinetic damping such as radiative damping (Mett & Mahajan Reference Mett and Mahajan1992) and thermal ion Landau damping. In this paper, we use one value of the coefficients,
 $5 \times 10^{-6}$, normalized by
 $v_{A}R_{0}$, where
 $v_{A}$ is the Alfvén velocity at the plasma centre and
 $R_{0}$ is the major radius at the geometrical centre of the simulation domain. The subscript ‘eq’ represents the equilibrium variables. The MHD momentum equation (2.2) includes the fast-ion current density
 $\boldsymbol {j}_{h}$ that consists of the contributions from parallel velocity, magnetic curvature and gradient drifts, and magnetization current. We see that the electromagnetic field is given by the standard MHD description. This model is accurate under the condition that the fast-ion density is much less than the bulk plasma density. The MHD equations are solved using a fourth-order (in both space and time) finite difference scheme. The fast-ion current density is defined as follows:
 \begin{equation} \boldsymbol{j}_{h} \equiv j_{h \parallel} \boldsymbol{b} + \frac{1}{B} \left( P_{h\parallel} \boldsymbol{\nabla} \times \boldsymbol{b} - P_{h\perp} \boldsymbol{\nabla} \ln B \times \boldsymbol{b} \right) - \boldsymbol{\nabla} \times \left ( \frac{P_{ h \perp}}{B} \boldsymbol{b} \right), \end{equation}
where  $j_{h \parallel }$ denotes the parallel component of the fast-ion current density. Here,
 $P_{h \parallel }$ and
 $P_{h \perp }$ are parallel and perpendicular components of fast-ion pressure, respectively. These pressure components are calculated by using the full-f PIC method based on a guiding-centre approximation. The guiding-centre equations for each computational particle are solved using a fourth-order Runge–Kutta method and the linear interpolation. The
 $\boldsymbol {E} \times \boldsymbol {B}$ drift disappears in
 $\boldsymbol {j}_{h}$ due to quasi-neutrality (Todo & Sato Reference Todo and Sato1998).
We have investigated the fast-ion distribution formation process with beam injection, collisions, losses and transport due to the AEs. A complicating factor is that the time scale of the classical processes without MHD perturbations is the slowing-down time, which is roughly 100 ms, and longer by four orders of magnitude than the typical oscillation period of AEs,  $\sim$0.01 ms. The time step width is limited by the Courant condition for fast magnetosonic waves in the hybrid simulation. On the other hand, in the classical simulation, where the MHD part of the simulation is turned off, the time step width can be taken to be greater by one order of magnitude than in the hybrid simulation. To deal with this efficiently, a multiphase simulation, where the classical simulation and the hybrid simulation are run alternately, was constructed (Todo et al. Reference Todo, Van Zeeland, Bierwage and Heidbrink2014, Reference Todo, Van Zeeland, Bierwage, Heidbrink and Austin2015, Reference Todo, Van Zeeland and Heidbrink2016; Todo Reference Todo2016; Bierwage & Todo Reference Bierwage and Todo2017). In the classical phase of the simulation, the fast-ion distribution is built up with the beam injection and collisions. In the subsequent hybrid phase, the built-up fast-ion distribution destabilizes AEs leading to the relaxation of the distribution. We should note that the classical processes, beam injection and collisions, also take place in the hybrid phase. We repeat this combination of the classical and hybrid simulations until the stored fast-ion energy is saturated.
3. Fast-ion loss simulation during the TAE burst in the LHD
3.1. TAE burst and fast-ion loss
3.1.1. Simulation condition
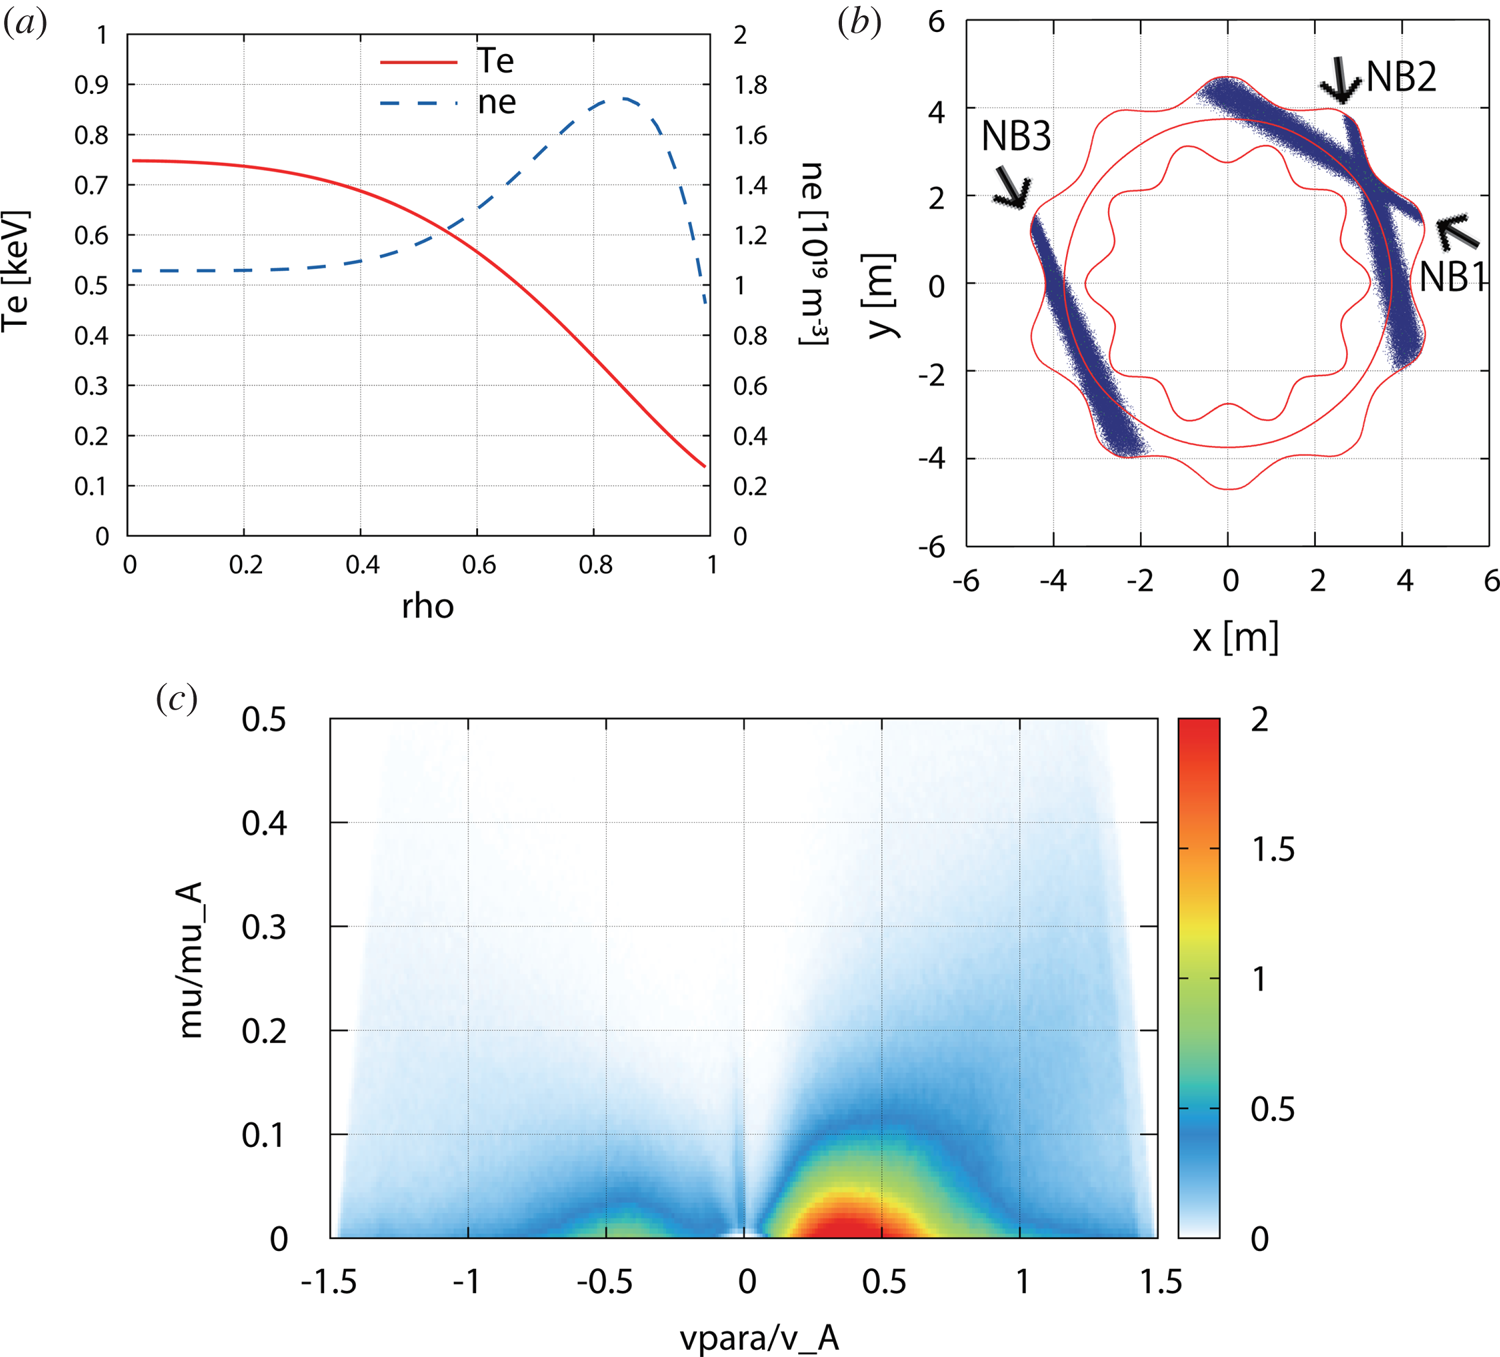
In order to clarify the fast-ion loss process due to the TAE burst, a multiphase simulation of MEGA code is applied to the LHD discharge #90090 (Ogawa et al. Reference Ogawa, Isobe, Toi, Spong and Osakabe2012), in which the fast-ion losses were observed during the TAE burst. Since the time interval of TAE burst in the LHD experiment is approximately 5 ms, the classical simulation and the hybrid simulation are alternately run for 2 ms and 3 ms, respectively. The equilibrium magnetic field is calculated by the HINT2 code (Harafuji, Hayashi & Sato Reference Harafuji, Hayashi and Sato1989; Suzuki et al. Reference Suzuki, Nakajima, Watanabe, Nakamura and Hayashi2006) based on the profiles of electron density and temperature measured in the LHD experiment. The magnetic field strength at the magnetic axis is 0.6 T. In this experiment, three tangentially injected neutral beams (NBs) composed of the two co-injected NBs and one counter-injected NB are used. The word ‘co’ means that the direction of the effective toroidal current is consistent with the clockwise directed rotational transform. The word ‘counter’ means the opposite direction. In the LHD, the ‘co’ direction approximately corresponds to the direction of the magnetic field. The injection powers of co-injected NB and counter-injected NB are approximately 10 MW and 5 MW, respectively. Using the density and temperature profiles shown in figure 1(a), the birth locations of fast ions shown in figure 1(b) are calculated by the HFREYA code considering the injection energy of each NB. In the simulation, the fast ions are traced from these non-axisymmetric birth locations and the fast ions with non-axisymmetric birth locations are used as the fast-ion source. The fast-ion distribution in the steady state is shown in figure 1(c).
(a) Electron temperature and density profiles in the LHD discharge #90090 (b) fast-ion birth locations produced by NB and (c) fast-ion distribution. In panel (a), solid and dashed lines show the temperature and density profiles, respectively. In panel (b), blue points represent the birth points projected onto the equatorial plane. Red lines represent the last closed flux surface and the magnetic axis. In panel (c), the horizontal axis is the parallel velocity normalized by the Alfvén velocity  $v_{A}$. The vertical axis is the magnetic moment normalized by
 $\mu _{A}=m v_{A}^{2}/2B_{\textrm {axis}}$.

3.1.2. Time evolution of AEs and fast-ion losses
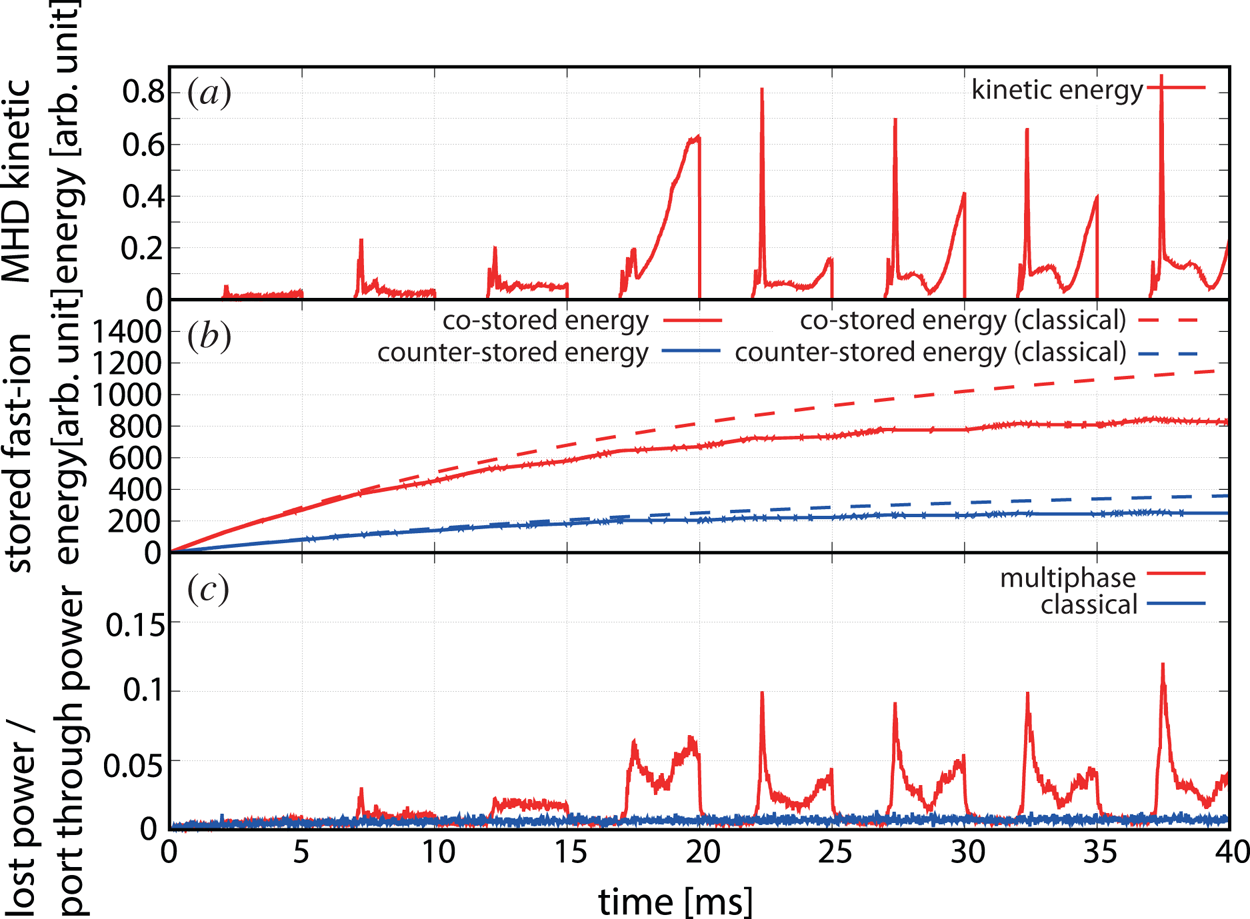
The time evolutions of MHD kinetic energy of fast-ion driven instabilities, stored fast-ion energy and lost power of fast ions due to the instabilities in the multiphase simulation with MEGA code are shown in figure 2. The fast ions that reach the divertor region or the vacuum vessel are identified as lost particles. In figures 2(b) and 2(c), the results of the ‘classical calculation’, which are the results of MEGA code without MHD instabilities, are shown for comparison. In figure 2(c), the lost power of fast ions does not include the promptly lost particles whose lifetime is less than  $50\ \mathrm {\mu }\textrm {s}$. We see in figure 2(a) that the recurrent bursts of fast-ion driven instabilities take place. As a result, the stored fast-ion energy is saturated at lower levels than in the ‘classical calculation’ (figure 2b). In addition, the lost power of fast ions shown in figure 2(c) significantly increases during each burst of the instabilities.
Time evolutions of (a) MHD kinetic energy of the fast-ion driven instabilities, (b) stored fast-ion energy and (c) lost power of fast ions. In panels (b,c), the results of the ‘classical calculation’, which are the results of MEGA code without MHD instabilities, are shown together for comparison. In panel (c), vertical axis is the lost power of fast ions normalized by port-through power. The lost power of fast ions does not include the promptly lost particles whose lifetime is less than  $50\ \mathrm {\mu }\textrm {s}$.

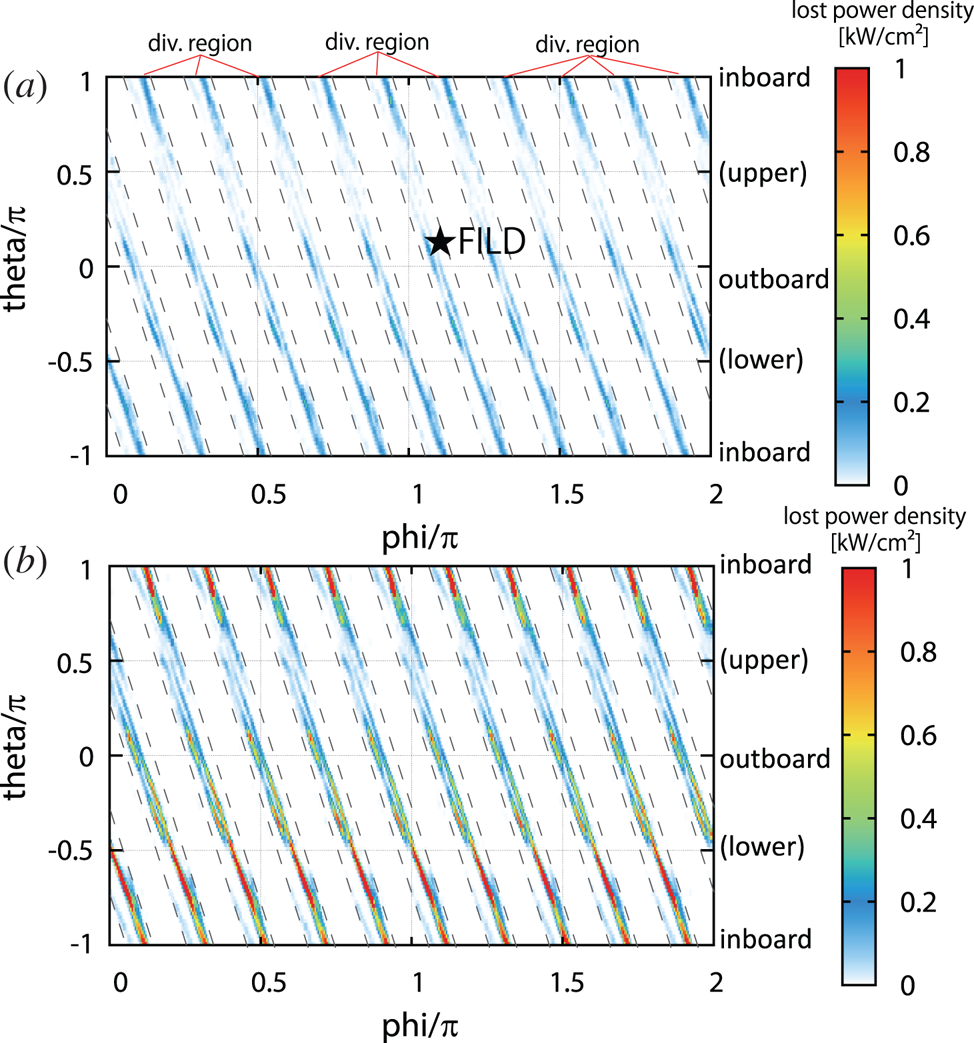
Figures 3(a) and 3(b) show the spatial distributions of power density of fast ions lost to the divertor region or the vacuum vessel in the classical phase and the hybrid phase, respectively. In figure 3, the promptly lost particles are not included. The power density of lost fast ions in the hybrid phase shown in figure 3(b) is larger than that in the classical phase shown in figure 3(a). One can observe the helical symmetry of lost fast-ion location even in the hybrid phase because most of the lost fast ions reach the divertor region following the divertor magnetic field.
Spatial distributions of power density of lost fast ion in (a) the classical phase and (b) the hybrid phase. The horizontal and vertical axes are the toroidal angle and poloidal angle of lost fast-ion location, respectively. Colour represents the power density of lost fast ion ( $\textrm {kW}\,\textrm {cm}^{-2}$). The promptly lost particles whose lifetime are less than
 $50\ \mathrm {\mu }\textrm {s}$ are not included.

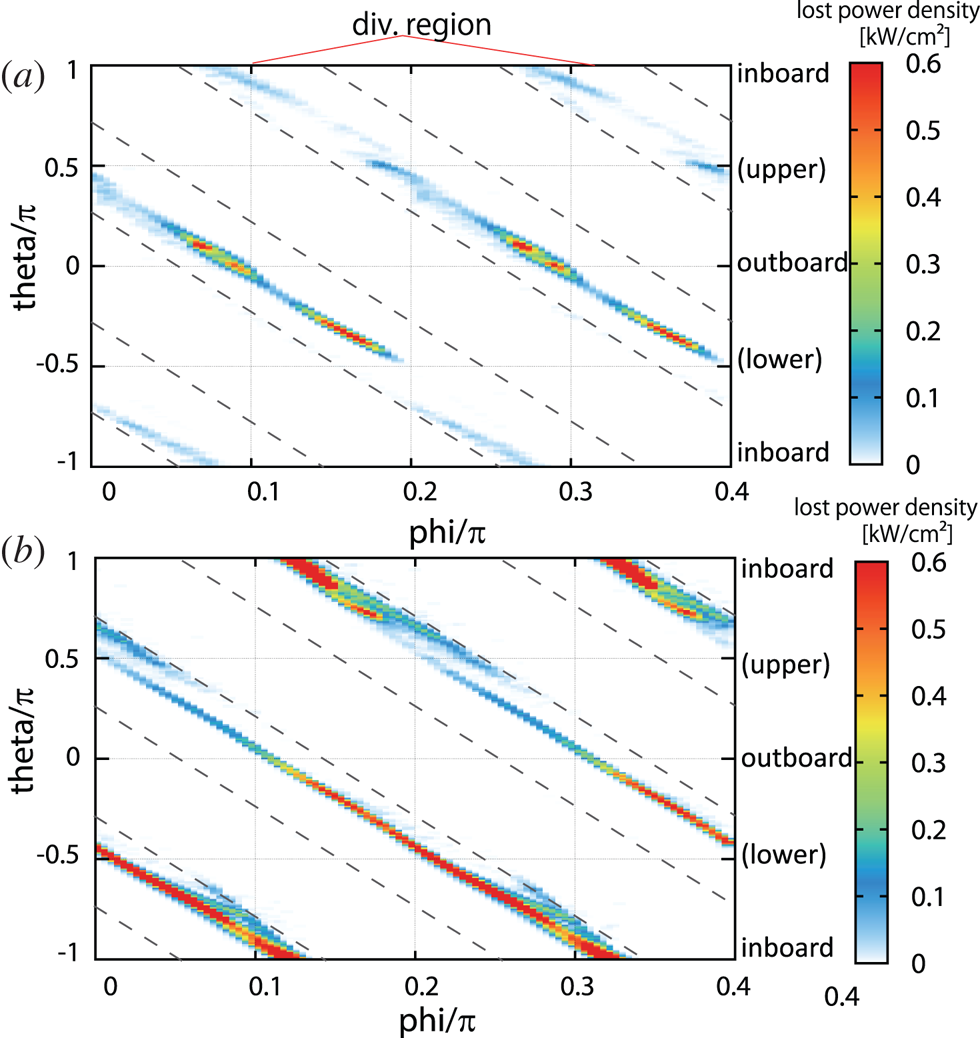
On the other hand, there are some peaks in the power density of lost fast ions along the divertor location. In order to clarify the peaks along the divertor location, the spatial distributions of the increment in the lost power of fast ions in the hybrid phase from that in the classical phase are shown for co-going fast ions in figure 4(a) and for counter-going fast ions in figure 4(b). In figure 4, the spatial distribution of power density is shown for 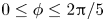 $0 \leq \phi \leq 2{\rm \pi} /5$ (two helical pitch). For the co-going fast ions, the power density of lost fast ions is larger in the outer side of the torus while the counter-going fast ions are mainly lost in the inner side of the torus. This tendency of fast-ion loss is consistent with the deviation of the fast-ion orbit from the magnetic surface due to the grad-B and curvature drifts.
Spatial distributions of increment in the power density of lost fast ions for (a) co-going fast ions and (b) counter-going fast ions. The horizontal and vertical axes are the toroidal angle and poloidal angle of lost fast-ion location, respectively. Colour represents the increment in the power density of lost fast ion ( $\textrm {kW}\,\textrm {cm}^{-2}$). In these figures, the spatial distribution of lost fast ions is shown for
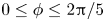 $0 \leq \phi \leq 2{\rm \pi} /5$ (two helical pitch).

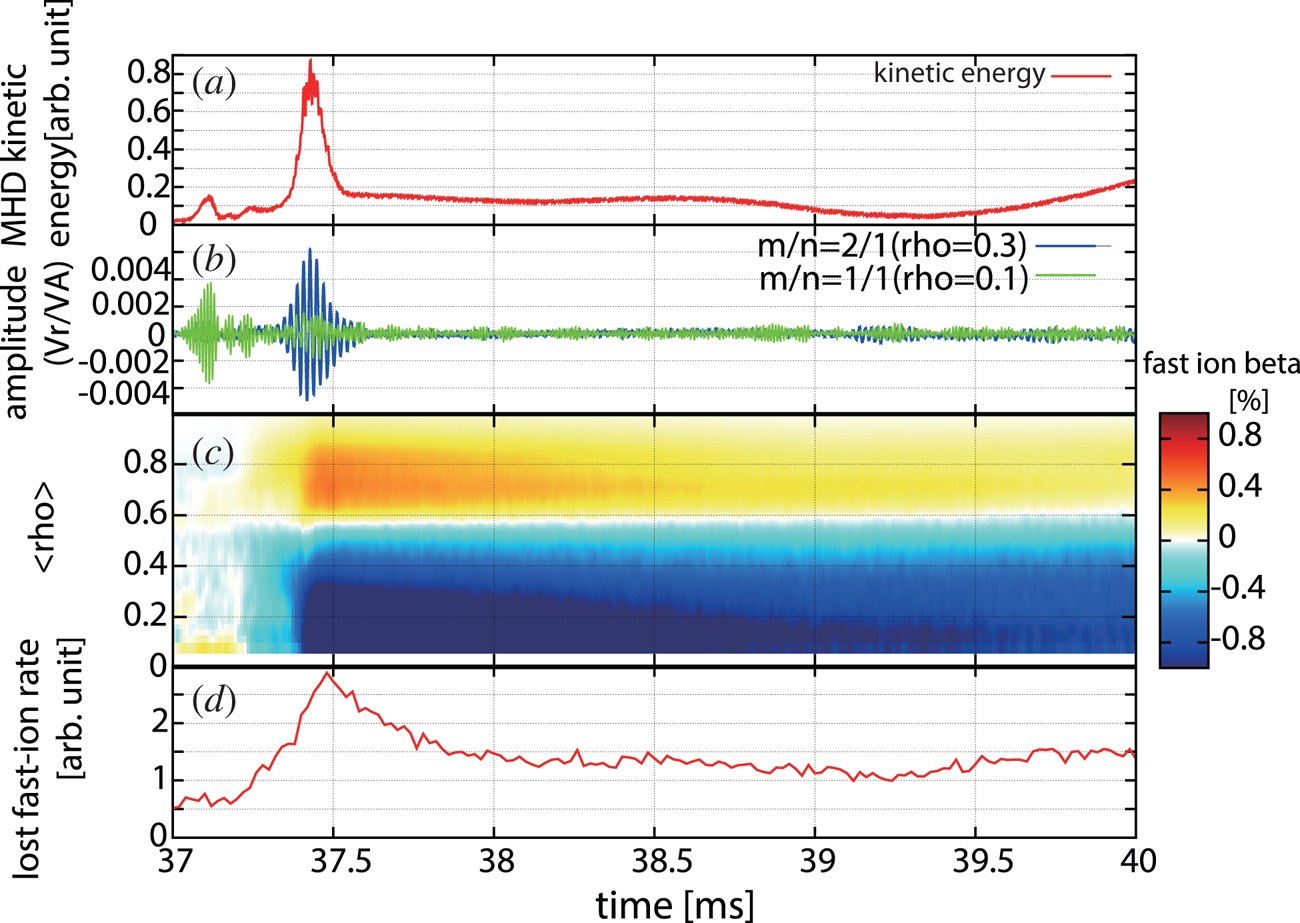
Next, we investigate the fast-ion pressure variation during the AE burst. Figure 5 shows the time evolution of MHD kinetic energy, mode amplitudes with  $m/n=2/1$ and
 $m/n=1/1$, the fast-ion pressure variation from
 $t=37$ ms, and fast-ion loss rate during the typical AE burst. Here,
 $m$ and
 $n$ represent the poloidal mode number and the toroidal mode number, respectively. The mode amplitudes with
 $m/n=2/1$ and
 $m/n=1/1$ are evaluated at
 $\textrm {rho}=0.3$ and
 $\textrm {rho}=0.1$, respectively. These radial positions are near the maxima of mode amplitudes as shown in Seki et al. (Reference Seki, Todo, Suzuki, Spong, Ogawa, Isobe and Osakabe2019). In figure 5(b), the primary mode number at the beginning of the AE burst is
 $m/n=1/1$. And then, the instability with
 $m/n=2/1$ becomes large in this MEGA simulation. The frequency of AE with
 $m/n=2/1$ is
 $\sim$50 kHz. The frequency is close to experiments #90090 (Ogawa et al. Reference Ogawa, Isobe, Toi, Spong and Osakabe2012). The increase of the MHD kinetic energy for
 $t > 39.5$ ms is caused by low frequency MHD instabilities near the peripheral region. Therefore, the mode amplitudes of AE do not increase for
 $t > 39.5$ ms. The detailed analyses of the AE burst were summarized in Seki et al. (Reference Seki, Todo, Suzuki, Spong, Ogawa, Isobe and Osakabe2019). It is found in figure 5 that the fast-ion pressure profile rapidly changes at the peak of the
 $m/n=2/1$ mode amplitude. The fast-ion pressure decreases for
 $\textrm {rho} < 0.6$ and increases for
 $\textrm {rho} >0.6$. After the peak of the
 $m/n=2/1$ mode amplitude, the fast-ion pressure profile gradually recovers. The effect of the
 $m/n=1/1$ mode on the fast-ion loss rate is weak because this mode is located near the plasma centre.
Time evolutions of (a) MHD kinetic energy, (b) mode amplitudes with  $m/n=2/1$ and
 $m/n=1/1$, (c) fast-ion pressure profile variation and (d) fast-ion loss rate during a burst of fast-ion driven instabilities. In panel (c) colour represents the difference of fast-ion pressure from that before the AE burst at
 $t=37$ ms. In panel (d), fast-ion loss rate does not include the promptly lost particles whose lifetime is less than
 $50\ \mathrm {\mu }\textrm {s}$.

3.2. Validation of fast-ion loss simulation with FILD measurements
3.2.1. Model of numerical FILD
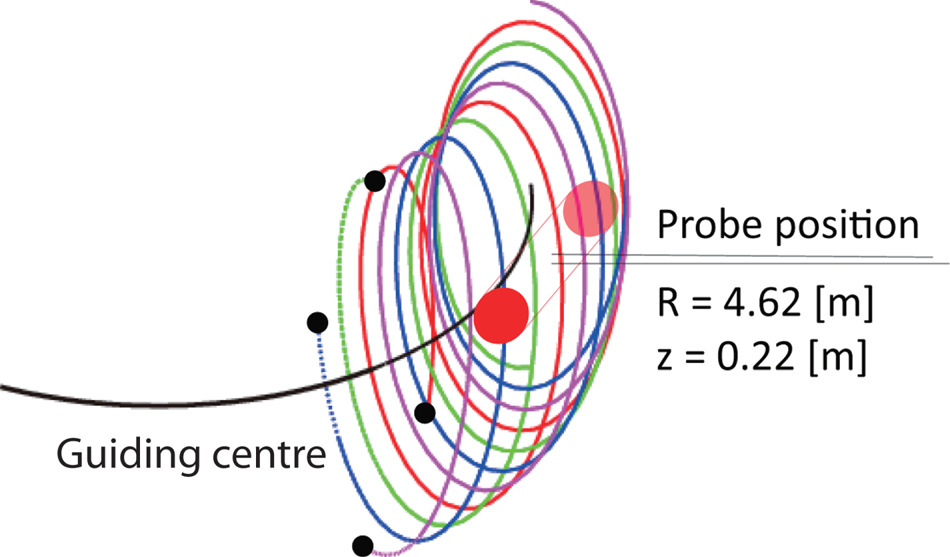
In order to validate the fast-ion loss simulation with MEGA code, the velocity distribution of lost fast ions calculated by MEGA is compared with that measured by FILD. In the FILD in the LHD experiments, the velocity distribution of the co-going fast ions lost due to AE burst is observed. Here, the ‘numerical FILD’ has been developed in order to compare the MEGA simulation with the FILD measurements. In the numerical FILD, the position of the probe and the aperture is set in accordance with the FILD installation position. The aperture shape of the numerical FILD is a circle with radius 6 mm. The aperture size of the numerical FILD is set approximately five times larger than that of the actual FILD in order to reduce the Monte Carlo error by increasing the number of fast ions detected with the numerical FILD. In the numerical FILD, fast ions near the installation position of the FILD are retraced along the full orbit following the Newton–Lorentz equation. In the standard MEGA simulation, the guiding-centre orbits of fast ions are followed. For each guiding-centre particle, 64 particles with different gyration phase are traced. Figure 6 is a schematic picture of the numerical FILD. Only fast ions passing through the aperture are detected by the numerical FILD. We see the helical symmetry in the lost fast-ion location shown in figures 3 and 4. Though the AEs and the beam deposition location do not have the helical symmetry we need the whole-device simulations, the AEs and fast ions propagate in both poloidal and toroidal directions. Our interpretation is that the asymmetric effects of the AEs and the beam deposition location are smoothed out during their propagation leading to the helical symmetry in the lost fast-ion location. Then, we expect the approximate helical symmetry also for the FILD measurements and set 10 numerical FILDs in the helically symmetric locations to reduce the Monte Carlo error.
Model of the numerical FILD for LHD.

3.2.2. Comparison between numerical FILD and FILD measurements
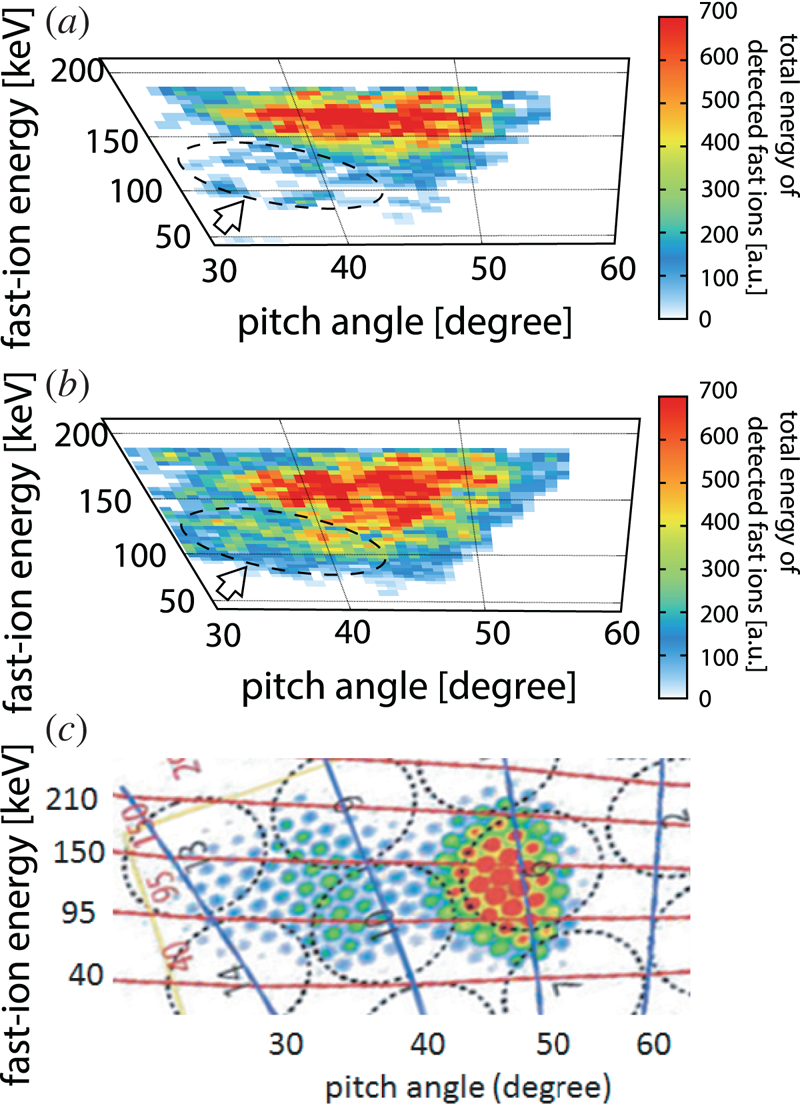
The numerical FILD is introduced to the fast-ion loss simulation with MEGA code, and the velocity distribution of lost fast ions is investigated with the numerical FILD. Figure 7 compares the numerical FILD measurement for the pitch angle and energy distributions of lost fast ions during the AE burst with the FILD measurement in the LHD. The lost fast-ion measurements of FILD shown in figure 7(c) were published in Ogawa et al. (Reference Ogawa, Isobe, Toi, Spong and Osakabe2012). In figure 7(a), fast ions with energy close to the injection energy are mainly detected by the numerical FILD before the AE bursts. During the AE burst, we see in figure 7(b) that fast ions of 100–150 keV and  $35^{\circ }\text {--}50^{\circ }$ are detected by the numerical FILD. In the previous comparison, the energy of fast ions detected is only near the injection energy (Ogawa et al. Reference Ogawa, Isobe, Toi, Spong and Osakabe2012). The velocity space region of the lost fast ions due to the AE burst is in good agreement with that observed in the experiment shown in figure 7(c), although the two peaks observed in the experiment are not well resolved in the numerical FILD. This discrepancy can be attributed to the aperture size of the numerical FILD which is approximately five times larger than that of the FILD in the experiment. Therefore, the fast ions with the wider range of pitch angle and energy may be detected by the numerical FILD rather than those detected by the FILD in the experiment. In Ogawa et al. (Reference Ogawa, Isobe, Toi, Spong and Osakabe2012), it was shown that the lost fast ions with pitch
 $\text {angle} = 30^{\circ }\text {--}40^{\circ }$ detected by the FILD increased during the AE burst. The numerical FILD measurement is consistent with the experiment for the lost fast ions with pitch
 $\text {angle}= 30^{\circ }\text {--}40^{\circ }$. Most of the fast ions detected are re-entering fast ions which re-enter the plasma after passing through outside of plasma (Seki et al. Reference Seki, Matsumoto, Suzuki, Watanabe and Itagaki2008). These re-entering fast ions are not directly lost in the divertor region. The difference between the fast ions detected by the ‘numerical FILD’ and the lost fast ions to the divertor region is discussed in § 3.3.
Comparison of pitch angle and energy distribution of lost fast ions among (a) MEGA simulation before AE burst, (b) MEGA simulation during AE burst and (c) FILD measurements during AE burst. Colour represents the total energy of the detected fast ions (arbitrary units). The lost fast-ion measurements with FILD shown in panel (c) were published in Ogawa et al. (Reference Ogawa, Isobe, Toi, Spong and Osakabe2012).

3.3. Comparison between fast ions detected by numerical FILD and fast ions lost to divertor region
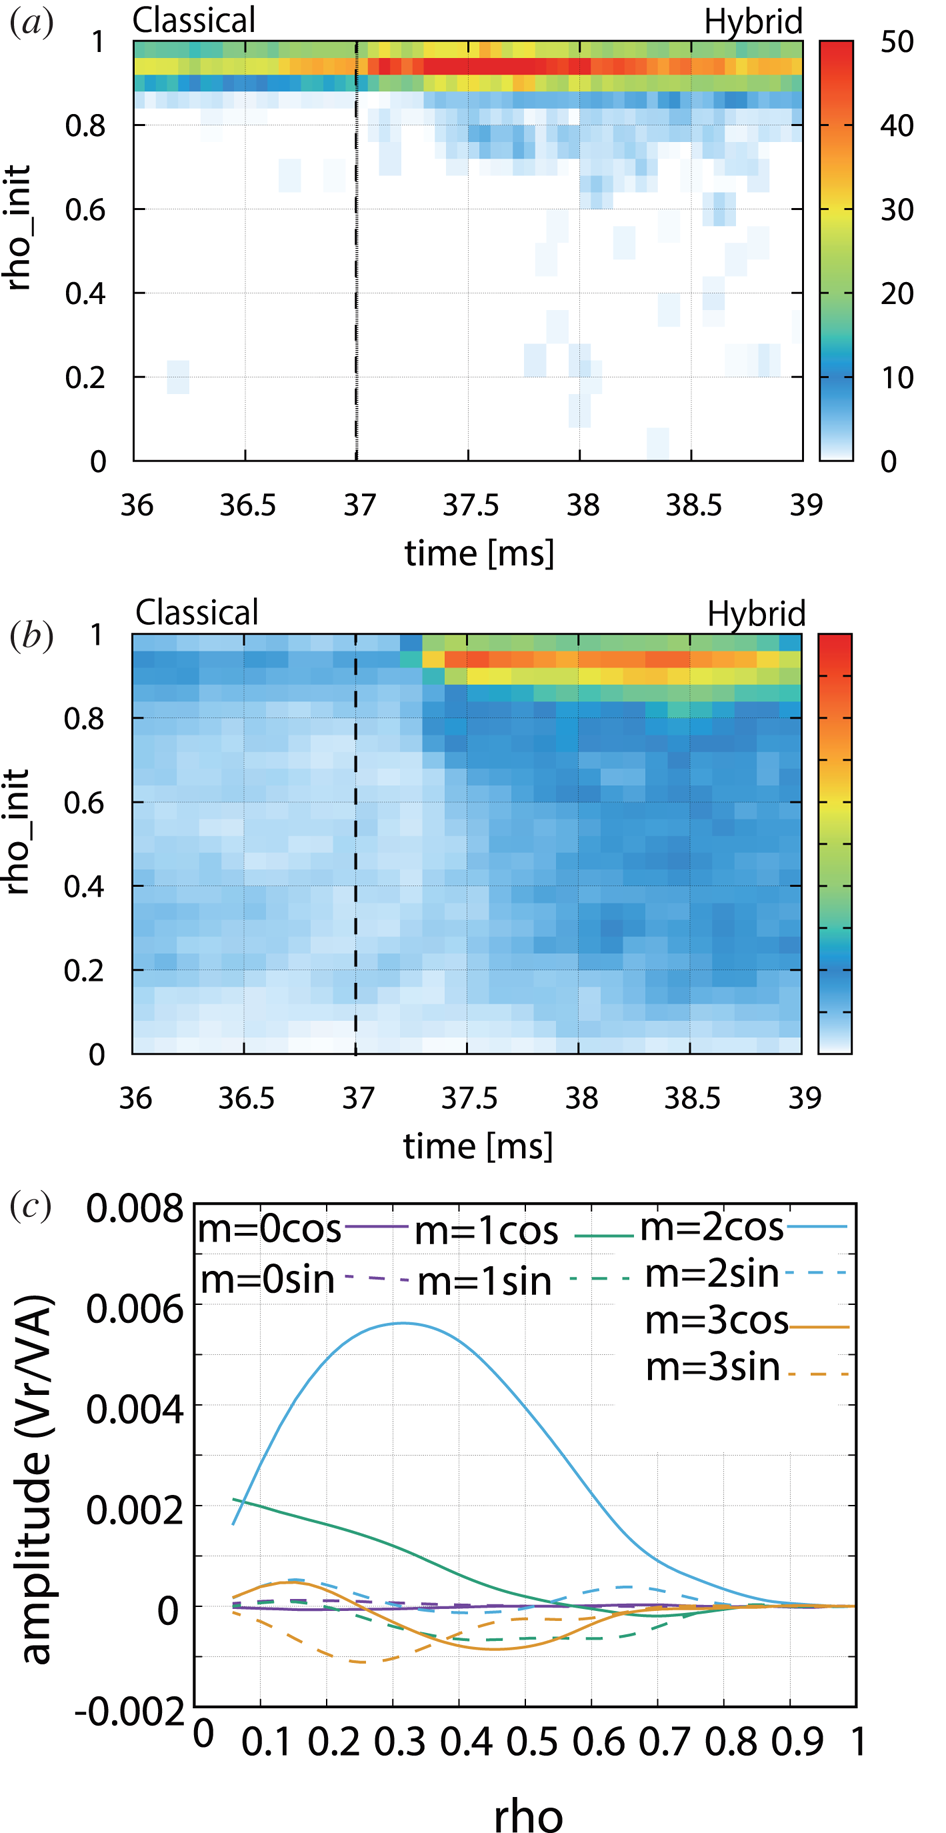
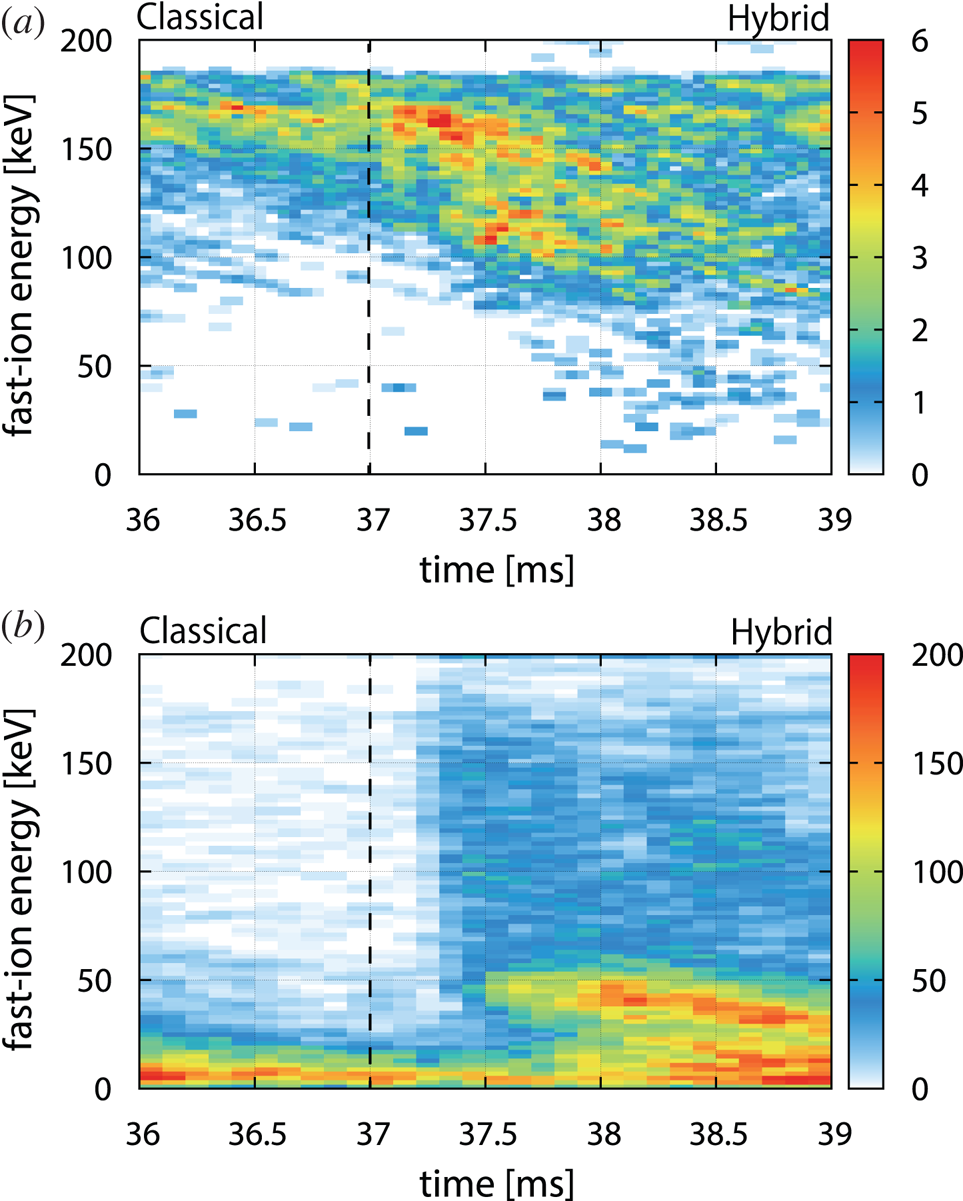
We examined the fast ions lost to the divertor region during the AE burst (Seki et al. Reference Seki, Todo, Suzuki, Spong, Ogawa, Isobe and Osakabe2019). Here, we investigate the difference between fast ions detected by the numerical FILD, in which co-going fast ions are mainly detected, and co-going fast-ions lost to the divertor region. Figure 8 compares the radial deposition profiles of the lost fast ions detected by the numerical FILD and the lost fast ions to the divertor region. In this simulation, the AE burst occurs at  $t=37.4$ ms as shown in figure 5. In figure 8(b), the deposition points of co-going fast ions lost to the divertor region are located up to the plasma centre before the AE burst as well as during the AE burst. During the AE burst, the loss of co-going fast ions with the deposition point near the peripheral region increases significantly. On the other hand, most of the fast ions detected by the numerical FILD are the fast ions deposited near
 $\textrm {rho} \sim 0.9$ even before the AE burst. This is because most of fast ions detected by the numerical FILD are re-entering particles. In the numerical FILD, the fast ions deposited up to
 $\textrm {rho} \sim 0.7$ are detected only during the AE burst. This result indicates that fast ions which are transported to the peripheral region of the plasma during the AE burst are detected. Figure 9 compares the time evolutions of energy distribution of the lost fast ions detected by the numerical FILD and the lost fast ions to the divertor region. In this simulation, there is a clear difference in energy distribution between the fast ions detected by the numerical FILD and the fast ions lost to the divertor region. Before the AE burst, fast ions with high energy (150–180 keV) close to the beam injection energy (
 ${\sim }180$ keV) are mainly detected by the numerical FILD. During the AE burst, fast ions with middle energy (100–150 keV) are detected by the numerical FILD in addition to the high-energy particles with 150–180 keV. On the other hand, the main component of co-going fast ions lost to the divertor region are the particles with energy lower than 50 keV. This difference between the fast ions detected by the numerical FILD and the co-going fast ions lost to the divertor region arises because most of the fast ions detected by the numerical FILD are re-entering fast ions. The re-entering fast ions are not directly lost in the divertor region, as mentioned in § 3.2.2.
Time evolution of the radial deposition profile of (a) fast ions detected by numerical FILD and (b) co-going fast ions lost to the divertor region. Colour represents the number of fast ions (arbitrary units). In panel (c), the radial profile of mode amplitude at the maxima of this AE burst are shown for reference. The hybrid phase of the multiphase simulation is 37 ms–40 ms, and the classical phase where the MHD perturbations are tuned off is 35 ms–37 ms. The AE burst occurs at  $t=37.4\ \textrm {ms}$ as shown in figure 5.

Time evolution of energy profile of (a) fast ions detected by the numerical FILD and (b) co-going fast ions lost to the divertor region. Colour represents the number of fast-ions (arbitrary units). The hybrid phase of the multiphase simulation is 37 ms–40 ms, and the classical phase where the MHD perturbations are turned off is 35 ms–37 ms. The AE burst occurs at  $t=37.4\ \textrm {ms}$ as shown in figure 5.

4. Summary
We have conducted the multiphase simulations with the kinetic-MHD hybrid code MEGA to investigate the spatial and the velocity distributions of lost fast ions due to the AE bursts in the LHD plasmas. We found that fast ions are lost along the divertor region with helical symmetry both before and during the AE burst except for the promptly lost particles. On the other hand, several peaks are present in the spatial distribution of lost fast ions along the divertor region. These peaks along the divertor region can be attributed to the deviation of the fast-ion orbits from the magnetic surfaces due to the grad-B and the curvature drifts.
In order to compare the MEGA simulation with the FILD measurements, the ‘numerical FILD’ which solves the Newton–Lorentz equation have been developed and implemented in the MEGA simulation. In the MEGA simulation with ‘numerical FILD’, the velocity space distribution of the lost fast ions due to the AE burst is in good agreement with that observed in the experiment, although the two peaks observed in the experiment are not well resolved in the numerical FILD. This agreement validates the MEGA simulation on the lost fast-ion distribution in the divertor region.
We investigated the difference between the fast ions detected by the numerical FILD and the co-going fast ions lost to the divertor region. In the numerical FILD, co-going fast ion are mainly detected. The deposition points of the co-going fast ions lost to the divertor region are located up to the plasma centre before the AE burst as well as during the AE burst. During the AE burst, co-going fast ions with the deposition point near the peripheral region are significantly lost.
On the other hand, most of the fast ions detected by the numerical FILD are fast ions deposited near  $\textrm {rho} \sim 0.9$ even before the AE burst. The main component of the co-going fast ions lost to the divertor region are the particles with lower energy than 50 keV. Most of the lost co-going fast ions to the divertor region are lost after slowing down. On the other hand, before the AE burst, fast ions with high energy (150–180 keV) close to the beam injection energy (
 ${\sim }180$ keV) are mainly detected by the numerical FILD. During the AE burst, fast ions with middle energy (100–150 keV) are detected by the numerical FILD in addition to the high-energy particles with 150–180 keV. These differences can be attributed to the orbits of the fast ions detected by the numerical FILD. The fast ions detected by the (numerical) FILD re-enter the plasma if the (numerical) FILD is not present and are not directly lost in the divertor region.
The discrepancy between numerical FILD and FILD measurement is because the aperture size of numerical FILD is approximately five times larger than that of the actual FILD. In the near future, fast-ion loss will be analysed by numerical FILD with the aperture close to actual size. The time evolution of fast-ion loss will be calculated by only hybrid simulation. In the LHD, the time evolution of the fast-ion energy distribution associated with the AE burst has been observed with the electric field parallel to the magnetic field type neutral particle analyser ( $\textrm {E}\parallel \text {B-NPA}$) (Fujiwara et al. Reference Fujiwara, Kamio, Ogawa, Yamaguchi, Seki, Nuga, Nishitani, Isobe and Osakabe2020). In our future work, the MEGA simulation results will be compared with the
 $\textrm {E}\parallel \text {B-NPA}$ measurements in order to clarify the nonlinear interaction between fast ions and AEs.
Acknowledgements
Numerical computations were performed at the Plasma Simulator (FUJITSU FX100) of NIFS with the support and under the auspices of the NIFS Collaboration Research programs (NIFS19KNSR009), and the K Computer of the RIKEN Advanced Institute for Computational Science (Project ID: hp180200). This work was partly supported by MEXT as ‘Priority Issue on Post-K computer’ (Accelerated Development of Innovative Clean Energy Systems).
Editor Per Helander thanks the referees for their advice in evaluating this article.
Declaration of interests
The authors report no conflict of interest.