1. Introduction
Rapid change in the legal and political environment in which gay men and lesbian women live motivates a growing body of research on the economics of sexual orientation. This study documents differences in labor market outcomes for gay men and lesbian women relative to their heterosexual counterparts [Klawitter (Reference Klawitter2015)], and it shows that laws requiring equal treatment at work and in legal partnerships improve outcomes [Dillender (Reference Dillender2014), Martell (Reference Martell2014), Trandafir (Reference Trandafir2015), Burn (Reference Burn2018)]. It is likely that tolerance of homosexuality is related to both the passage and the effectiveness of laws promoting equal treatment, suggesting that changes in tolerance over time and differences across space have the potential to impact the economic lives of sexual minorities. While the impact of tolerance on macroeconomic performance has been hotly debated [Berggren and Elinder (Reference Berggren and Elinder2012), Bomhoff and Lee (Reference Bomhoff and Hooi Yean Lee2012)], research on the ways that tolerance influences the lives of gay men and lesbian women in the United States has been limited. One study measures the influence of increases in tolerance over time on the health outcomes of gay men [Francis and Mialon (Reference Francis and Mialon2010)], and two others measure the influence of persistent cross-state differences in tolerance on wage penalties for gay men [Hammarstedt et al. (Reference Hammarstedt, Ahmed and Aldén2015), Burn (Reference Burn2020)]. Both find that more tolerance improves men's outcomes. We contribute to the literature on the United States by incorporating state-level panel data on tolerance into the analysis of time in paid work for both cohabiting women and men. We focus on time spent in paid work because it generally necessitates interpersonal interactions that subject gays and lesbians to the costs of intolerance and stigma.
We use data covering 2003 to 2015. The data come from the American Community Survey and the General Social Survey. Increases in tolerance of homosexuality are meaningfully related to how much time cohabiting gay men spend in paid labor. A 1 percentage point increase in the share of a state's population that is tolerant is associated with one and half hours more paid work annually among cohabiting gay men relative to heterosexual men. In the average state, tolerance increased 18 percentage points between 2003 and 2015, so the result is a gain of almost a week of work per year. Among cohabiting lesbian women, a 1 percentage point increase in tolerance is associated with nearly one less hour of paid work relative to cohabiting heterosexual women; however, the association is not robustly statistically significant.
A potentially formative role for tolerance on the economic lives of gay men and lesbian women, as well as the asymmetry of the results, is consistent with more than two decades of research on earnings differentials. To summarize, gay men experience a 15–20% earnings penalty, but the penalty has been declining. Lesbian women earn more than heterosexual women, but estimates of the lesbian premium span a wide range, have been shrinking, and may no longer exist. [For summaries, see Badgett Reference Badgett1995), Klawitter (Reference Klawitter2015), Martell and Hansen (Reference Martell and Eschelbach Hansen2017), Badgett et al. (Reference Badgett, Carpenter and Sansone2021).]
The source of earnings differentials is a subject of ongoing debate. The gay earnings penalty is consistent with discrimination based on sexual orientation [Badgett (Reference Badgett1995), Carpenter (Reference Carpenter2007), Klawitter (Reference Klawitter2015), Bryson (Reference Bryson2017), Burn (Reference Burn2020], but the lesbian premium is not. Simultaneous lesbian premiums and gay penalties are consistent with two explanations [Klawitter (Reference Klawitter2015)]. There may be higher (lower) perceived levels of masculinity or assertiveness among lesbians (gay men) relative to heterosexual women that are rewarded in the labor market [Blandford (Reference Blandford2003)]. Alternatively, there may be differences in patterns of household specialization across household types [Jepsen (Reference Jepsen2007), Giddings et al. (Reference Giddings, Nunley, Schneebaum and Zietz2014), Jepsen and Jepsen (Reference Jepsen and Jepsen2015]. Because they lack a woman partner, gay men may spend more time on household duties than heterosexual men. Because lesbians have a woman partner, they spend less time in household duties than heterosexual women. As a result, lesbians may be more attached to the labor market than their heterosexual counterparts, while gay men are less attached. Patterns of labor supply among same-sex households are consistent with the latter explanation [Antecol et al. (Reference Antecol, Jong and Steinberger2008), Giddings et al. (Reference Giddings, Nunley, Schneebaum and Zietz2014)].
The findings here have two implications for our understanding of these wage differentials. First, the findings suggest that increasing tolerance may explain some of the recent decreases in the earnings differentials that gay men and lesbian women experience [see also Jepsen and Jepsen (Reference Jepsen and Jepsen2020)]. Second, that higher tolerance is, however weakly, associated with less paid work among lesbians provides further evidence that their earnings advantage reflects stronger labor market attachment rather than rewards for their disposition at work.
Finding an association between tolerance and paid work is also consistent with the documented effects of laws promoting equal treatment. State employment nondiscrimination acts (ENDAs) reduce the wage penalty and increase the labor supply of gay men [Gates (Reference Gates2009), Martell (Reference Martell2013b, Reference Martell2014), Burn (Reference Burn2018)]. Legalizing same-sex marriage is negatively correlated with the labor supply of lesbian women relative to their heterosexual peers, but it is not correlated with the labor supply of gay men relative to heterosexual men [Hansen et al. (Reference Hansen, Martell and Roncolato2020)].
Equal rights laws themselves, and in combination with increasing levels of education and secularization and declining levels of religiosity and conservative gender norms, increase tolerance toward homosexuality in Europe [Abou-Chadi and Finnigan (Reference Abou-Chadi and Finnigan2019), Aksoy et al. (Reference Aksoy, Carpenter, De Haas and Tran2020] and the United States [Hooghe and Meeusen (Reference Hooghe and Meeusen2013), Flores and Barclay (Reference Flores and Barclay2016)]. Because, as noted above, more tolerance is associated with less economic vulnerability for gay men and lesbian women [Hammarstedt et al. (Reference Hammarstedt, Ahmed and Aldén2015), Burn (Reference Burn2020)], the findings here highlight the importance of implementing public policies that may be less politically divisive than employment nondiscrimination laws and marriage equality. Anti-bullying campaigns, inclusive school curricula, and other efforts to promote tolerance of LGBTQ persons and other minorities may support economic equality, in addition to protecting the health and safety of all.
In summary, while many have emphasized that the labor supply of gay men and lesbian women is, among other behaviors, influenced by tolerance [Badgett (Reference Badgett2001), Antecol et al. (Reference Antecol, Jong and Steinberger2008), Giddings et al. (Reference Giddings, Nunley, Schneebaum and Zietz2014), Klawitter (Reference Klawitter2015)], to the best of our knowledge we are the first to estimate the extent to which tolerance is correlated with the labor supply of both men and women in the United States.
2. Conceptual framework
There are three channels through which tolerance of homosexuality may affect the labor supply of gay men and lesbian women. The first channel is improving the workplace experience. The second is reducing discrimination in wages, hiring, and firing. The third is that growing support of family and community may reduce the risks of household specialization.
Greater tolerance of homosexuality may motivate gay men and lesbian women to spend more time in paid labor because tolerance increases the utility of interpersonal interactions at work [Berg and Lien (Reference Berg and Lien2002), Martell (Reference Martell2013a)]. Gay and lesbian workers who do not conceal their sexual orientation are open to negative interactions if the environment at work is intolerant. Negative interactions make work less enjoyable. For workers who are “out” at work, greater tolerance may reduce negative interactions and increase labor supply. Gay and lesbian workers who choose to conceal their sexual orientation at work must expend effort to conceal it. The effort increases the disutility of labor and may lead to less time in paid labor. For workers who are not “out” at work, greater tolerance may decrease the need to conceal and increase labor supply. This channel may operate at both intensive and extensive margins of labor supply.
Greater tolerance reduces discrimination in pay for gay men [Burn (Reference Burn2020]. Higher wages, of course, are likely to increase labor supply at both the intensive and extensive margins. Gay men and lesbian women also face discrimination in hiring and a higher risk of job loss [Tilcsik (Reference Tilcsik2011)]. We would typically predict that, if greater tolerance reduces discrimination in hiring and firing, it is likely to increase labor supply at the extensive margin. However, the literature suggests that gay men and lesbian women who do secure jobs in intolerant environments try to increase their job security by putting in more work effort and time [Badgett (Reference Badgett1995), Martell (Reference Martell2020)]. If gay and lesbian workers pursue this strategy, then greater tolerance may enable them to reduce work effort and hours. This channel may be most detectable at the intensive margin of labor supply, but, to the extent that wages fall with effort, it may also decrease labor force participation.
Finally, greater tolerance may increase the support that gay and lesbian workers receive from family and community. Support from family and community provides households with some insurance against the risks of shocks to labor income, which in turn facilitates specialization within the household. In different-sex households, family and community support helps to enable the traditional pattern of specialization, which is (of course) to have one member of the household contribute more income from paid work, while the other contributes more household production [Becker (Reference Becker1981)]. In intolerant environments, same-sex households have less access to support. This is one reason why same-sex households have historically minimized household specialization [Giddings et al. (Reference Giddings, Nunley, Schneebaum and Zietz2014), Jepsen and Jepsen (Reference Jepsen and Jepsen2015), Klawitter (Reference Klawitter2015)]. An increase in tolerance may enable same-sex households to adopt patterns of household specialization that are more similar to different-sex households. If this channel is at work, greater tolerance may reduce the labor supply of one member of a same-sex household at the same time that it increases the labor supply of the other member. Again, this channel may operate on both intensive and extensive margins.
Unfortunately, available data do not allow us to disentangle the three channels. We can measure only their net change. Its sign is ambiguous a priori.Footnote 1
3. Data
To measure the extent of correlation between tolerance of homosexuality and paid work, we first draw data on tolerance by state and year from the General Social Survey (GSS), which is implemented every other year. We then merge the tolerance data with observations of labor supply and demographic controls from the American Community Survey (ACS). The data cover every other year from 2003 through 2015.
3.1. Tolerance
The GSS consistently asks questions about tolerance of homosexuality.Footnote 2 The GSS is a nationally representative probability sample of people residing in the United States. It collects a wide range of demographic and social data. We measure tolerance of homosexuality as the percent of respondents in each state and year who say that “sexual relations between two adults of the same sex” are “not wrong at all,” or “wrong only sometimes.”Footnote 3
The GSS question is similar to items on the psychometric scale of attitudes toward homosexuals [Herek (Reference Herek1988)], including, “Homosexual behavior between two men is just plain wrong.” Validated measures using single questions, multiple questions, and measures that adjust for reluctance to express prejudice are all highly correlated [Herek and McLemore (Reference Herek and McLemore2013)]. We are therefore confident that the GSS question accurately captures tolerance.
The GSS is implemented in even-numbered years. We use the waves from 2004 through 2016. Each wave of the GSS collects data covering the prior calendar year. Even though the GSS is a nationally representative survey, we are confident that state-level estimates are useful. State-level characteristics in the GSS (e.g., average educational attainment and racial composition of the state) are highly correlated with characteristics based on the ACS [Boertien and Bernardi (Reference Boertien and Bernardi2019)].
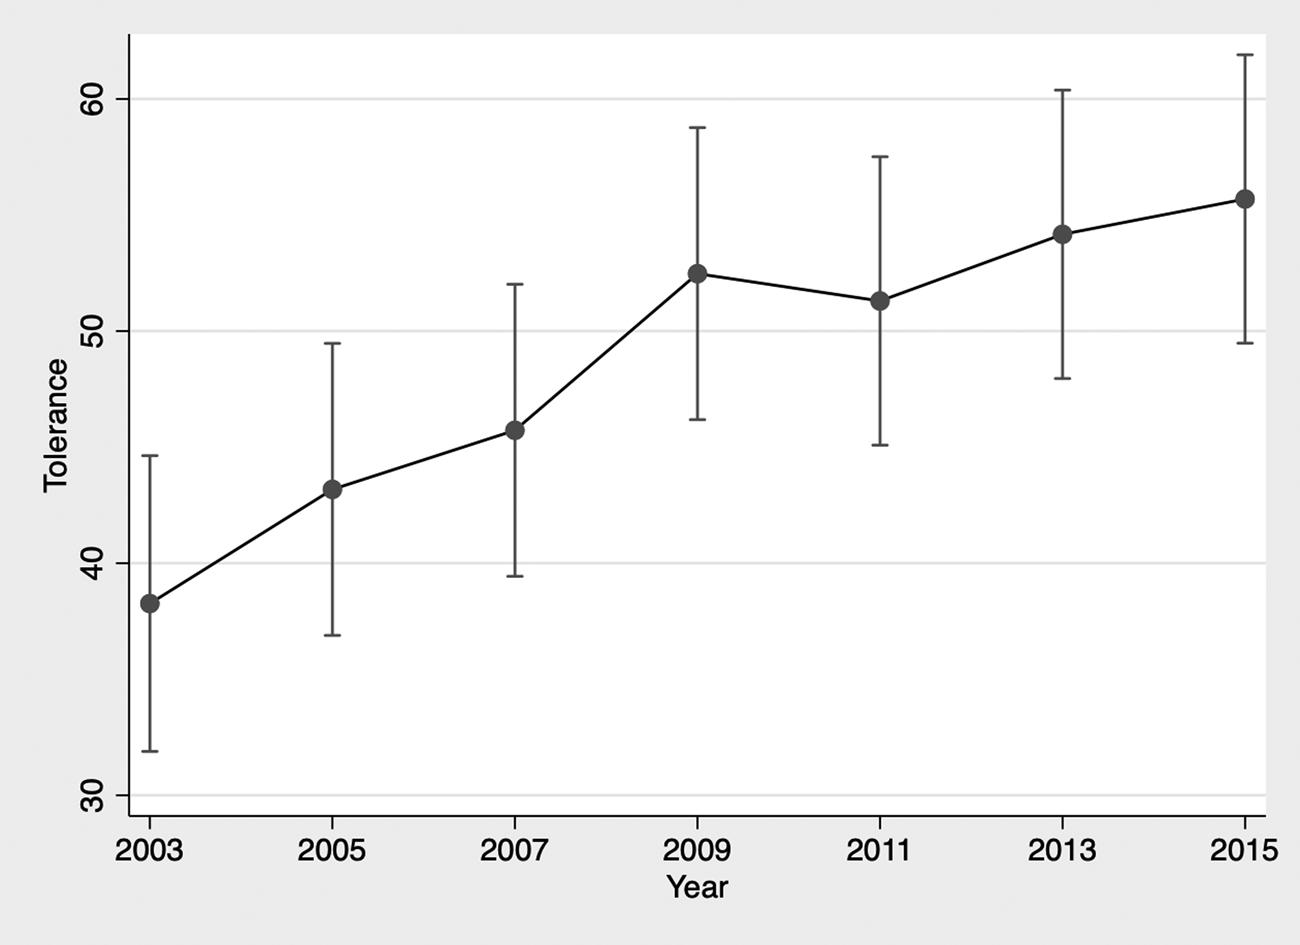
Figure 1 shows that tolerance of homosexuality increased substantially from 2003 to 2015. The share of the population that is tolerant rose from about 38% in 2003 to about 56% in 2015. Across states, the share that is tolerant ranges from 20% to 80%. The variability across states is relatively constant throughout the sample.
Tolerance is increasing across the United States. Source: General Social Survey, 2004–2016. Notes: Vertical bars show 95% confidence intervals of state-level tolerance.

3.2. Labor supply and controls
We merge tolerance for each state-year with data on individuals from the American Community Survey (ACS) from 2003 to 2015 (Ruggles et al. 2018). We use odd years as they align with the reference period of the GSS. The ACS is an annual survey that comprises a random, nationally representative 1% sample of the United States. We focus on the prime-age working population; we limit our main estimation sample to respondents between the ages of 25 and 54.
We are able to classify respondents as gay or lesbian only through personal relationships. If a respondent cohabits with a member of the same sex, we classify the respondent as gay or lesbian.Footnote 4 The analysis therefore excludes unpartnered individuals, as does all work on gay men and lesbian women that uses data from the United States Census Bureau. The main estimation sample includes 23,700 cohabiting gay men, 2,207,977 heterosexual men, 22,394 cohabiting lesbians, and 2,163,907 heterosexual women. Because the sample of cohabiting gay men and lesbian women is small, erroneous coding of heterosexual individuals as gay or lesbian could create bias. We follow standard practice and exclude respondents whose sex or relationship status (including marriage) was allocated by survey administrators [Gates and Steinberger (Reference Gates and Steinberger2015)]. Unfortunately, by following standard practice, we also exclude married same-sex couples for years before 2012 when the ACS began including information that allows their identification. Results are robust whether we include or exclude observations with allocated responses.
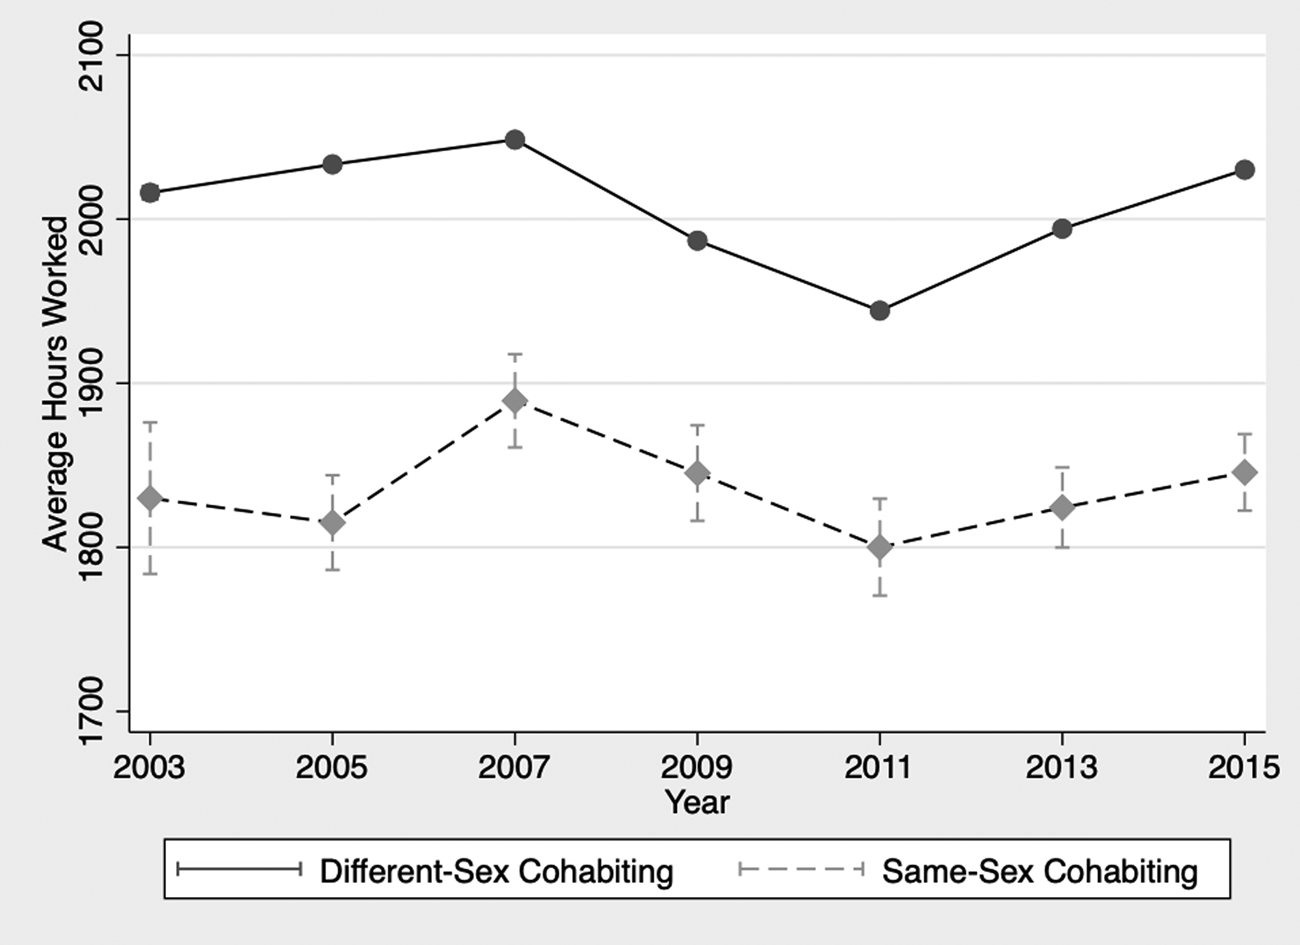
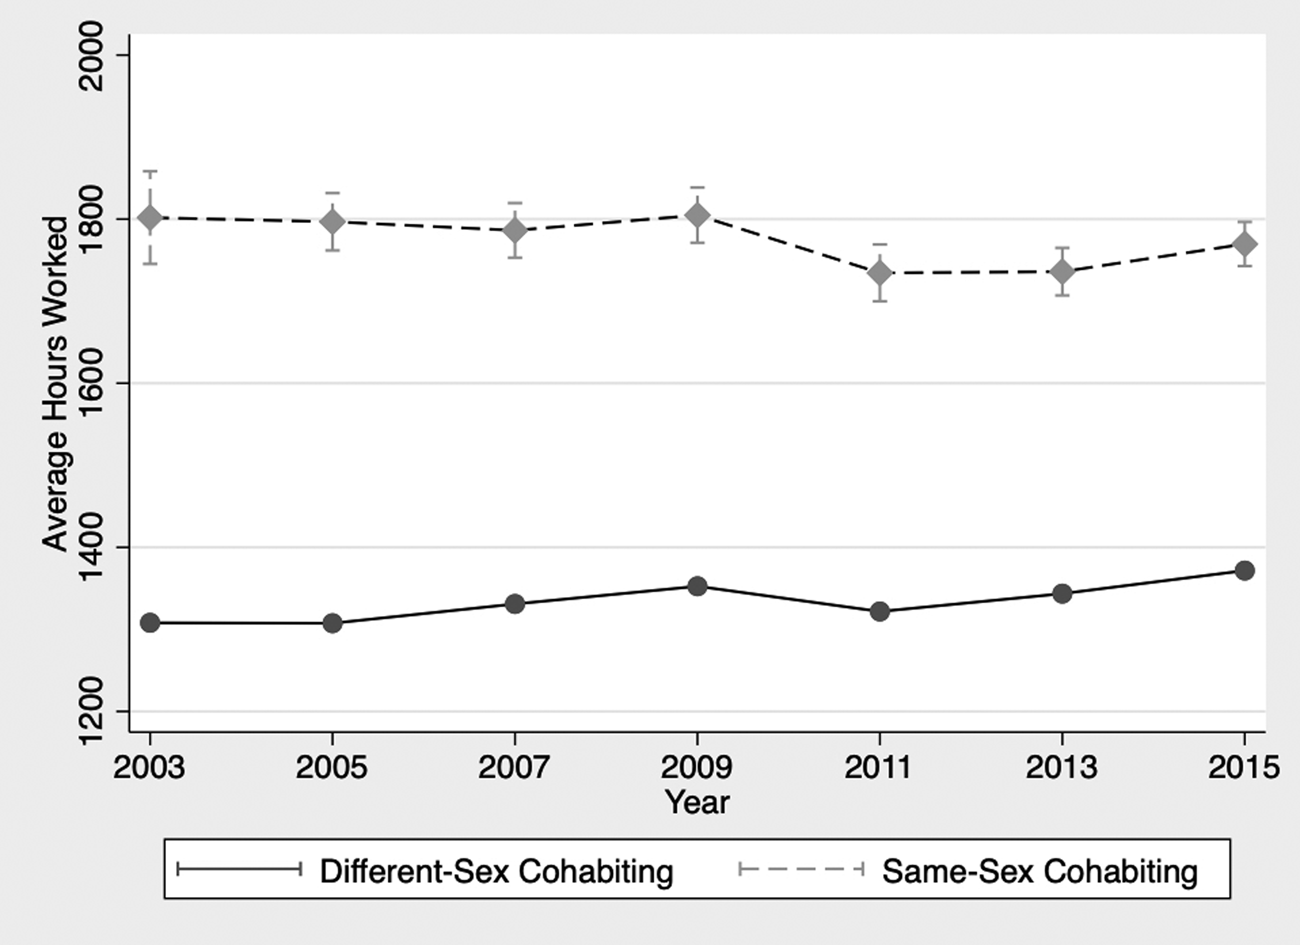
Figure 2 shows that cohabiting gay men work nearly 200 h less per year than heterosexual men on average. In contrast, Figure 3 shows that cohabiting lesbian women work over 400 more hours per year than heterosexual women on average. Annual hours of paid work is calculated as usual hours worked in a week multiplied by the number of weeks worked last year. After 2008, weeks worked is recorded in intervals; we use the midpoint of the interval. Although usual hours per week is more precise than annual hours, we use annual hours to easily compare results of research on the association between ENDAs and marriage equality on labor supply [Martell (Reference Martell2014), Hansen et al. (Reference Hansen, Martell and Roncolato2020)]. Furthermore, annual hours is the most inclusive measure of work. It captures changes in labor force participation, changes in full-time vs. part-time work, as well as smaller changes in hours at work. In the robustness checks below, we show that the pattern of results is similar when we replace our measure of labor supply with the more accurate, though less informative, usual weekly hours.
Gay men work fewer hours than heterosexual men. Source: Authors’ calculations from American Community Survey, 2003–2015, and General Social Survey, 2004–2016. Notes: Vertical bars show 95% confidence intervals.

Lesbian women work more hours than heterosexual women. Source: Authors’ calculations from American Community Survey, 2003–2015, and General Social Survey, 2004–2016. Notes: Vertical bars show 95% confidence intervals.

The consistency of the results suggests any bias is small. The difference in hours worked per year between cohabiting gay and heterosexual men was relatively constant over the study period. For women, the difference in hours worked per year was constant from 2003 to 2007, but it has gotten smaller since 2009. Since 2009, average hours of work decreased for cohabiting lesbian women but remained relatively constant for cohabiting heterosexual women. Because we exclude individuals whose sex or relationship status was allocated, this decrease likely reflects a change in behavior and not a change in the ACS itself [Gates and Steinberger (Reference Gates and Steinberger2015)].
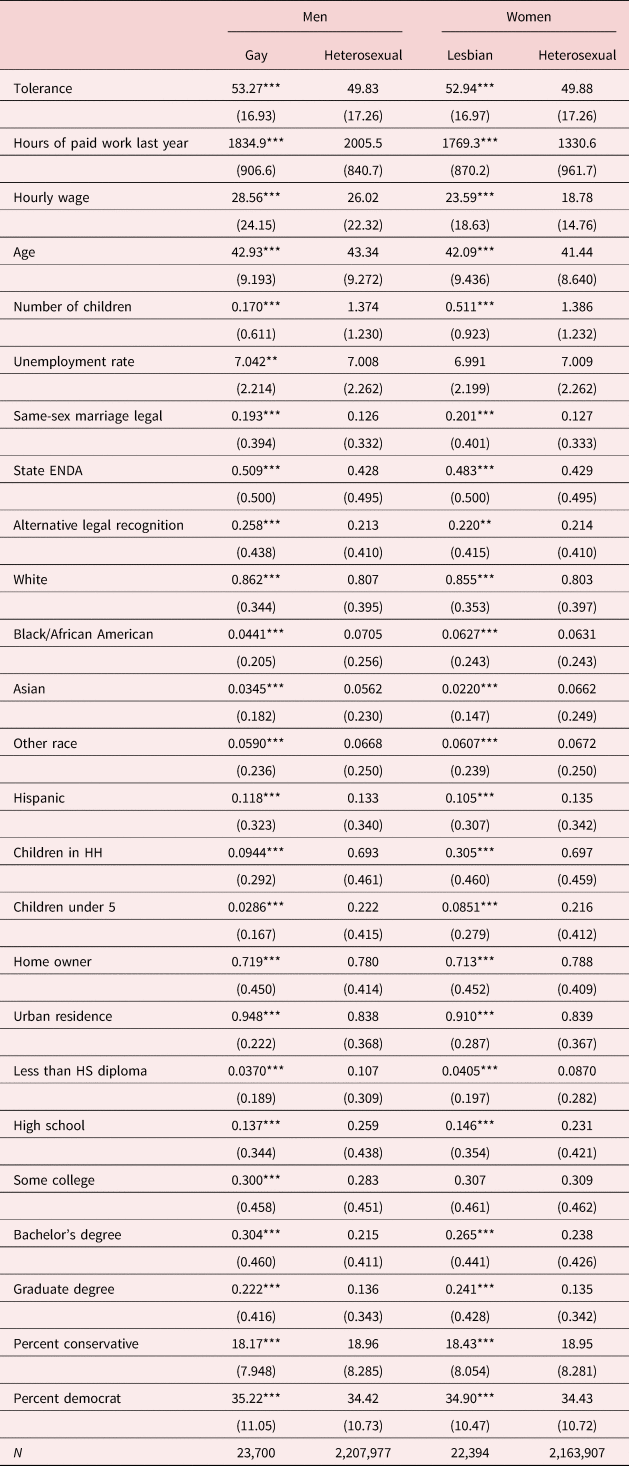
Additional descriptive statistics for the main estimation sample appear in Table 1 and are consistent with existing research on sexual orientation [Black et al. (Reference Black, Sanders and Taylor2007), Antecol et al. (Reference Antecol, Jong and Steinberger2008), Martell and Roncolato (Reference Martell and Roncolato2016), Del Rio and Alonso-Villar (Reference Del Rio and Alonso-Villar2019), Hansen et al. (Reference Hansen, Martell and Roncolato2020)]. Gay men are more likely to live in an urban area, have more education, and have fewer children than their heterosexual counterparts. Gay men are more likely to live in states with higher levels of tolerance, states with legalized same-sex marriage, and states with employment non-discrimination acts that include sexual orientation. Their hourly wages are approximately $2.00 higher than those of heterosexual men, and they have higher non-labor income.Footnote 5
Descriptive statistics

Source: Authors’ calculations from American Community Survey, 2003–2015, and General Social Survey, 2004–2016.
Notes: Mean values with standard deviations in parentheses. Difference relative to heterosexual counterparts: *Significant at 10%, **significant at 5%, ***significant at 1%.
In most ways, the differences between cohabiting lesbian and heterosexual women mirror the differences between cohabiting gay and heterosexual men. The exception is wages. Averaging over the entire study period, cohabiting lesbians have hourly wages that are approximately $4.00 higher than heterosexual women.
4. Empirical specification
To capture a relationship between tolerance of homosexuality and labor supply, we exploit the considerable variation in tolerance across states and years. Because annual hours of paid work are truncated at zero, we use a tobit model for our primary results. We estimate annual hours of work, y ist, for individual i living in state s in year t:

The indicator S ist takes a value of one if the respondent is a cohabiting gay man or a lesbian woman. T st is tolerance of homosexuality in the respondent's state and year. Our coefficient of interest, β3, multiplies the interaction between S ist and T st. Because we measure tolerance at the state level, we cluster standard errors at the state level.
We control for the individual characteristics, X ist, that are typical in studies of the labor market outcomes of gay men and lesbian women [Antecol et al. (Reference Antecol, Jong and Steinberger2008), Giddings et al. (Reference Giddings, Nunley, Schneebaum and Zietz2014), Jepsen and Jepsen (Reference Jepsen and Jepsen2015)]. Controls include age and its square, the number of children in the household, and indicators for the following: the presence of a child under the age of five, race (Black, Asian, other), ethnicity (Hispanic), home ownership, urban residence, and educational attainment (high school diploma, some college, bachelor's degree, graduate degree).
We also include a vector of controls, R st, that is specific to the state and year. To account for heterogeneity in labor market conditions, the vector includes the state unemployment rate. To account for heterogeneity in the legal environment, it includes an indicator that equals one if the state has legal same-sex marriage, an indicator that equals one if the state has alternative legal recognition of same-sex relationships (civil unions or domestic partnerships), and an indicator that equals one if the state has a non-discrimination act that includes sexual orientation. To account for remaining heterogeneity in the political and cultural environment, it includes the percent of the population that identifies as conservative (socially) and the percent that identifies as Democratic (politically). Finally, we include state effects, ωs, and year effects, νt.
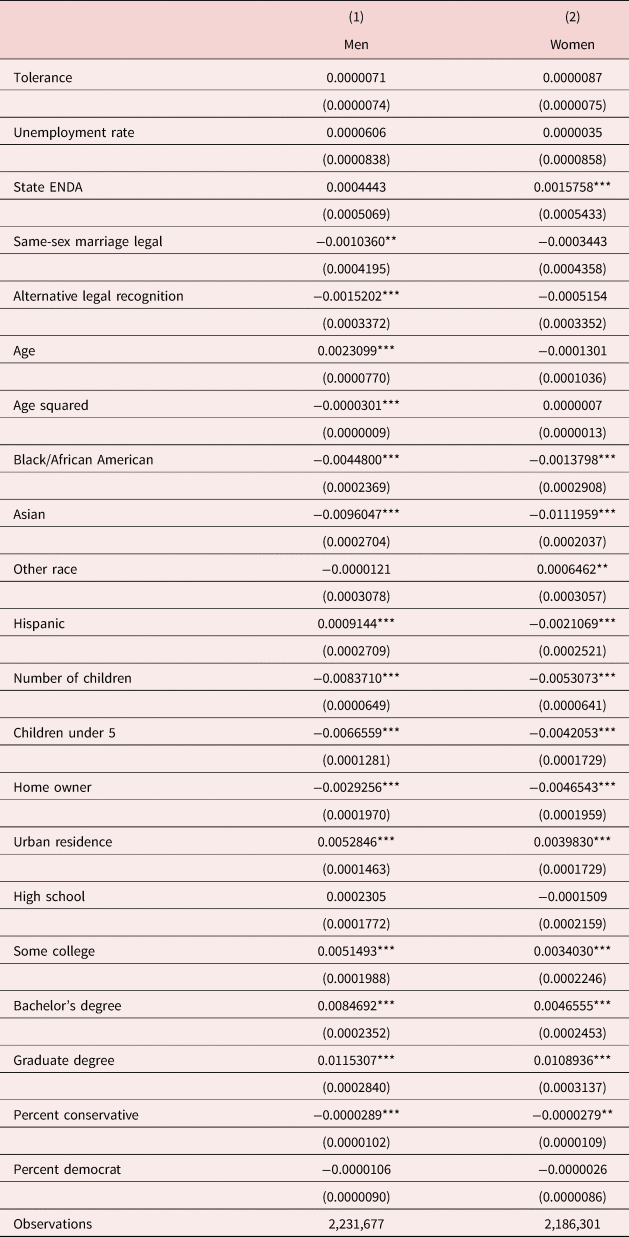
Our empirical specification captures the causal impact of tolerance on labor supply only if two assumptions hold. The first assumption relates to unobserved state-year heterogeneity. Because the specification may omit laws or labor market fluctuations that indirectly and disproportionately affect same-sex couples, the results can be interpreted as causal only if unobserved laws and labor market fluctuations are not correlated with tolerance and uncorrelated with the set of controls in R st. The second assumption relates to the relationship between tolerance and the composition of a state's population of same-sex couples. Identification requires that an increase in tolerance does not lead to a change in the composition of same-sex couples that coincidentally drives the patterns in labor supply that we observe. Such a compositional change could arise in two ways. Tolerance may increase couple formation at the margin, or it could induce migration of same-sex couples seeking more friendly environments, leading to a larger same-sex couple population. We find no evidence of such compositional changes in the data. Linear probability models of the likelihood of being a member of a same-sex couple, conditional on the controls described in equation (1), yield a near-zero and statistically insignificant coefficients on tolerance (see Table A1).Footnote 6 Additionally, removing recent movers (discussed below) does not materially affect the results.
5. Results
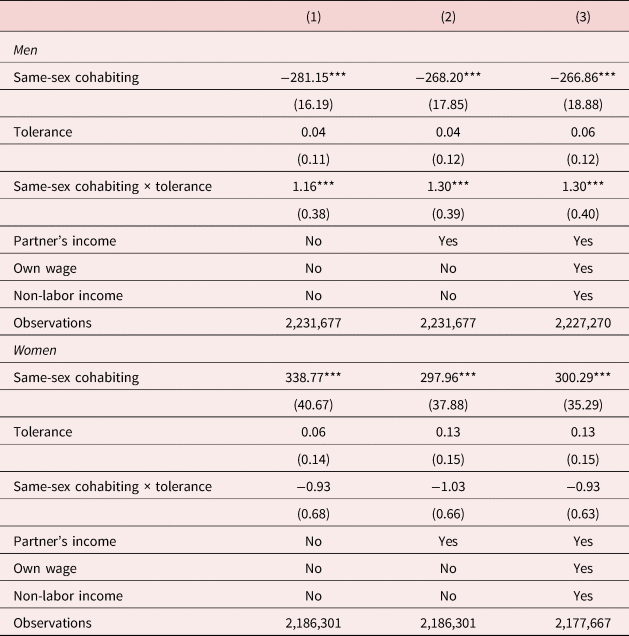
Table 2 presents the coefficients of interest. Results for men are in the top panel; results for women are in the bottom panel. The first column shows that more tolerance is associated with more hours of work per year for cohabiting gay men relative to heterosexual men. Where the share of the population that is tolerant is 1 percentage point higher, cohabiting gay men work about 1.16 h more per year than their heterosexual counterparts.Footnote 7 Among cohabiting women, the point estimate of the coefficient of interest is also about one, but it has the opposite sign, and it is not statistically significant at conventional levels.
Relationship between tolerance and annual hours worked: main results

Source: Authors’ calculations from American Community Survey, 2003–2015, and General Social Survey, 2004–2016.
Notes: *Significant at 10%, **significant at 5%, ***significant at 1%.
Although, as mentioned above, a difference in annual hours can represent a difference in usual hours of work, a difference in the probability of working, or a combination of the two, here the relationship between tolerance and the probability of working is near zero. (See the discussion of Table 4 below.)
The results suggest that, in times and places with greater tolerance of homosexuality, patterns at the intensive margin of labor supply within same-sex couples are more similar to the patterns of their heterosexual counterparts. Because cohabiting gay men work more than heterosexual men while cohabiting lesbian women work more than heterosexual women, convergence involves opposing responses for men and women. The asymmetric responses are consistent with a change in the social environment that provides sexual minorities with wages, job security, and social supports that are all more similar to the opportunities enjoyed by heterosexual couples.
In the second column, we add a control for partner's income. Of course, partner's income shifts one's own budget constraint, but it is likely to be endogenous. In any case, its inclusion does not meaningfully change the size of the coefficient of interest. In the third column, we add controls for own hourly wage and non-labor income to capture income and substitution effects of the canonical labor supply model. Results are again similar. Because the inclusion of wage and income controls does not meaningfully affect our estimates, the specifications below exclude these potentially endogenous variables.Footnote 8
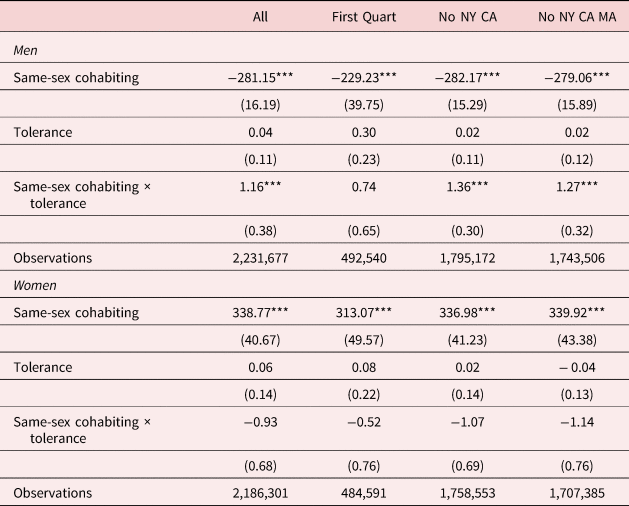
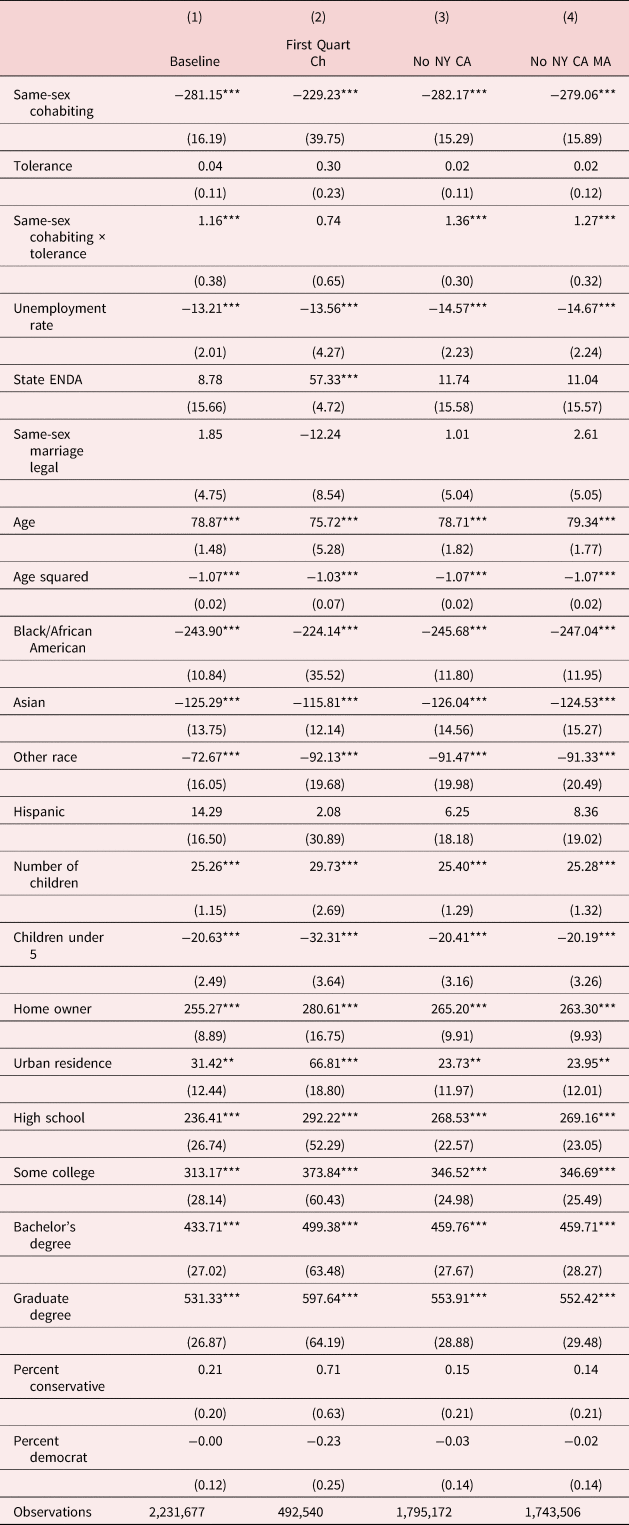
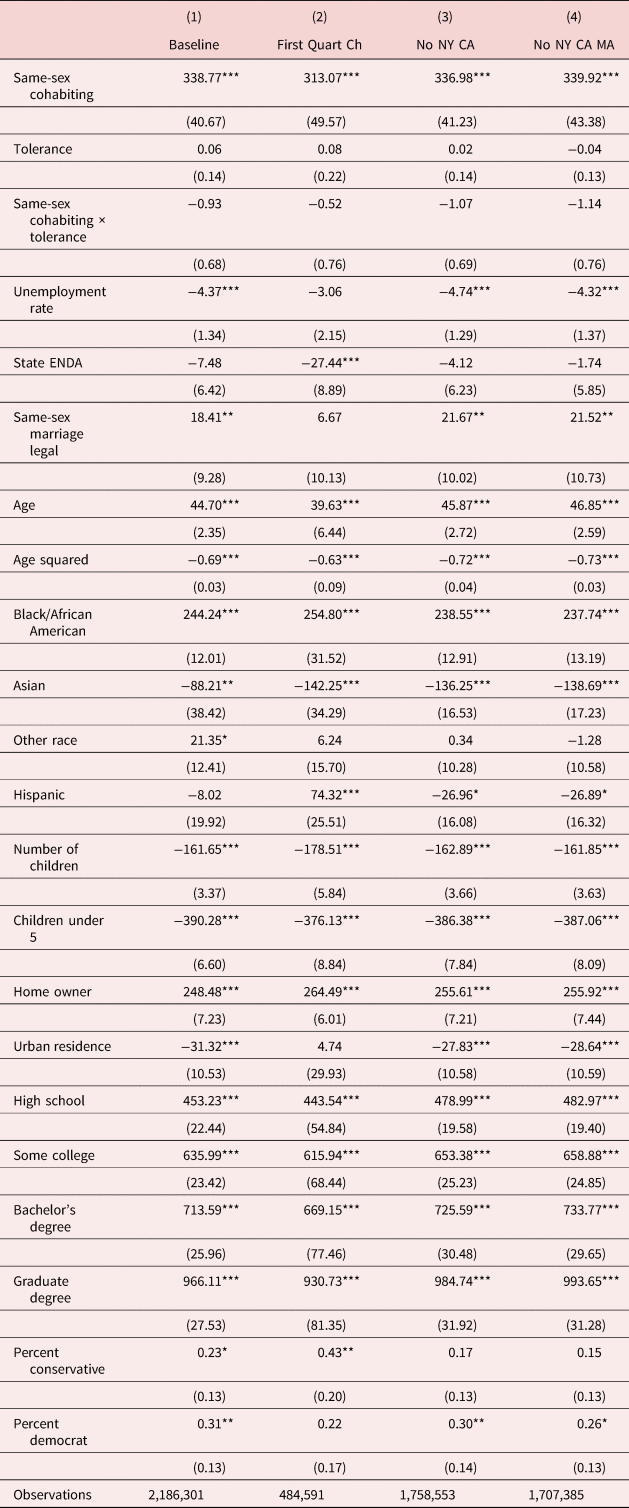
In Table 3, we show that the relationship between tolerance and labor supply is not driven by outcomes in any subset of influential states. In the first column, we repeat the first column from Table 2 for convenience. It includes respondents in all states. The second through fourth columns show results for different groups of states. In the second column, we include only respondents in states with the largest increases in tolerance. The top quartile includes Connecticut, Kentucky, Massachusetts, Michigan, New Jersey, Pennsylvania, Virginia, Washington, and West Virginia. The coefficients of interest are smaller in size than those in the first column. Because subsetting the states reduces the number of sexual minorities included, the coefficient is not statistically significant for men or for women. In the third column, we exclude respondents from the states with the most cohabiting gay men and lesbian women: New York and California. In the fourth column, we additionally exclude respondents from Massachusetts, a persistent tolerant state and an early adopter of legalized same-sex marriage. Exclusion of influential states increases the point estimate but does not materially change results. (Full results for specifications in Table 3 appear in Appendix Tables A2 and A3. The signs and significance of control variables and diagnostic statistics are as expected.)
Relationship not driven by influential States

Source: Authors’ calculations from American Community Survey, 2003–2015, and General Social Survey, 2004–2016. Column 1 includes respondents in all states. Column 2 includes only respondents in states with the largest increases in tolerance (Connecticut, Kentucky, Massachusetts, Michigan, New Jersey, Pennsylvania, Virginia, Washington, and West Virginia). Column 3 excludes New York and California; column 4 also excludes Massachusetts.
Notes: *Significant at 10%, **significant at 5%, ***significant at 1%.
5.1. Robustness
A series of robustness checks corroborate the main findings.
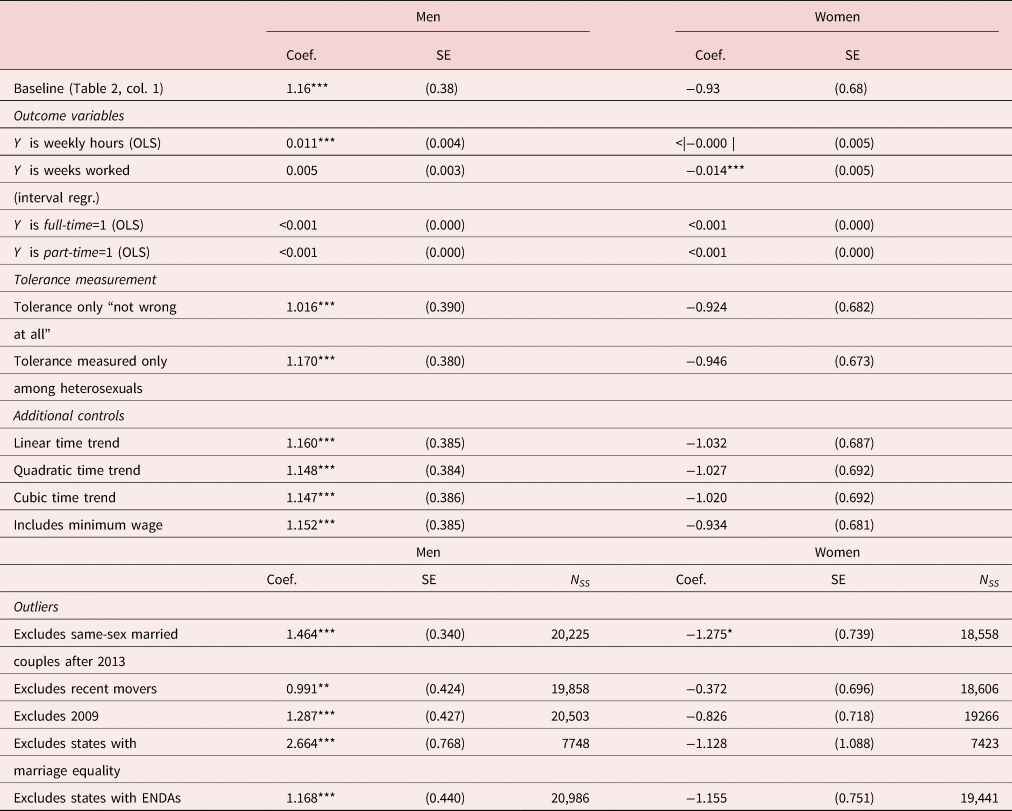
We begin with checks that address questions of measurement and specification. Our preferred specification (in the first column of Table 2) measures labor supply as annual hours of work. The first three rows of Table 4 show that we find a similar pattern whether we measure labor supply as usual weekly hours worked [estimated via ordinary least squares (OLS)], weeks worked per year (estimated via interval regression), or when we estimate annual labor supply using OLS and restricting to respondents with non-zero work hours. These robustness checks reveal a subtle difference in patterns for men and women. For cohabiting gay men, tolerance is associated with more usual weekly hours of paid work, but it is not associated with weeks worked. For cohabiting lesbian women, tolerance is associated with fewer weeks worked, but is not associated with weekly hours.
Summary of robustness tests

Source: Coefficient on interaction term (Same-sex household x tolerance), standard errors and sample size of same-sex cohabitants based on authors’ calculations from American Community Survey, 2003–2015, and General Social Survey, 2004–2016. Notes: *Significant at 10%, **significant at 5%, ***significant at 1%. Full results available from the authors.
The differences described in previous paragraph suggest that tolerance may be associated with the labor supply of cohabiting lesbian women through a channel related to occupation. However, there is no relationship between tolerance and occupation. (Results available upon request.) We separately considered occupational categories (management, service, etc.) and characteristics (percent occupation female and work styles such as independence). Moreover, the magnitude of the relationship between tolerance and labor supply did not vary across occupations with varying degrees of interpersonal contact (measured as task independence [Tilcsik et al. (Reference Tilcsik, Anteby and Knight2015), Martell (Reference Martell2018)] which reflect the likelihood of sexual orientation disclosure. Because tolerance in a state could affect the distribution of occupations within a state, further research on this margin is warranted.
The fourth and fifth rows of Table 4 show that tolerance is not associated with the probability of working part-time or full-time. Therefore, our main results reflect changes in labor supply at the intensive margin of work (again, more hours of work per week for men and fewer weeks of work for women).
The results are not sensitive to the definition of “tolerant.” Recall that in our main results we categorize respondents as “tolerant” if they respond that sexual relations among adults of the same sex are “not wrong at all” or “wrong only sometimes.” The sixth row of Table 4 shows results if we instead classify respondents to the GSS as tolerant only if they report that sexual relations among adults of the same sex are “not wrong at all.” The seventh row shows results if we calculate our original measure of tolerance using only the subsample of heterosexual individuals in the GSS. The results are qualitatively similar to the main result in the first column of Table 2. They are also unchanged by restricting the estimation sample to state-years in which tolerance is estimated based on at least 10 observations in the GSS (not shown).
Another potential concern is our treatment of time. Our preferred specification includes year effects. Changes in tolerance were largest just before the Great Recession and smallest in the years just after it (see Figure 1). Rows 8 through 10 of the third panel of Table 4 show that the primary pattern of results is robust to the inclusion of linear, squared, and cubic state-specific time trends. The coefficient of interest is not driven by extreme values.
The last row of the top panel shows that adding a control for the level of the state minimum wage, which may also affect labor supply, does not affect the result.
The bottom panel of Table 4 shows checks that address sensitivity to the inclusion or exclusion of problematic or outlier observations, unusual years, or unusual states. Because these robustness checks substantially reduce the already-small number of same-sex couples included, we report the size of the subsamples of gay men and lesbian women in this panel.
We begin with potentially problematic observations. Recall that the United States Census Bureau allocates some responses and that we exclude all observations with allocated responses from the main estimation sample. Our main estimation sample therefore includes married same-sex couples after 2013, but not before. In the first row of the bottom panel, we exclude married same-sex couples after 2013. This restriction also addresses a redesign of ACS in 2008 that decreased the likelihood of contamination of the same-sex couple sample. The exclusion increases the size of the coefficient of interest for both men and women, and it increases its statistical significance for women.
The second row of the bottom panel explicitly considers one of the threats to identification discussed above. It is possible that greater tolerance leads to migration-induced compositional changes that affect labor supply. Excluding ACS responses who moved in the previous year (domestically or internationally) does reduce the size of the coefficient of interest, but not substantially. It is still, essentially, equal to one.
The results are also robust to changes that expand, rather than restrict, the estimation sample. For example, including respondents up to age 64 does not change the result (available upon request).
Including the year 2009 may be problematic. In that year, tolerance had a local peak, perhaps reflecting progressive enthusiasm of the first year of President Obama's administration. The second row of the bottom panel shows that excluding the 2009 ACS does not materially affect results.
Including states with progressive legal environments may also be problematic. When we exclude states that had marriage equality before it was legalized federally via the Supreme Court's Obergefell decision in 2014, the size of coefficient of interest for cohabiting gay men nearly doubles. Recall from the discussion of Table 3 that excluding New York, California, and Massachusetts also increased the point estimate, but the coefficient was smaller when we examined only the states with the largest gains in tolerance. The conflicting results point to the need for more research on the complex relationship between law, tolerance, and work.
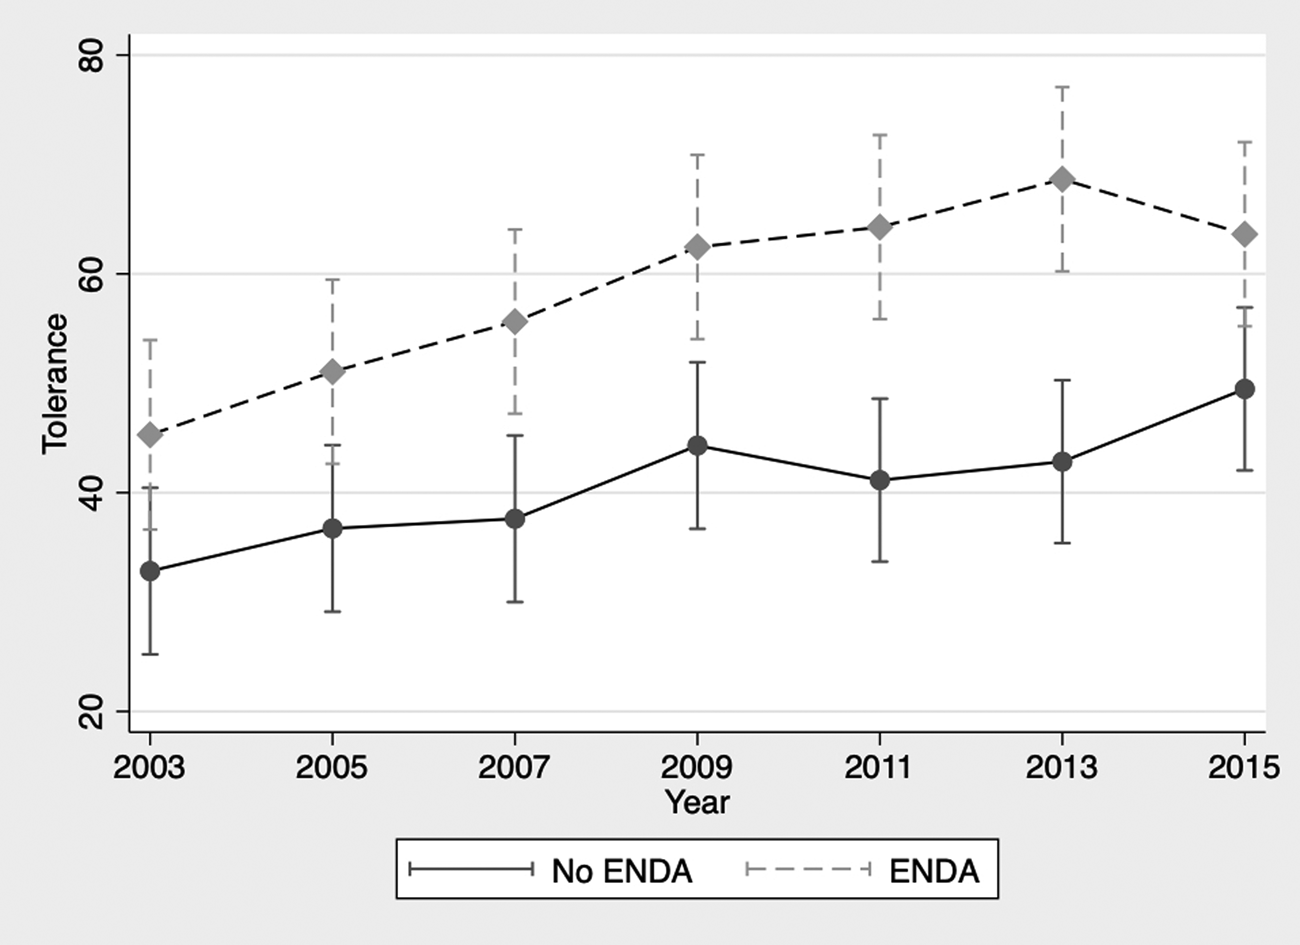
The final row of Table 4 shows that excluding states that implemented ENDAs before or during the sample period has no material effect on the size of the coefficient. This suggests that the main results do not reflect the direct or indirect influence of ENDAs on labor market outcomes themselves, and it further highlights the complexity of the determinants of tolerance. Furthermore, ENDAs exist in states with higher levels of—and different changes in—tolerance (see Figure 4). It seems that controlling for ENDAs, as is typically done in research on labor market outcomes in the United States, masks important variation in tolerance that we can observe. We also estimate specifications that allow the influence of equal rights laws to vary by sexual orientation (not shown). When we include an additional interaction between the indicator variables for gay/lesbian and legalized same-sex marriage or the presence of state ENDAs which are qualitatively similar for men, the relationship between tolerance and the labor supply of lesbians is attenuated.
Tolerance over Time in States with and without ENDAs. Source: Authors’ calculations from American Community Survey, 2003–2015, and General Social Survey, 2004–2016. Notes: Vertical bars show 95% confidence intervals.

5.2. Heterogeneous response
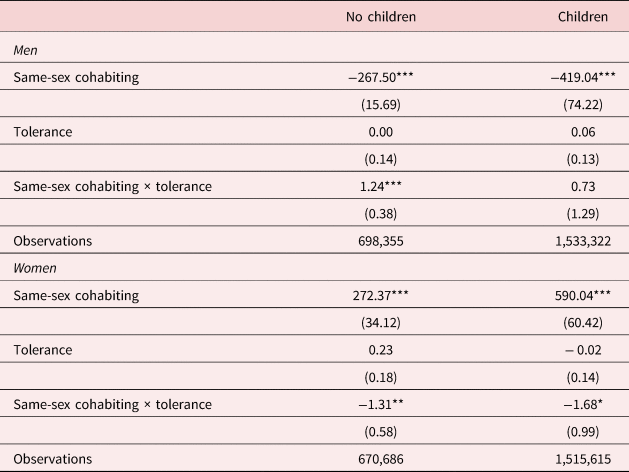
As noted in the section on the conceptual framework, one way that greater tolerance may influence labor supply is that greater support from more tolerant family and community may enable same-sex households to adopt patterns of household specialization that are more similar to different-sex households. Because children play a central role in determining the extent of household specialization [Giddings et al. (Reference Giddings, Nunley, Schneebaum and Zietz2014)], we explore this channel by partitioning the sample into household with and without children under 18. Even though the differences in the point estimates are large, the sample size of these partitions means the confidence intervals overlap.
In Table 5, results for men are again in the top panel, and results for women are in the bottom panel. For cohabiting men with no children, results mirror the main result in the first column of Table 2. Among cohabiting men with children, the point estimate of the coefficient of interest is also positive, but it is smaller and statistically insignificant. This is, perhaps, because the subsample of cohabiting gay men with children is small.
Relationship between tolerance and annual hours worked by parenthood status

Source: Authors’ calculations from American Community Survey, 2003–2015, and General Social Survey, 2004–2016. Notes: *Significant at 10%, **significant at 5%, ***significant at 1%.
For women, partitioning the sample amplifies the results in Table 2 and in some rows of Table 4. Among cohabiting women with no children in their households, greater tolerance is associated with fewer hours in paid work each year relative to their heterosexual counterparts. The coefficient of interest is larger when we estimate it using the subsample of cohabiting women with children.
Recall from the descriptive statistics (Table 1), that, on average, cohabiting lesbian women work 400 h more per year than cohabiting heterosexual women. In the average state, the increase in tolerance over this period is associated with cohabiting lesbian women without children reducing their work hours so that they “only” work about 360 h more than similar heterosexual women. In intolerant environments, the point estimate of the base difference in work hours between cohabiting lesbian women with children and heterosexual women with children is larger than that for cohabiting women without children. However, growing tolerance is associated with more convergence with their heterosexual peers.
Robustness checks on the partitioned sample are not informative; the subsamples are too small. Like the large literature that has been unable to fully explain why there is a gay wage penalty at the same time that there is a lesbian wage premium [Klawitter (Reference Klawitter2015)], and like the newer literature that is unable to fully explain within-household differences between cohabiting gay men and lesbian women [Giddings et al. (Reference Giddings, Nunley, Schneebaum and Zietz2014)], we cannot fully explain the associations that we document here. More research is needed, and we leave a full investigation of the dynamics of tolerance and household division of labor for future research.
Nonetheless, the results in this section reinforce the bottom line of the paper overall: in more tolerant settings, cohabiting sexual minorities make choices that are more similar to the choices their heterosexual peers make.
6. Discussion and conclusion
While much research investigates the associations between formal institutions such as relationship recognition [Dillender (Reference Dillender2015)] and anti-discrimination laws [Klawitter (Reference Klawitter2011), Martell (Reference Martell2013b, Reference Martell2014)] on the economic lives of gay men and lesbian women, little research explores informal institutions, or social norms, such as intolerance of homosexuality. We show that there is a meaningful relationship between the erosion of intolerance and changes in the amount of time cohabiting gay and lesbian workers spend at work relative to their heterosexual counterparts.
Consistent with the bulk of the literature on the earnings effects of sexual orientation, the relationship between tolerance of homosexuality and paid labor supply is asymmetric by gender and parental status. The measured correlation is the net result of three likely mechanisms. The mechanisms are not mutually exclusive and may affect men and women differently.
The results have two important implications. First, the gate to equality is open, but the road is not yet paved. Tolerance is related to more similar choices about hours at work, but large differences in labor supply by sexual orientation still exist. The results suggest that one reason differences continue to exist is that there remains a substantial gap between the most tolerant and least tolerant places. Second, our results imply that policies and programs that increase tolerance of homosexuality may be important levers in promoting equality. Advocates interested in promoting equality should expand their focus. In addition to ongoing efforts to change the law, they should promote efforts to change attitudes. Such efforts could include anti-bullying and inclusive curriculum initiatives [Byard et al. (Reference Byard, Kosciw and Bartkiewicz2013)].
Finally, the results point to the importance of building a research agenda to better understand the determinants and impact of tolerance. Such an agenda should include investigating the relationship between tolerance and work satisfaction among sexual minorities, which could be accomplished with more regular administration of the job quality module of the GSS. The research agenda should also address the association between tolerance on relationship stability, relationship formation, and wages. It should also aim to improve our understanding of the transmission of tolerance among people of all ages.
Acknowledgments
The authors thank Dan Black, Brad Hansen, participants of the 2019 Conference on the Economics of Sexual Orientation at Linnaeus University, the 2021 American Economic Association Annual Meetings, the AEA CSQIEP Economics of LGBTQ+ Individuals Virtual Seminar Series, the editor, and three anonymous reviewers for useful feedback and suggestions. They also thank Ben Gregson for careful copyediting.
Conflict of interest
The authors declare none.
Appendix A
No relationship between tolerance and probability of being in a same-sex Couple

Relationship between tolerance and hours worked among gay men, full results

Relationship between tolerance and hours worked among lesbian women, full results