I
The Central Bank, which possesses a monopoly over monetary base creation, controls trend inflation. (Hetzel Reference Hetzel2008, p. xiii)
December 2013 marked the centenary of the creation of the US Federal Reserve System.Footnote 1 This centenary has sparked an interesting debate on the performance of the Fed (Bernanke Reference Bernanke2013; Romer and Romer Reference Romer and Romer2013). Bernanke (Reference Bernanke2013) highlights that the objective of the Great Experiment that led to the founding of the Fed was to maintain financial stability (Bernanke Reference Bernanke2013). Indeed, the Fed was created in response to the financial panic of 1907. Although the goals of the Fed changed several times during its 100-year history, economists disagree on whether the Fed has been successful in achieving its original goals. Friedman (Reference Friedman1988) has been very critical of the Fed's performance: ‘No major institution in the US has so poor a record of performance over so long a period, yet so high a public reputation’ (Friedman Reference Friedman1988, p. 28). It is widely accepted that the Fed failed on several occasions in performing its objectives, most notably during the Great Depression (Romer and Romer Reference Romer and Romer2013). The Fed has been criticised for not fighting inflation in the 1970s (the Great Inflation), due to policy inaction led by the belief that monetary policy cannot reduce inflation without a substantial cost (Romer and Romer Reference Romer and Romer2013). The Fed has also come under severe criticism in the latest recession (Great Recession) of 2007–9 (Meltzer Reference Meltzer2012).
Initially, the Fed's objectives, stipulated in the original Federal Reserve Act of 1913, were to supply an elastic currency in order to prevent bank panics, a common phenomenon of the nineteenth and early twentieth centuries. In 1977, Congress amended the Federal Reserve Act, stating the monetary policy objectives of the Federal Reserve as follows: ‘The Board of Governors of the Federal Reserve System and the Federal Open Market Committee shall maintain long run growth of the monetary and credit aggregates commensurate with the economy's long run potential to increase production, so as to promote effectively the goals of maximum employment, stable prices and moderate long-term interest rates.’Footnote 2 Although the Act highlighted three policy goals, the Fed focuses primarily on employment and prices. Moreover, on 25 January 2012 the FOMC released a statement clarifying its long-run goals and its strategy in attaining these goals. Regarding its inflation goal, the Committee states:
The inflation rate over the longer run is primarily determined by monetary policy, and hence the Committee has the ability to specify a longer-run goal for inflation. The Committee judges that inflation at the rate of 2 percent, as measured by the annual change in the price index for personal consumption expenditures, is most consistent over the longer run with the Federal Reserve's statutory mandate. Communicating this inflation goal clearly to the public helps keep longer-term inflation expectations firmly anchored, thereby fostering price stability and moderate long-term interest rates and enhancing the Committee's ability to promote maximum employment in the face of significant economic disturbances.
Given the widespread belief exemplified in Milton Friedman's dictum that inflation is always and everywhere a monetary phenomenon, and our article's opening quote from Hetzel (Reference Hetzel2008), we assess whether the Fed years have been associated with a reduced average rate of inflation and inflation uncertainty.
We examine the relationship between inflation and inflation uncertainty using a long series of US inflation data that spans over two centuries. Macroeconomic theory predicts a bidirectional causal relationship between inflation and inflation uncertainty. Friedman (Reference Friedman1977) argues that in inflationary times there is uncertainty among the public regarding the likely response of the monetary authority, thus leading to inflation uncertainty. Hence, inflation has a positive effect on inflation uncertainty. The sign of the impact of inflation uncertainty on inflation, though, is ambiguous from a theoretical point of view. It depends on the reaction of the central bank to an increase in inflation uncertainty. The central bank may react opportunistically, creating an inflation surprise to reap output gains (Cukierman and Meltzer Reference Cukierman and Meltzer1986). Alternatively, the central bank may act in a stabilising manner reducing inflation in order to offset the increase in inflation uncertainty and prevent the associated real costs. This stabilisation motive has been put forward by Holland (Reference Holland1995) on the basis of his US evidence that higher inflation uncertainty causes a lower inflation rate. In particular, Holland has highlighted that ‘one possible reason for greater inflation uncertainty to precede lower inflation is that an increase in uncertainty is viewed by policymakers as costly, inducing them to reduce inflation in the future’ (Holland Reference Holland1995, p. 832).Footnote 3 The lack of a consensus on the effect of inflation uncertainty on inflation highlights the need for a further empirical examination of this issue.
The empirical literature on the inflation–inflation uncertainty nexus has multiplied tremendously over the last two decades.Footnote 4 Indeed, Hamilton (Reference Hamilton2008) highlights the importance of GARCH modelling in macroeconomic applications that relate mostly to inflation uncertainty, output growth uncertainty, inflation and growth. The majority of this literature has examined the link between the two variables (inflation and inflation uncertainty), abstracting from the consideration of regime changes in inflation and/or inflation uncertainty (Grier and Perry Reference Grier and Perry1998; Bredin and Fountas Reference Bredin and Fountas2009). In general, there is no consensus arising from this vast literature, in particular on the Cukierman–Meltzer hypothesis.
Our study not only complements this inflation–inflation uncertainty literature, but it also adds to the literature regarding Fed performance, although focusing on much narrower inflation–inflation uncertainty criteria, compared to the previous studies. There is a considerable literature on Fed performance addressing inflation, growth and unemployment (Romer Reference Romer1986; Miron and Romer Reference Miron and Romer1990; Selgin et al. Reference Selgin, Lastrapes and White2012; Hogan Reference Hogan2015). Selgin et al. (Reference Selgin, Lastrapes and White2012) provide a comprehensive analysis of the Fed's historical performance, adopting multiple factors including prices and output. For price stability, average rates and volatility of inflation are examined, and the authors find that inflation was higher under the Fed regime, although it was no less volatile. Prices were less predictable again during the Fed regime, compared to the pre-Fed period. Hogan (Reference Hogan2015) extends the Selgin et al. (Reference Selgin, Lastrapes and White2012) study in a number of avenues, but again finds consistent results with higher average rates of inflation under the Fed period and lower rates of GDP growth.
Our results indicate that the Fed era has been associated with higher average inflation and lower inflation uncertainty. Our empirical analysis indicates that the higher inflation rate observed during the Fed years can be accounted for by the prolonged recessions that were more common following the founding of the Fed (Selgin et al. Reference Selgin, Lastrapes and White2012). Our results are robust to a number of sensitivity tests. Not surprisingly, the results hold even when we omit the recent span of low and stable inflation (post-1980 period). We also find strong evidence that irrespective of our chosen sample, increasing inflation uncertainty is associated with a stabilisation of inflation, in support of the Holland stabilisation hypothesis. The article is outlined as follows. Section ii offers a brief US monetary history during the last two centuries. Section iii describes our data and the econometric methodology. Sections iv and v present the baseline results and some robustness tests allowing for major events. Section vi concludes.
II
The US has a long and interesting monetary history. In order to finance the American Revolution, the first type of paper money (the ‘continentals’) was printed by the Continental Congress. This money was supposed to be redeemable on demand into specie. However, this did not materialise and the excessive quantity of this money led to high inflation. Following the end of the Revolutionary War, debts issued by the states had expanded and each state printed its own currency. The first Constitution of the Unites States banned states from printing their own currency. The First Bank of the United States was founded in 1790 to finance government debt and print a national currency. This bank was modelled after the Bank of England and was designed by Alexander Hamilton, the Treasury secretary. In addition to its standard activities of financing government operations, the bank also provided commercial loans. Following the nonrenewal of its charter in 1811, during the second war with England (1812–14) state banks proliferated and financed the war. Due to excessive bank note circulation, the Second Bank of the United States was established in 1816. The bank closed in 1836 as president Jackson refused to extend its charter. The following year the federal government issued its ‘specie circular’: land agents were required to accept only specie or bank notes convertible into specie when selling public land. The outcome was a financial panic due to a reduction of bank notes and deposits. Banks also suffered from the prohibition of nationwide branching that prevented diversification of loans portfolios.
During the free banking era (1837–63) state-chartered banks proliferated. Many bankers' banks (such as the Suffolk Bank of New England) and bank clearinghouses operated around the country providing a stable monetary environment (Timberlake Reference Timberlake1984; Gorton and Mullineaux Reference Gorton and Mullineaux1987). Following the start of the Civil War and the need for a new national bank to finance the war, the National Banking System was created with the objectives to issue government bonds to finance the war and introduce a uniform currency replacing state bank notes. For the first time under this new banking system a common currency was circulating. However, the National Banking System did not improve upon the state banking system as unit banking was still in effect. The outcome was several bank panics. Five major panics took place between the end of the Civil War and 1913 and were mostly related to autumn harvests. These panics were primarily a US phenomenon due to destabilising financial regulations such as branching restrictions (Selgin Reference Selgin2016). In 1907, the failure of the Knickerbocker Trust Co. in New York City, a member of the New York Clearinghouse association, was followed by a surging demand for liquidity. The Clearinghouse Association allowed the issuance of clearinghouse loan certificates, the precursor to the federal fund market. A serious liquidity crisis emerged with New York correspondent banks unable to meet the huge demand for liquidity. Following the financial panic of 1907, the US Congress appointed a National Monetary Commission with the objective to evaluate alternative monetary policy regimes and a successor to the National Banking System.Footnote 5 In 1913, the Congress passed the Federal Reserve Act that led to the establishment of the Fed. Initially, the Fed's objectives were the provision of an elastic currency and the supervision of the banking sector to prevent bank panics (Wells Reference Wells2004). Following the collapse of the Bretton Woods system in the early 1970s, the objectives of the Fed were transformed in 1977 and included macroeconomic stability that was reflected in maximum employment and stable prices.
During World War I, gold moved from Europe to the US and inflation increased. The Fed was unable to fight inflation due to the absence of an open-market operations policy tool. The US price level doubled between 1915 and 1920. After the end of the war, the Fed applied contractionary monetary policy and the outcome was the deflation of 1920–1. During the early 1930s when the bank panics occurred following the stock market crash of October 1929, US money supply fell drastically. The Fed did very little to expand its money supply and prevent the money multiplier decline. Its passive performance led to a huge reduction of US money supply by 25 per cent and deflation (Friedman and Schwartz Reference Friedman and Schwartz1963). During World War II the Fed financed the war to a great extent and money supply increased rapidly. However, inflation did not increase as much due to the introduction of price controls. In the post-Word War II to 1965 period, price stability was the norm. The Fed started applying a lean-against-the-wind policy during the 1953 recession. Money market rates were set according to macroeconomic conditions.
The late 1960s saw the exploitation of the short-run Phillips curve by the Fed. Stop–go monetary policy was applied with stimulative policies producing inflation. The control of inflation was left to income policies. The 1970s saw rising inflation as Chairman Arthur Burns preferred the use of price controls to fight inflation. US inflationary monetary policy was responsible also for the demise of the Bretton Woods system in the early 1970s. Starting in 1978 inflation reached even higher levels with the replacement of Arthur Burns by William Miller, who followed expansionary monetary policy. His successor, Paul Volcker, changed the Fed's operating procedure by controlling non-borrowed reserves and applied tight monetary policies that brought down inflation from the high levels of the 1970s. His policy was continued when Alan Greenspan took over in 1987. The years since the mid 1980s have been characterised by both low inflation and low inflation volatility, the so-called Great Moderation. This period has also seen more emphasis on communication and transparency in the Fed, as well as central banks in other developed countries, in order to anchor inflation expectations and achieve its monetary policy objectives.
According to Romer and Romer (Reference Romer and Romer2013), excessive pessimism about the effectiveness of monetary policy is responsible for the inability of the Fed to deal with the deflation of the 1930s and inflation of the 1970s. Romer and Romer (Reference Romer and Romer2013) argue that, even though it is too early to be definite, it may be the case that during the recent severe recession of 2007–9 the Fed also did not take prompt action to stabilise the economy due to undue pessimism about the potency of monetary policy. Selgin et al. (Reference Selgin, Lastrapes and White2012) have estimated inflation persistence and inflation uncertainty in the pre- and post-Fed founding era. They find that since the establishment of the Fed the persistence of both inflation and inflation uncertainty has increased.
III
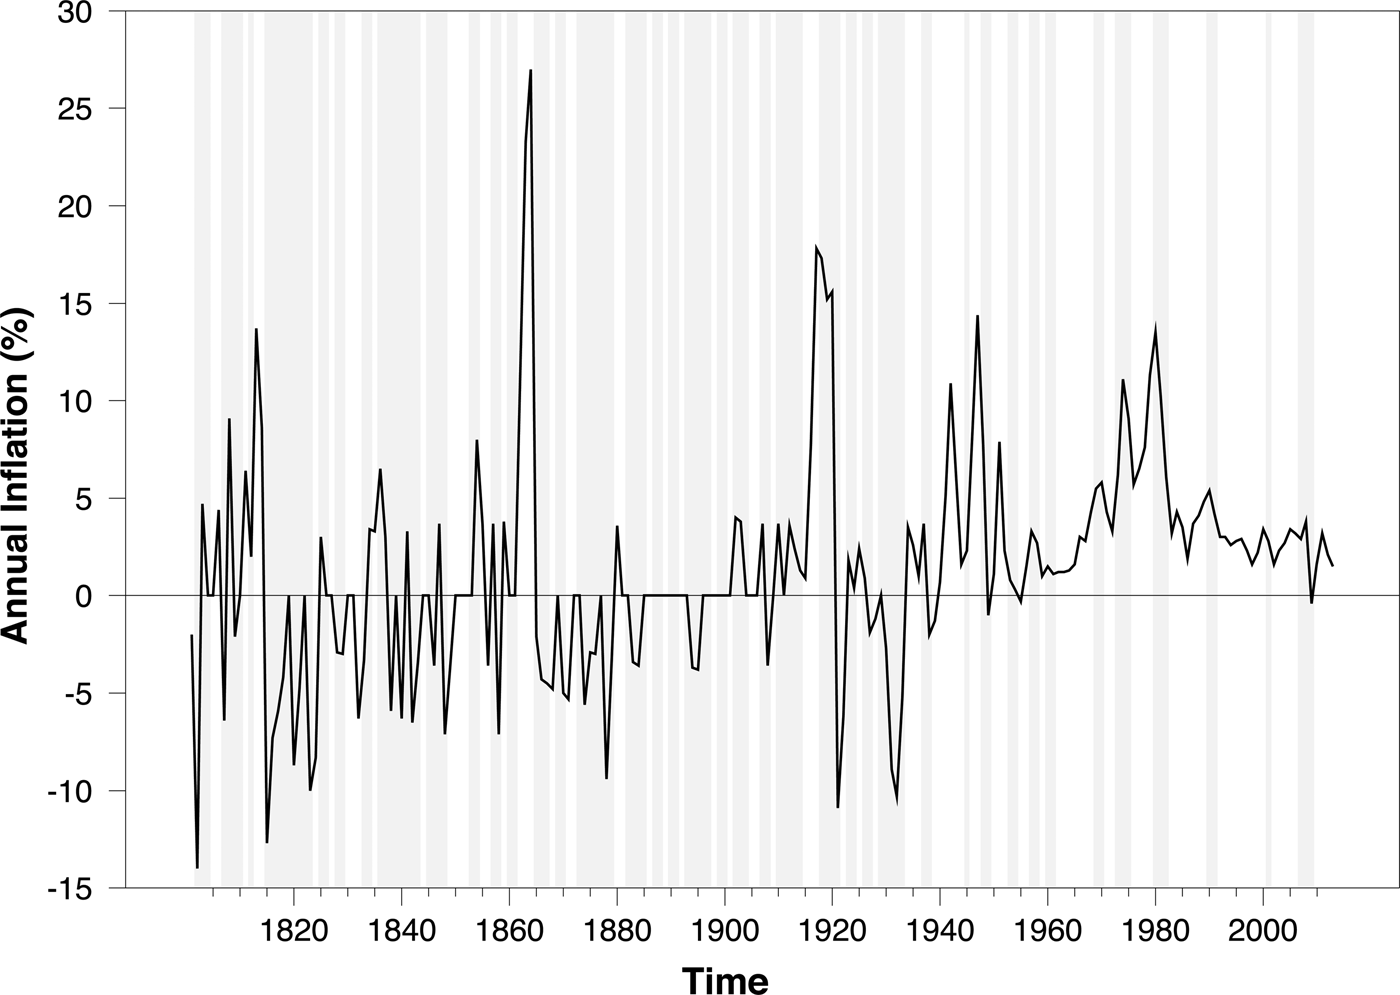
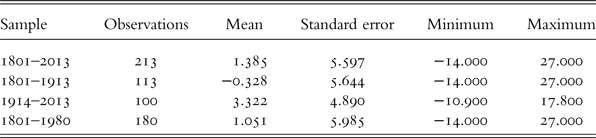
Our annual US inflation data series covers over 200 years for the period 1801–2013. The raw CPI data are taken from the Minneapolis Fed website and inflation rates are constructed taking the logged differences, ln(CPI t/CPIt-1). The dates of US recessions are taken from the National Bureau of Economic Research for the period 1854–2013.Footnote 6 For the earlier years, the dates are taken from Knoop (Reference Knoop2004). Figure 1 illustrates the annual rate of inflation and in shaded areas the recessions that took place during our sample. Spikes in inflation are associated with the US Civil War, as well as World Wars I and II. Table 1 presents the summary statistics for the annual rate of inflation over the complete sample and a number of sample splits. Besides the full sample, we also split the sample into pre- and post-Fed periods and the last sample, which omits the period where the Fed adopted a dual mandate (this will be discussed in more detail later). From both Table 1 and Figure 1, there is considerable evidence of deflation, in particular during the nineteenth century, and predominantly as a result of banking panics.Footnote 7 Inflation is clearly higher during the period since the Fed has been established. However, this is just an unconditional result that arises from the summary statistics without reference to a formal regression analysis.
US annual inflation, with recession dates shaded

US inflation (annual percentages)

We estimate an asymmetric GARCH in-mean (GARCH-M) model for inflation. There is a considerable literature adopting GARCH models to examine the inflation–inflation uncertainty relationship. Examples include Fountas (Reference Fountas2001), Hwang (Reference Hwang2001) and Kontonicas (Reference Kontonicas2004). As indicated by Henry et al. (Reference Henry, Olekalns and Suardi2007), these flexible models provide a direct test of the statistical significance of the time variation of inflation's conditional variance (Engle Reference Engle1982); the causal relationship between inflation and inflation uncertainty, rate dependence (Grier and Perry Reference Grier and Perry1998); and differences in the response of inflation uncertainty to the sign and size of inflationary shocks, i.e. an asymmetry effect (Daal et al. Reference Daal, Naka and Sanchez2005). Following evidence of asymmetry in volatility using the Engle and Ng (Reference Engle and Ng1993) sign bias test (see below), we adopt the exponential GARCH (EGARCH) model suggested by Nelson (Reference Nelson1991). Fountas et al. (Reference Fountas, Ioannidis and Karanasos2004) also employed the EGARCH methodology to model inflation uncertainty in European Union countries. Equations (1) and (3) below are the mean and conditional variance equations, respectively.
 $$\pi _t = \theta _0 + \mathop \sum \limits_{i = 1}^n \theta _i \pi _{t - i} + \lambda _1 Fed + \lambda _2 Rec + \lambda _3 \sigma _t^{\,2} + \epsilon _t $$
 $$\epsilon _t /\Omega _{t - 1} \sim \left( {0,\; \sigma _t^{\,2}} \right)$$
 $$\log \left( {\sigma _t^{\,2}} \right) = \beta _0 + \beta _1 \log \left( {\sigma _{t - 1}^{\,2}} \right) + \alpha _1 \left \vert {\displaystyle{{\epsilon _{t - 1}} \over {\sigma _{t - 1}}}} \right \vert + \gamma _1 \displaystyle{{\epsilon _{t - 1}} \over {\sigma _{t - 1}}} + \xi _1 Fed + \xi _2 Rec$$
According to equation (2), εt conditionally on the information set at time t-1 follows a distribution with zero mean and conditional variance equal to  $\sigma _t^{\,2} $. The choice of the EGARCH model is based on its advantages in relation to competing models. It does not require non-negativity restrictions placed on the parameters given the logarithmic function of the conditional variance. In the empirical model, Fed is the dummy that takes the value one during the Fed years (1914 onwards) and Rec is the recession dummy taking the value one during recessions and zero otherwise. The dummies enter in a multiplicative fashion to allow for interaction effects of the Fed years with recessions. The size of coefficient λ 1 captures the effect of the Fed on inflation in the absence of recessions, i.e. when the recession dummy equals zero. A negative sign would imply that average inflation was lower in the years following the creation of the Fed.
In equation (1) the conditional variance  $(\sigma _t^{\,2} $) represents a proxy for inflation uncertainty. In other words, inflation uncertainty is measured by the variance of unpredictable inflation in agreement with the model of Cukierman and Meltzer (Reference Cukierman and Meltzer1986).Footnote 8 Coefficient λ 3 captures the effect of inflation uncertainty on inflation. A positive sign indicates evidence in favour of the Cukierman–Meltzer hypothesis, which predicts that the central bank responds opportunistically to higher inflation uncertainty, thus raising inflation. In contrast, a finding that λ 3 < 0 indicates evidence in favour of the Holland hypothesis, which implies that the central bank is reacting in a stabilising manner to counteract the impact of inflation uncertainty on the real economy. Equation (3) allows for the existence of asymmetric effects of positive and negative shocks on inflation uncertainty via coefficient γ 1. The γ 1 parameter is expected to be positive and significant when there is evidence of asymmetry, i.e. positive inflation shocks increase uncertainty more than negative shocks (Friedman Reference Friedman1977; Ball Reference Ball1992). Finally, the two dummy variables take account of the role of Fed years and recessions on inflation uncertainty.Footnote 9 In analogy with the equation for the mean inflation (equation (1)), coefficient ξ 1 captures the impact of the Fed's founding on inflation uncertainty in normal (non-recessionary) times. It is likely that during recessionary periods and in the presence of a central bank in charge of monetary policy, inflation uncertainty rises as the reaction of the central bank to a recessionary environment is uncertain and depends on the type of policymaker, i.e. hawks or doves.
IV
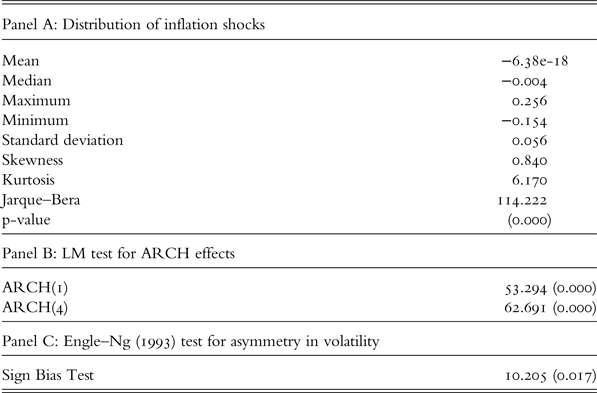
We first test for a unit root in inflation using the ADF, Phillips–Perron, and Ng and Perron (Reference Ng and Perron2001) tests. The results reported in Table 2 indicate clear evidence that inflation is stationary. Prior to the estimation of the EGARCH model we perform a number of tests with results reported in Table 3 to determine whether there is evidence for time-varying conditional volatility.
Unit root tests for US inflation (1801–2013)

Note: ADF and PP stand for the Augmented Dickey Fuller and Phillips Perron unit root tests, respectively. MZa and MZt are the Ng–Perron unit root tests. The numbers in parentheses are p-values. The numbers under the Ng–Perron statistics are the 1% critical values. The order of the ADF test was chosen according to the minimum value of the Schwarz information criterion. For the PP test, bandwith 6 was chosen under the Bartlett kernel.
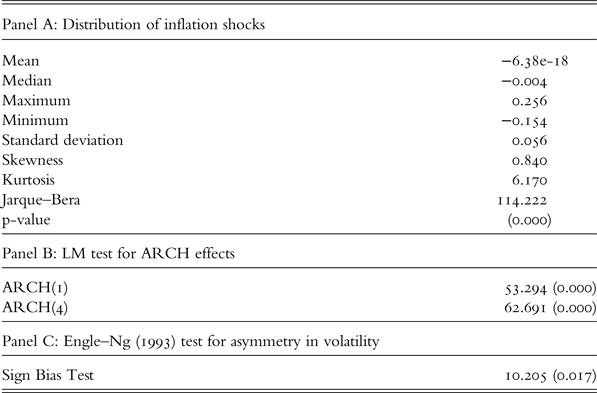
Distribution of inflation shocks and LM test for ARCH effects
Note: The numbers in parentheses are p-values. The LM tests for conditional heteroskedasticity and the Engle–Ng (1993) test are asymptotically distributed as X 2.
First, we test for normality of the deviation of inflation from a constant mean value. The reported skewness and kurtosis coefficients indicate evidence of deviations from normality. This conclusion is supported by the Jarque–Bera statistic which indicates a rejection of the normality null hypothesis. Moreover, Engle's LM test reported in panel B implies the rejection of uncorrelated squared residuals and hence offers further support to the evidence of ARCH effects. Based on these results we conclude that the inflation errors are conditionally heteroskedastic. Finally, in panel C of Table 3, we report the Engle–Ng (1993) statistic, which rejects the null of symmetry in relation to volatility.
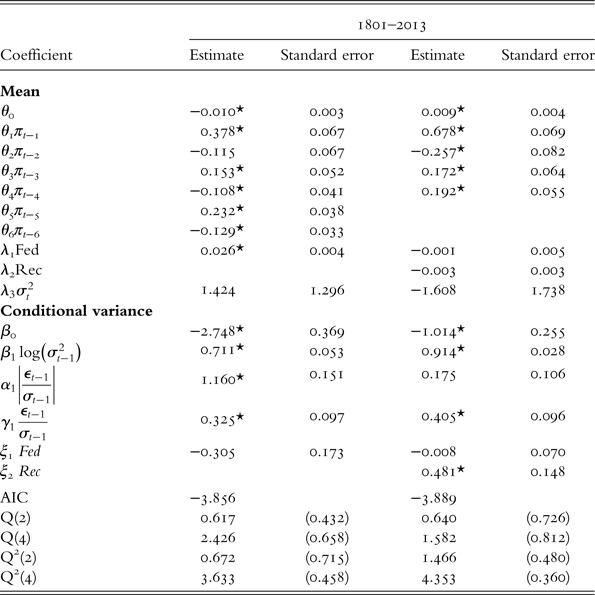
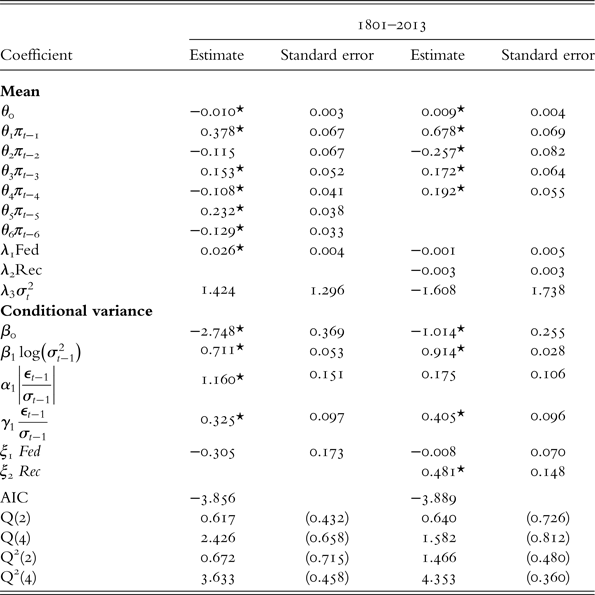
Table 4 reports the estimated EGARCH models.Footnote 10 A large number of EGARCH models were estimated and the chosen model was based on the standard information criteria approach. Standard errors have been calculated using the approach of Bollerslev and Wooldridge (Reference Bollerslev and Wooldridge1992) that suggests consistent estimators of standard errors under Quasi-Maximum Likelihood (QML) estimation.
EGARCH model for US inflation
Note: A * represents significance at the 5% level. AIC is the Akaike Information Criterion. Q(2) and Q(4) are Q-statistics for tests of serial correlation of second order and fourth order, respectively. Q2(2) and Q2(4) are Q-statistics for tests of serial correlation in squared residuals of second order and fourth order, respectively. In all cases, numbers in parentheses are p-values.
In Table 4, columns 2 and 3 refer to a model where both the inflation equation and the conditional variance equation do not include a recession dummy. The last two columns add a recession dummy in both equations. The full sample results indicate the following: first, when recessions are not accounted for, the Fed years are associated with higher inflation and no difference in inflation uncertainty in comparison with the pre-Fed regime (coefficient λ 1 is positive and statistically significant at very low significance level and ξ 1 is negative but not statistically significant). The interpretation of λ 1 is that annual inflation during the Fed years was by 2.6 per cent higher than in the pre-Fed years. This result is not very different from the unconditional result reported in Table 1, which shows that inflation during the Fed years was about 3 percentage points higher than in the pre-Fed period. Qualitatively similar results are obtained if a war dummy (taking the value 1 for World Wars I and II) and a Civil War dummy are included in the conditional mean and conditional variance equations. Second, once a recession dummy is added, the creation of the Fed has no impact on inflation or inflation uncertainty as indicated by the lack of statistical significance of coefficients λ 1 and ξ 1, respectively.Footnote 11 Given the insignificance of parameter λ 1, we argue, in line with Selgin et al. (Reference Selgin, Lastrapes and White2012), that inflation was higher under the Fed since recessions were more prolonged. Third, inflation uncertainty has not had a statistically significant effect on average inflation.Footnote 12 Fourth, the asymmetric GARCH model seems to fit the data well as the asymmetry coefficient (γ 1) is positive and statistically significant. In addition, this asymmetry evidence is consistent with Friedman (Reference Friedman1977) in the sense that more inflation (positive inflation shocks) should lead to more uncertainty than less inflation (negative inflation shocks). Finally, the large value of coefficient β 1 (0.711 or 0.914) indicates that inflation uncertainty is highly persistent.
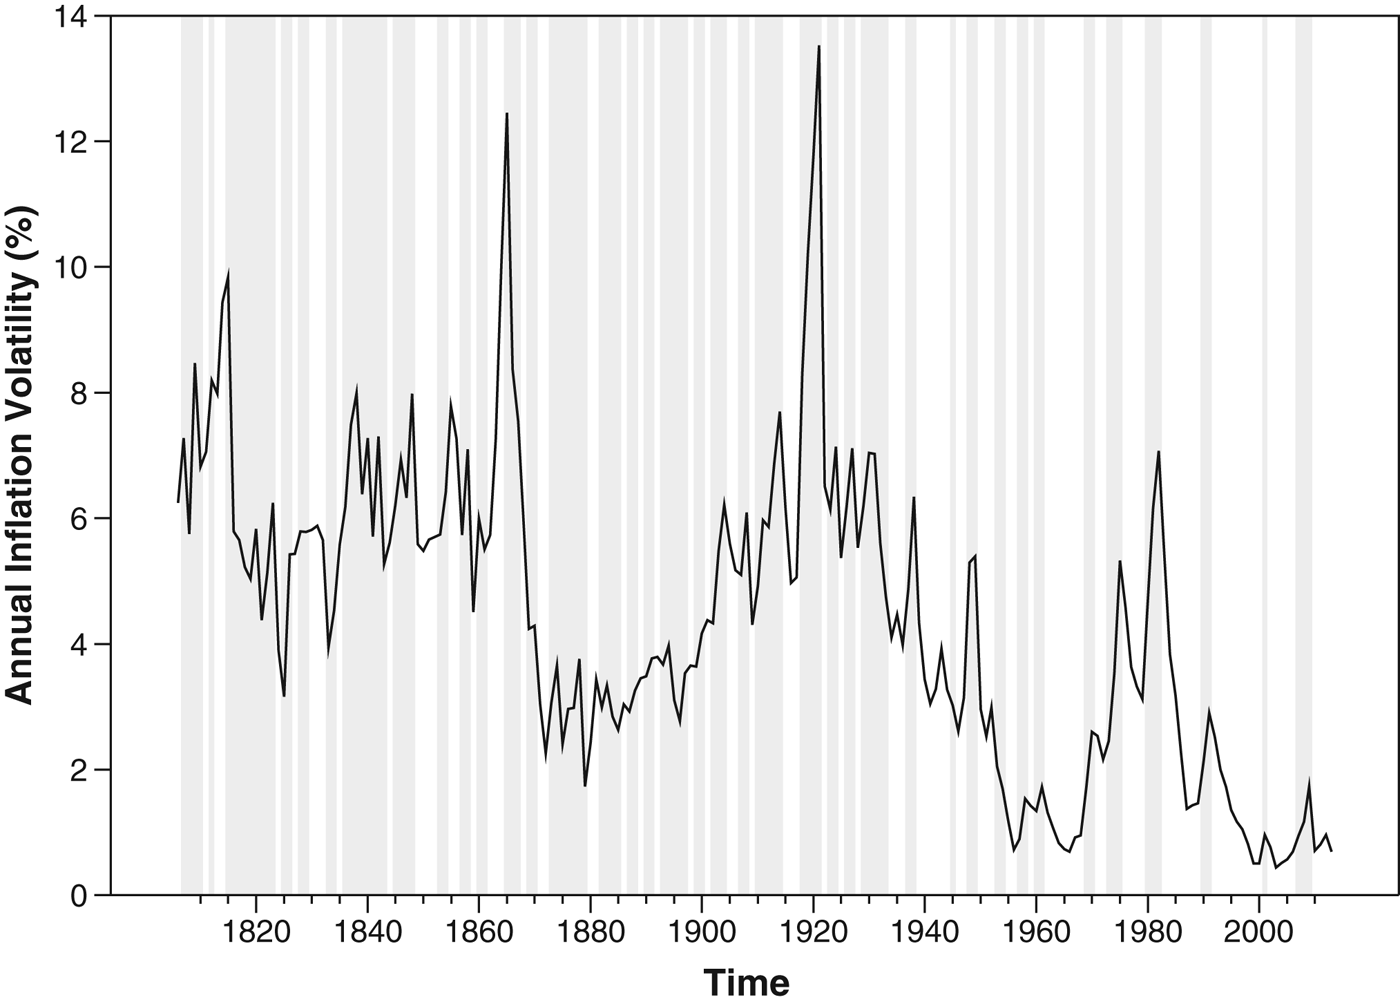
Figure 2 plots the estimated inflation uncertainty for the complete sample. The graph clearly indicates evidence of clustering, a notable attribute of time-varying conditional volatility. In particular, periods of considerable uncertainty are the periods around the start of our sample (Anglo American War of 1812–15), the periods of the US Civil War (1861–5), World War I and the mid 1970s. As expected, the post-1990 period, the Great Moderation, reports very low uncertainty. Our chronology of periods of inflation uncertainty is consistent with Cogley and Sargent (Reference Cogley and Sargent2015), who use wholesale price inflation and an alternative econometric approach.
US annual inflation uncertainty, with recession dates shaded

We implement a number of robustness checks concentrating on a series of important events that affected average inflation during the sample. We use dummies to capture, first, the Great Depression and, second, the Great Inflation of the 1970s. The main results are consistent with those reported in columns 2–5 of Table 4.Footnote 13 That is, even if we take account of these two periods, the Fed years were not accompanied by both lower inflation and lower inflation uncertainty. Therefore, some of our reported results using our narrow focus of performance are consistent with results reported for the broader measures, e.g. Selgin et al. (Reference Selgin, Lastrapes and White2012) and Hogan (Reference Hogan2015). Similar to the results of these authors, we also find that inflation has been higher during the Fed years.
Our finding that inflation uncertainty was higher during recessionary periods (the coefficient of the recession dummy in column 4 is positive and significant), which were quite common during the Fed years (Selgin et al. Reference Selgin, Lastrapes and White2012), is consistent with the claim by Romer and Romer (Reference Romer and Romer2013). These authors find that the Fed did not manage to stabilise the economy in the 1930s, 1970s, and perhaps during the Great Recession due to excessive pessimism about the effectiveness of monetary policy. During these periods that were also associated with major recessions, we find that inflation uncertainty was higher, which may be due to the inaction on the part of the Fed, as claimed by Romer and Romer (Reference Romer and Romer2013).Footnote 14
Indeed, leading members of the FOMC have claimed after the recent US recession that monetary policy tools are not very effective (Romer and Romer Reference Romer and Romer2013). Perhaps the claims that monetary tools may not be very effective is justified by the recent findings by Hamilton et al. (Reference Hamilton, Harris, Hatzius and West2015). Using cross-country data that begins in the nineteenth century the authors find that there is very high uncertainty regarding the equilibrium real interest rate and its association with trend GDP growth.
V
During our sample period there were various types of crises affecting the US economy. Principal causes of the bank panics were collapsing asset prices and stock prices in particular. With the resulting unhealthy balance sheets and the uncertain economic conditions (potentially reflected via inflation uncertainty), many banks became insolvent with eventual bank panics ensuing. Banking crises in particular were a common phenomenon in both the nineteenth and twentieth centuries, with panics occurring with regular frequency: 1819, 1837, 1857, 1873, 1884, 1893, 1907 and 1930–3. Reinhart and Rogoff (Reference Reinhart and Rogoff2010, Reference Reinhart and Rogoff2011) have provided detailed documentary evidence of these crises. Using the Reinhart and Rogoff (Reference Reinhart and Rogoff2010, Reference Reinhart and Rogoff2011) crisis dates we now include additional adjustments in our model for the conditional mean and conditional variance equations. In our model the greater uncertainty as a result of the banking and stock market crises should be reflected in higher inflation uncertainty. The banking and stock market crises may also have an effect on inflation.
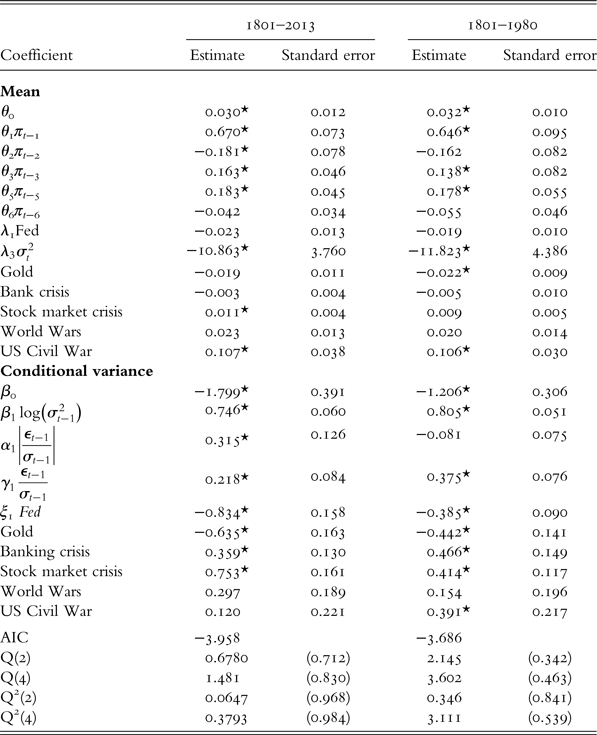
It is important to note that during the sample period several exchange rate regimes were in place. In particular, the participation of the US in the gold standard should be an important determinant of US inflation performance during this period. As a further robustness test, we include a gold standard dummy (named Gold) for the period 1877–1913 capturing the US membership of this exchange rate regime (McCallum Reference Mccallum1996, pp. 78–81).Footnote 15 Table 5 includes the results of the estimated EGARCH model that incorporates dummies for banking and stock market crises, the gold standard, the two World Wars (named War) and the Civil War (named Civil) in both the mean and conditional variance equations.Footnote 16 As panics are likely to correspond with recessions, we have not included the recession dummy. The following results are obtained: first, we find no statistically significant evidence that inflation was different between the Fed and pre-Fed years. This result is consistent with the conclusion reached on the basis of the results of Table 4. Second, in contrast, we find that during the Fed years inflation uncertainty was lower.Footnote 17 Third, banking crises increase inflation uncertainty statistically significantly, but their effect on inflation is insignificant. Fourth, stock market crises affect positively both inflation and inflation uncertainty. Fifth, inflation is higher during World Wars I and II and the Civil War. Sixth, as expected, inflation uncertainty was lower during the gold standard years. Finally, inflation uncertainty has a negative and significant effect on inflation in accordance with the Holland hypothesis, a result similar with the benchmark model of Table 4.
EGARCH model for US inflation: robustness tests
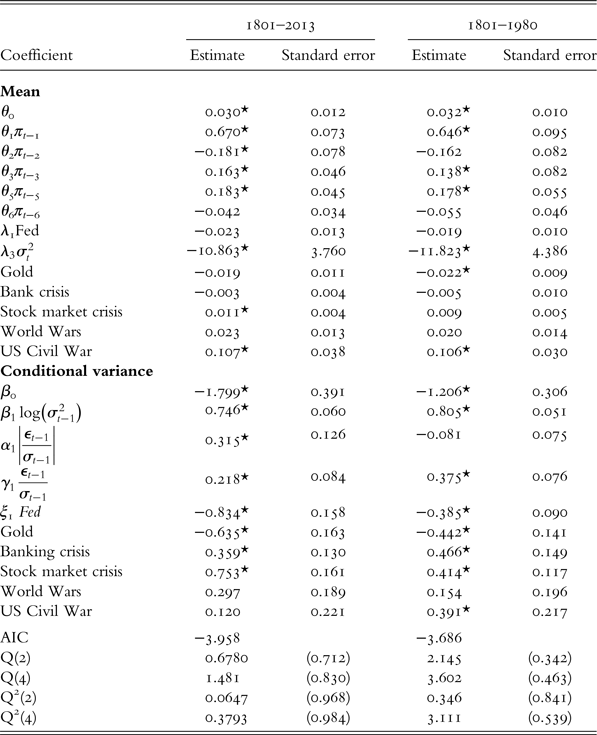
Note: A * represents significance at the 5% level. AIC is the Akaike Information Criterion. Q(2) and Q(4) are Q-statistics for tests of serial correlation of second order and fourth order, respectively. Q2(2) and Q2(4) are Q-statistics for tests of serial correlation in squared residuals of second order and fourth order, respectively. In all cases, numbers in parentheses are p-values.
As an additional check for robustness of our results, in the last two columns of Table 5 we report results of the estimated model for the 1801–1980 period. By ending the sample in 1980, we account for a possible structural break associated with the introduction of the Fed's dual mandate and the emphasis on price stability along with maximum employment. We thus remove the stable inflation period (low and stable inflation) that is associated with the Great Moderation. Again the results indicate that only inflation uncertainty and not inflation was lower during the Fed years.Footnote 18 In other words, our sensitivity results further emphasise the unsuccessful performance of the Fed in fighting inflation. Again, we find a negative and very statistically significant effect of inflation uncertainty on inflation, as implied by the Holland hypothesis. Regarding the impact of the other dummies on inflation and inflation uncertainty, our results are generally consistent with the complete sample.Footnote 19
Finally, our finding that inflation uncertainty is lower during the Fed years is in broad agreement with the findings of a study by Caporale and McKiernan (Reference Caporale and Mckiernan1998). Using a GARCH model, the authors report evidence that interest rate uncertainty has been lower since the founding of the Fed. Given that long-run nominal interest rates closely follow expected inflation, Caporale and McKiernan's (Reference Caporale and Mckiernan1998) results are consistent with our finding that inflation uncertainty has been reduced since the creation of the Fed.Footnote 20
VI
This article uses historical US inflation data covering over two centuries to examine the impact of the Fed's founding on average inflation and inflation uncertainty. We find that the founding of the Fed is associated with higher average inflation and lower inflation uncertainty.Footnote 21 Our results are robust to the incorporation of dummies capturing banking and stock market crises, wars and the gold standard years. We also find consistency when we omit the post-1980 period, which includes the dual mandate that characterised US monetary policy. The gold standard years have been associated with lower inflation and inflation uncertainty. On the other hand, crises (in the banking sector and the stock market) are a positive determinant of inflation uncertainty. Inflation and/or inflation uncertainty was also high during World Wars I and II and the Civil War. Finally, we conclude that the central bank has responded to increasing inflation uncertainty in a stabilising manner in support of the Holland hypothesis. The above results indicate that some of the criticism the Fed has received during the years is justified, at least within the narrower focus of inflation–inflation uncertainty performance.