Introduction
Systems for calculating metabolisable protein (MP) requirements of ruminants generally use a single factor to describe the efficiency of conversion of MP into milk protein (see Jarrige and Alderman, Reference Jarrige and Alderman1987). Because, in the lactating dairy cow, milk constitutes the largest use of MP, this efficiency has a major influence on estimates of daily MP requirement.
In the UK, the MP System was introduced as the protein rationing system for ruminants in 1992 (AFRC, 1992), in an effort to increase the efficiency with which protein is used to feed dairy cattle. The MP System builds on principles elaborated by the Agricultural Research Council Technical Committee on the Nutrient Requirements of Farm Livestock (AFRC, 1990). The MP system states that when energy and protein supplies are co-limiting, MP is converted to milk protein output with an efficiency of 0.68. This efficiency factor is the product of an efficiency of use for an ideal amino acid mixture at the mammary gland (aai; 0.85) and a relative value (RV) for food proteins, which has been equated to 0.80 (AFRC, 1992). The estimate for aai is probably reasonably robust, being consistent across production functions (growth, egg production, milk secretion) in farmed livestock species (Oldham, Reference Oldham1987). Estimation of RV is, however, very difficult for ruminant animals, and hence the estimate of the overall efficiency of nutrient use (aai × RV) is particularly vulnerable to the estimated values for RV. In the advisory manual (AFRC, 1993), which was published to help implement the system, a ‘safety margin’ of 5% was added to the estimated requirements for protein and energy in partial recognition of the uncertainties inherent in the system.
Experiments designed to examine the MP system have proved difficult to interpret, often due to the confounding effects of dietary protein on food intake and thus energy supply (Newbold, Reference Newbold1994). However, in general, such experiments have concluded that the MP system underestimates the amounts of MP that are needed to sustain specific rates of true milk protein output by dairy cows (Newbold et al., Reference Newbold, Cottrill, Mansbridge and Blake1994), at least in experiments where protein supply has been high. These discrepancies may be due to an overestimation of MP supply or an underestimation of MP requirement. The requirement for MP will be underestimated if maintenance MP requirement is underestimated, or if the efficiency of conversion of MP is lower than indicated by the system (Givens et al., 2004). Estimating the true conversion of MP supply is further confounded by the possibility of a ‘marginal’ response, where MP supply above requirement is used with a lower efficiency, resulting in an increased net milk protein output, but with a lower efficiency of conversion.
Although the factor used to estimate the efficiency of MP use is clearly a variable (dependent on the chosen value for RV when amino acid supply is limiting for production), it is higher than the French PDI system (Institut National de la Recherche Agronomique (INRA), 1988), which uses a figure of 0.64, and the AAT-PBV System (Madsen, Reference Madsen1985), which uses 0.69, referring to the crude protein (CP) in milk; this would be decreased to approximately 0.65 for true protein. Of the more recently revised systems, the American National Research Council (NRC, 1985) uses 0.67 and the DVE/OEB from the Netherlands (Tamminga et al., Reference Tamminga, van Straalen, Subnel, Meijer, Steg, Wever and Blok1994) has dispensed with a fixed efficiency term, and includes a second-order polynomial equation, which varies the efficiency with differing levels of milk protein output, the efficiency decreasing as output increases. This equation was the product of regression analysis of 10 experiments (Subnel et al., Reference Subnel, Meijer, van Straalen and Tamminga1994), attributing the change in efficiency to the stage of lactation and the level of feeding. Further work (Hof et al., 1994) determined an average efficiency value of 0.64, using experiments where cows were fed between 80% and 120% of the digestible protein requirement.
The objective of this experiment was to estimate the efficiency of conversion of MP into milk protein over a wide range of production levels and to test whether the current value (0.68) is appropriate for use in practice. The purpose of this work was to provide estimates of this efficiency of use where milk protein production was protein limited while energy supply was sufficient to meet the expected milk yield, and also where protein supply was in excess. The combination of treatments was expected to allow the unknown point of intersection of limitation and excess to be defined as the efficiency of milk protein utilisation where protein and energy were ideally balanced, or at least to describe a range of efficiencies, which could be incorporated into a variable efficiency factor.
Material and methods
Overview of experimental design
In order that dry matter intake (DMI), and hence milk production by individual cows, could be maximised, two covariate periods were undertaken. The first sorted cows into one of three intake groups, the second allowed blocks of four cows with similar milk energy outputs within an intake group to be created. Animals were then allocated randomly to treatments within a block, within which all treatments were isoenergetic in terms of metabolizable energy (ME). The DM offered to cows was limited to ensure that cows could not eat more than the predicted ME requirement. This process was designed to minimise the variation within a block, and to determine the efficiency of conversion of MP into true milk protein over a range of production levels.
Animals, covariate periods and blocking
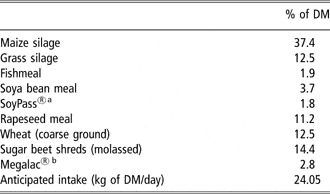
Seventy-two Holstein second or subsequent parity cows were used, with a mean ± SD of 44 ± 15 days in milk at the start of the covariate periods. All animals were offered ad libitum access to a covariate period diet (Table 1) through individual cow feeders (American Calan Inc., Northwood, NH, USA) for 9 days. DMI for each animal was calculated based on a mean of the last 4 days intake. All cows were milked twice daily at 0600 h and 1800 h, and were fed once daily at 0900 h throughout the experiment.
Covariate period total mixed ration formulation

DM = dry matter.
aSoyPass®; Non-enzymatically browned soyabean meal, a rumen bypass protein source, Borregaard UK Ltd, Warrington, Cheshire, UK.
bMegalac®; Rumen inert fat; Volac, Royston, Hertfordshire, UK.
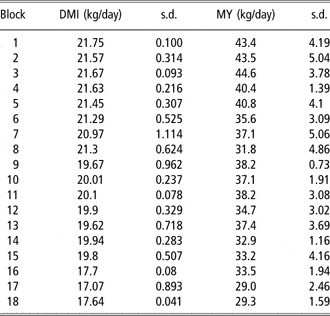
Cows were then formed into groups of 24 based on DMI (to represent high-, middle- and low-intake groups). Within a group, cows were then offered a fixed level of DM, close to the lowest ad libitum intake of the cows in each intake group. The level of DM offered was increased in each group after 5 days, until there were at least two cows in each intake group refusing food. Cows were offered this level of food for a further 10 days and then ranked by milk production in each of the intake groups. The cows within each of the three intake groups were distributed into 18 blocks of four based on milk energy yield, and randomly allocated to one of four treatments (−25%, −12.5%, +12.5% and +25% MP) (Table 2).
Dry matter intake (DMI) and milk yields (MY) for 18 blocks of cows at the end of the blocking period

Treatments
The treatments were designed to provide ME at the same level to each animal within a block, meeting the predicted energy requirements of each animal for maintenance and milk production (AFRC, 1990), while the amount of MP provided was designed to be either 25% or 12.5% higher (+25, +12.5) or lower (−25, −12.5) than the requirement calculated according to the MP System (AFRC, 1992). The diets were offered for three periods, each of 3 weeks’ duration, with individual animals remaining on the same treatment for each of the three periods. Previous milk energy output data from this herd was used to estimate the expected decline in milk yield over a 3-week period. In order to maintain energy intakes, the level of food offered was decreased by 0.5 kg of DM at the start of the second and third 3-week periods.
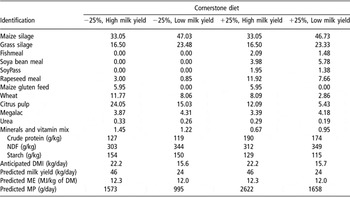
Four ‘cornerstone’ diets were formulated, to provide either 25% higher or 25% lower than the requirements calculated by the MP system for yields of either 46 or 24 kg milk/day (Table 3). As far as was possible, the diets were formulated to use the same raw materials in similar ratios with a fixed level of forage (11 kg of DM/day of a grass silage and maize silage mixture, in a ratio of 1 : 2 on a DM basis), although the high-protein foods (fishmeal, soya bean meal and SoyPass®; Borregaard UK Ltd, Warrington, Cheshire, UK) could not be included in the low-protein diets. The ingredients included in the concentrate portion of the feed were typical of those used for feeding dairy cows in the United Kingdom, thus representing an amino acid profile, which may also be considered typical.
Cornerstone diet formulations (% of DM)

DM = dry matter; ME = metabolisable energy; MP = metabolisable protein.
−25%, −12.5%, +12.5% and +25% represent MP supply from 25% below the estimated requirements, through −12.5% and +12.5% up to 25% above requirements for the average performance of animals within blocks at the start of the experiment.
Using these four ‘cornerstone’ diets, a total of 32 individual diets were prepared to meet the four MP treatment levels (−25%, −12.5%, +12.5% and +25% of MP requirement) with the appropriate energy supply for any milk yield between 24 and 46 kg/day, while maintaining the forage content of the ration.
Measurements
Individual milk yield and DMI were recorded daily. Cows were weighed and milk samples collected on days 15, 17, 19 and 21 of each 3-week period, and were condition scored on days 15 and 21. In addition, cows were weighed on day 11 of periods 2 and 3.
The DM content of the diets was determined three times per week, and used to adjust the amount of fresh food offered to achieve the target DMI. DMI was calculated from the appropriate DM determination, adjusted for the volatile fraction determined in a pooled forage sample.
Analysis
Individual samples of milk were analysed for fat, protein and lactose using a System 4000 Milkoscan (Foss Electric (UK) Ltd, Wheldrake, York, UK), which had been calibrated for true protein against Kjeldahl nitrogen (N) analysis (International Dairy Federation (IDF), 1993). These milk samples were used to prepare a weighted composite sample for the week for measurement of non-protein nitrogen (NPN) by precipitation with tricholoracetic acid followed by Kjeldahl N determination (Moorby et al., Reference Moorby, Dewhurst, Thomas and Marsden1996), and urea using a Boehringer kit (Cat No. 542946; Boehringer Mannheim, Lewes, Sussex, UK).
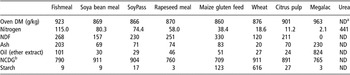
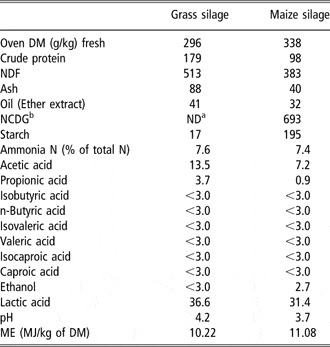
Samples of forage were taken daily for the last 7 days of each period and stored for later analysis. Samples of the non-forage foods were taken when the supplement premixes were made and stored for later analysis (Tables 4 and 5). Crude protein, neutral cellulase digestibility with gamminase (NCDG), NDF, starch, ash, ammonia N, oil and silage volatile fatty acid (VFA) were analysed using the methods indicated in Livesey et al. (Reference Livesey, Harrington, Johnston, May and Metcalf1998).
Analysis of food components (g/kg of DM unless otherwise stated)

aND = not determined; DM = dry matter.
bNCDG = neutral cellulose digestibility (gamminase).
Analysis of silages (g/kg of corrected DM unless otherwise stated)

aND = not determined.
bNCDG = neutral cellulose digestibility (gamminase).
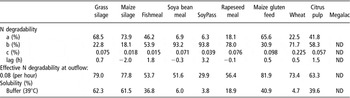
The ruminal degradabilities (AFRC, 1992) of DM and N for the grass silage, maize silage and the raw materials were also determined (Table 6) using non-lactating dairy cows (n = 4) fed a basal ration consisting of 60% forage and 40% concentrate. The forage component of the basal ration was grass silage, and the concentrate was an 18% CP dairy concentrate. The standard techniques described by the MP system (AFRC, 1992) were used, with the addition of a determination of N solubility using a 39°C borate-phosphate buffer wash (Krishnamoorthy et al., Reference Krishnamoorthy, Muscato, Sniffen and Van Soest1982). All N concentrations were determined using the Kjeldahl method.
Nitrogen (N) Degradability characteristics, effective degradability and solubilities of silages and raw materials

Concentrations of ME for the four cornerstone total mixed rations (TMRs) were determined in wether sheep fed at maintenance, using the standard techniques described by the ME system (AFRC, 1990). The ME contents of the individual diets were assumed to be linearly related to the ME content of the cornerstones, and individual ME intakes were calculated on this basis.
Calculations
Dry matter intake, corrected for losses of the volatile fraction (Porter et al., 1984), was calculated for each day of the collection week, and used to determine MP intakes. In order to calculate the supply of MP, a level of feeding (as a multiple of maintenance ME) was required. This was calculated using the ME concentrations for the diets and the liveweight for each cow, determined as the mean of four liveweight measurements taken in week 3 of each period. ME balance was calculated as the difference between ME intake and ME required, incorporating the changes in liveweight observed between periods for each animal. The energy required for liveweight gain was assumed to be 29.2 MJ/kg and the energy supplied by weight loss was assumed to be 24.6 MJ/kg (AFRC, 1990). ME required for milk production included the energy contribution for individual components (protein, fat and lactose), thus accounting for any changes in milk composition. Intake of MP was then estimated on an individual animal basis. No allowance was made for the MP or ME contribution from liveweight change within the measurement week, since variation between weighings showed no pattern within the week; however, allowance was made for weight change between periods. Individually determined degradability values were used in the determination of the MP intakes. Milk true protein output was calculated from the milk protein yield using the mean of the four measurements taken during week 3 of each period. Milk NPN was subtracted from the milk protein, using a factor of 6.38 to equate the NPN with milk protein.
Statistical analysis
To estimate MP available for milk production, the MP supply was corrected for maintenance using the AFRC (1992) approach (MP intake −2.3* liveweight0.75, denoted MPproduction), taking account of changes in bodyweight between periods, but not pregnancy. Multiple regression was performed using a variety of dietary inputs, including the ME available for production (MEproduction), which was calculated as ME supply minus the maintenance ME (AFRC, 1992). Since MP was always a significant component of the regression, each treatment milk true protein yield was regressed against the MPproduction (with intercept constrained to zero) to estimate the efficiency of use of MP for milk protein production within each treatment. In order to determine the pattern of the efficiency with variation in MP supply, these efficiency estimates were regressed against MPproduction (i.e. excluding maintenance). In theory, the efficiency where protein supply meets requirement is to be represented by the intercept of this relationship, i.e. where MPproduction – productive requirement equals 0. The estimation of productive requirement (milk protein output/efficiency) was, however, directly related to the efficiency, and an additional step was required. To determine the actual efficiency where protein supply matches the requirement, an iterative approach was taken to determine which system efficiency value would result in the closest fit between the efficiency used to estimate requirements and the intercept of efficiency at point zero, where MPproduction equals productive requirement.
All statistical analyses were performed using Genstat v. 5.0 (Lawes Agricultural Trust, Rothampstead, Hertfordshire, UK), except for multiple regressions, which were performed using Minitab (Release 14.20, Minitab Inc., State College, PA, USA). Treatment effects on period means for DMI, ME intake, MP intake, daily milk yields, ME balance and milk compositions were determined by analysis of variance, with treatment and period as the main factors, and applying the following contrasts: −25% v. −12.5%, −12.5% v. +12.5% and +12.5% v. +25% using Genstat v. 5.0.
Results
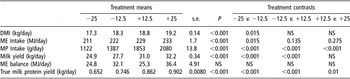
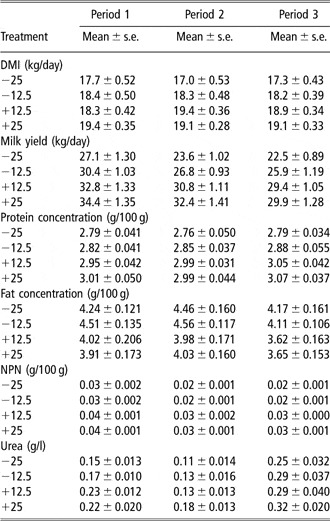
Although the amount of food offered was the same within a block for all treatments, there was variation in the amount consumed, particularly after the first period. DMI, ME intake, MP intake, daily milk yields, ME balance and milk compositions are presented as least squares mean ± s.e. in Table 7. The lowest intakes, throughout, were for the −25% treatment and this was lower (P < 0.05) than for the −12.5% treatments in each period (Table 7). Differences between the other treatments were modest.
Statistical analysis of dry matter intake (DMI), metabolizable energy (ME) Intake, metabolizable protein (MP) Intake, milk yield, ME balance and milk protein output by treatment

−25%, −12.5%, +12.5% and +25% represent MP supply from 25% below the estimated requirements, through −12.5% and +12.5% up to 25% above requirements for the average performance of animals within blocks at the start of the experiment.
The variation in DMI for the two positive treatments in Period 1 is largely due to a higher than expected DM concentration for one of the +12.5% diets. The amount of DM refused within a treatment was similar between periods and represented 11% of the food offered for −25% treatment, 6% for −12.5% and 1% for +12.5 and +25% treatments.
The milk yields of the cows varied with treatment (Table 7), with an overall mean difference of 7.3 kg/day between the +25% and −25% treatments. Milk yields, as expected, were lowest for the −25% treatment (P < 0.001) compared with the −12.5% treatment, which was itself significantly lower than the +12.5% treatment (P < 0.01). Differences between the +12.5% and +25% treatments were not significant. It is interesting to note that the milk urea concentrations in the −25% treatment cows were extremely low (0.11 g/l in period 2), with some samples producing values below the detection limits of the assay. Even for the +25% treatment, the concentrations were not excessively high, averaging 0.24 g/l for the study (Table 8).
Dry matter intake (DMI), milk yields, milk protein, fat, non-protein nitrogen (NPN) and urea concentrations in the final week of each period

−25%, −12.5%, +12.5% and +25% represent MP supply from 25% below the estimated requirements, through −12.5% and +12.5% up to 25% above requirements for the average performance of animals within blocks at the start of the experiment.
Regression of true milk protein output against MPproduction and MEproduction was used to determine whether the changes in DMI act as a confounding factor in the experiment and function (Table 9). The MEproduction impact was significant only on the +25% treatment (P < 0.001), where the MP supply was clearly in excess of requirements. For the remaining treatments, MEproduction was not statistically significant and could safely be removed from the regression model.
Modelling true milk protein output (g/day) with MPproduction (MPp; g/day) and MEproduction (MEp; MJ/day) by linear regression with no constant term i.e. where the system calculation of maintenance is correct and removed from the model for clarity

−25%, −12.5%, +12.5% and +25% represent MP supply from 25% below the estimated requirements, through −12.5% and +12.5% up to 25% above requirements for the average performance of animals within blocks at the start of the experiment.
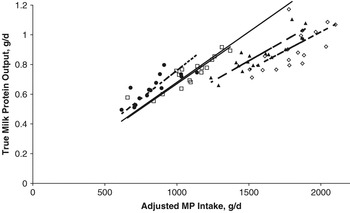
The regression of true milk protein output on MP intake for milk production (i.e. estimated MP intake less estimated maintenance needs for MP) is shown in Figure 1 for each treatment group. A line with a slope of 0.68, equivalent to the default efficiency used by AFRC (1992), is also shown.
Milk true protein output v. metabolisable protein intake for four treatment groups. • = −25% data points; □ = −12.5% data points; ▴ = +12.5% data points; ◊ = +25% data points. _____ = Efficiency line of 0.68; ___ __ = regression line for −25%; ----__ = regression line for −12.5%; - - __ = regression line for +12.5%; ------ = regression line for +25%.

At the lowest protein level (−25% treatments), the slope of the line was 0.77, the −12.5% treatment fitted a slope of 0.68, while the +12.5% and +25% gave slopes of 0.55 and 0.50, respectively (Table 10). Only the −12.5% treatment did not differ significantly from the default 0.68 slope. The iterative approach to determining the system efficiency resulted in three system values showing potential as the ‘correct’ value in this experiment – namely 0.64, 0.63 and 0.62. It was not possible to further refine the efficiency value, but if a single value were required, the average of these three values, 0.63, might be assumed to be the closest to an actual efficiency. It is likely that true efficiency is better described by a continuous function than by a single value, and the conclusion of this experiment in having three possible efficiency values supports this.
Modelling true milk protein output (g/day) and MPproduction (g/day) by linear regression with no constant term i.e. where the system calculation of maintenance is correct and removed from the model for clarity

−25%, −12.5%, +12.5% and +25% represent MP supply from 25% below the estimated requirements, through −12.5% and +12.5% up to 25% above requirements for the average performance of animals within blocks at the start of the experiment.
Discussion
The pronounced difference in the refused food between the treatments was probably related to the differing levels of protein concentration, with refusals being greatest with the lowest dietary protein concentration. Reduced food intakes by lactating cows offered diets of low protein concentration have been observed frequently (Oldham, Reference Oldham1984). The low nitrogen concentration in the food may have affected the ability of rumen microorganisms to digest fibre, but the speed with which the decreased food intake was observed for the −25% diet (3 to 4 days after introduction) suggests that this may not be the case, since blood urea concentrations from these animals were not excessively low after 1 week on diet (data not shown). In addition, the milk urea concentrations were not below 0.11 g/l, the level proposed by Nousiainen et al. (Reference Nousiainen, Shingfield and Huhtanen2004) as the level at which the rumen would be limited for nitrogen. The low intakes are a confounding factor within the experiment, since ME intakes related to these differences, and consequently the production levels of these animals would be lower than expected. The observation (Table 7) that there was a significant effect of the ME available for milk production on milk protein output only at the highest MP treatment indicates that while energy does affect the efficiency factor, this is only true when MP is overfed, i.e. when MP is limiting, there is no effect of ME. The lower food intakes on the negative treatments did decrease the milk and milk protein output but the use of the TMRs ensured that cows could not consume anything other than the balance of MP and ME specified by the treatment. Thus although the overall milk production was less than expected, the relationships between milk output and MP supply for milk should, if linear, be unaffected. Greater problems with variable food intake were observed in earlier experiments in which pelleted concentrates were fed with ad libitum grass silage. In these cases, animals had distorted the dietary treatments by consuming more grass silage than anticipated (Newbold et al., Reference Newbold, Cottrill, Mansbridge and Blake1994). When coefficients of variation were calculated for ME intake on the pairs of blocks, these ranged from 4.6% to 12.4%, with a mean value of 8.3%, and no indication of a bias towards higher variation at either the high or low milk production levels.
The specific purpose of this work was to provide a robust test of the general applicability of a constant efficiency of conversion of MP to milk protein in the AFRC (1993) system for calculating MP requirements of dairy cows. The data, as presented in Figure 1, show that the default value of 0.68 is a reasonable estimate for this conversion efficiency for diets in which MP supply is moderately limiting for milk production (e.g. −12.5% MP treatment). Indeed, the conversion efficiency appears to be higher than this value in diets which are substantially limiting in protein concentration. One explanation is that the catabolism of protein/amino acids has been decreased on the low-protein diets, similar to the reduced mammary oxidation of leucine observed when two levels of protein were fed to dairy cows (Bequette et al., Reference Bequette, Metcalf, Wray-Cahen, Backwell, Sutton, Lomax, MacRae and Lobley1996).
The biological rationale for regressing true milk protein output on MPproduction, and using the slope of the regression as an estimate of the efficiency of use of MP for milk protein synthesis is based on three assumptions, namely:
1. that the estimates of MP supply are reasonable;
2. that the estimates of MP needs for maintenance are reasonable;
3. that MP is limiting for milk protein synthesis.
The first two of these assumptions cannot be defended in absolute terms as there is no ‘gold standard’ against which to measure, absolutely, either MP yield from a diet or the maintenance needs of the cow for MP. The methods, including feed ingredients, used in this study to estimate MP supplies from the diets, are in common use for this purpose in the UK and elsewhere, so the estimates of efficiency of conversion of MP to milk are at least consistent with current common practice.
The estimate of maintenance MP, which was used to ‘correct’ the total MP supply to that available for milk synthesis, is not directly tested in this experiment. However, the estimate of efficiency of MP for milk protein synthesis, which arises from the most limiting diets, is close to the 0.68 value of the MP system, suggesting that there is, at least an internal consistency in the adoption of this value in association with the published estimate of maintenance requirements. The regression analysis was also run without correcting for maintenance MP (data not shown), and efficiency values ranging from 0.52, 0.56, 0.46 and 0.49 for the −25%, −12.5%, +12.5% and +25% treatments, respectively. This indicated that the efficiency was higher when MP was fed below requirements, and that this decreased as the level of protein feeding increased. This analysis was also used to justify the correction of MP intake for maintenance, as there was a large variation in the intercept where milk protein output is zero, which may explain the lack of apparent trend in the efficiency values. The range was from 250 g of MP intake for the +25% treatment, down to −122 g for the −25% treatment, suggesting that interpolating the linear regressions to determine the maintenance requirement across this range of treatments was unreliable. The probable reason for this unreliability is that the efficiency of MP usage continues to increase with decreasing intake.
The third assumption is more problematical. From the overall performance data (Tables 6 and 7), it is reasonable to suggest that the two diets with the lowest protein concentrations (−25%, −12.5%) were protein-limiting for production. This might also be said for the +12.5% treatment. However, it was expected that through formulation, the +25% diet would not be protein-limiting, yet the data in Figure 1 suggest that, by regression across the performances of individual cows, the conversion of MP into milk protein was little less efficient than was the case with the, likely, protein-limiting diets. It should be remembered here that the incremental differences in Figure 1 across cows within treatments indicate differences not only in MP intake but also in total food consumption (i.e. the cows were eating more or less of the same food, within a treatment). Attribution of the regression slopes to efficiency of MP use according to protein limitation alone is therefore not absolutely reliable. It might be said that (for any of the treatments) any dietary factor (including energy supply) was limiting the conversion of MP into milk protein, such that any increase in food intake generated a higher rate of milk protein output. If, under such circumstances, there was a surplus of MP available to the cow, the slope of the regression would be a minimum estimate of the efficiency with which MP can be used for milk production when MP supply is truly limiting for production. The estimates of efficiency, which have been made from the regression coefficients, should therefore be taken as minimum estimates (Table 9). The reason why such a high estimate should have been found with the +25% treatment is difficult to explain, although it is not uncommon for responses in milk protein yield to be seen with increases in dietary protein concentration well above those which would conventionally be accepted as adequate (Newbold, Reference Newbold1994; Vérité and Delaby, Reference Vérité and Delaby2000). It is possible that there are direct effects of protein intake on the DMI of cows, and this has previously (Forbes, Reference Forbes2007) been attributed to the availability of rumen-available protein. In the current experiment, the levels of MP were adjusted in the cornerstone diets mainly by adjusting the levels of the protein supplements. This allowed the effective rumen-degradable protein supply from each diet to be maintained at a level that should have prevented an intake effect due to low rumen-available protein levels. The reason for this lower intake is more likely to be related to the supply of specific amino acids that have been implicated in the satiety response in monogastric species (Forbes, Reference Forbes2007).
It might also be the case that different efficiencies are in fact a result of two efficiencies, i.e. the ‘requirement’ efficiency of around 0.63 and the ‘marginal’ efficiency of approximately 0.3. The response of a particular diet therefore is the relationship of MP intake relative to the requirement of the specific cow, i.e. how much of the protein is converted at the marginal efficiency compared to the amount converted at the requirement efficiency resulting in a range of efficiencies which is probably best described by a curvilinear function.
The aim of this experiment was to determine the true efficiency of utilisation of MP for milk protein production, and if necessary allow for a modification of the existing MP system’s mean efficiency of conversion of net MP into milk protein. The current UK system fixes this value at 0.68, which is generally higher than the values used in other systems of similar vintage. A comparison of feeding systems (Van Straalen et al., Reference Van Straalen, Salaun, Ven, Rijpkema, Hof and Boxem1994) indicated that the fit of data values from experiments performed in the Netherlands was poor for the MP system, although the system itself generated values that were consistent but with a simple bias and it was suggested that this bias could be overcome by revising the conversion factor. Since the 0.68 value was arrived at as a product of K aai and RV, for which only K aai has any values that can be supported by the literature (see Oldham, Reference Oldham1987), the correction of the efficiency factor can be incorporated in a revision of the RV. The authors of the UK MP System accepted that the value used for RV (0.80) was an estimate, which would change with the amino acid profile of the diet. The option of incorporating a polynomial function to estimate efficiency was investigated with respect to the data presented here (Metcalf et al., Reference Metcalf, Mansbridge, Blake, Newbold and Oldham1997), but this was deemed unsatisfactory, since an empirically fitted curve may not lend itself to explanations such as an amino acid sub-model. Such a sub-model could easily be introduced into the system as a definition of the RV (Oldham, Reference Oldham1987), and would allow the variable nature of efficiency to be described for individual diets and animals. The average of the individual efficiency values suggests that the efficiency with which MP above maintenance was used for milk protein production on these diets was around 0.63, suggesting an RV of 0.74, compared to the current (default) RV of 0.80 (AFRC, 1992). This may be the relevant value when designing rations using the MP system for dairy cows on similar diets within the UK. However, it should be emphasised that this estimate is only true for diets that are balanced for MP and ME, whereas in practice, cow performance is responsive to increments in diet protein concentration well above the estimated ‘point of adequacy’ for estimated requirements. This represents a particular aspect of the distinction for rationing systems, between calculation of nutrient or energy requirements, and the prediction of responses to changes in nutrient or energy allocation. Our data suggest that when dietary protein is truly limiting for performance, the efficiency of transfer of MP into milk protein was higher than in a non-limiting situation. However, it is recognised that in practice, when protein supply closely matches requirements, it would be more appropriate to calculate requirements based on an efficiency value of 0.63 until a more accurate value can be obtained.
In the long to medium term, more data are required from other diets within the UK to validate any new mean RV or efficiency, and the eventual objective should be an amino acid sub-model, which will accommodate changes in diets. When the calculation of a response to additional protein is required for ‘on farm’ rations, the effect of protein on food intake/energy supply must also be considered. It is noted that the MP system (AFRC, 1992) was never designed as a response model, and that much of the criticism that there has been of the system stems from this misconception of the design of the model. In addition, a new model should be designed which allows for the amino acid profile of the diet to be included in the calculation of efficiency, as well as providing for the interactions of protein and energy observed in this experiment.
Acknowledgements
The authors thank Dr A R Moss for the determination of ME in vivo and in situ degradability and also the Dairy Science and Farm teams at ADAS Bridgets. This study was funded by the Milk Development Council and BOCM PAULS Ltd.