1 Introduction
Thermally driven convection exists extensively in astrophysical, meteorological and geophysical applications. A typical ideal model for investigating this type of flow is the so-called turbulent Rayleigh–Bénard (RB) convection, i.e. a fluid layer inserted between the lower hot and the upper cold plates. Various aspects of this model system have been widely studied during the past few decades (Ahlers, Grossmann & Lohse Reference Ahlers, Grossmann and Lohse2009; Lohse & Xia Reference Lohse and Xia2010; Chilla & Schumacher Reference Chilla and Schumacher2012), aimed at revealing and understanding the global and local properties of thermal convection. There are two control parameters in turbulent RB convection, namely the Rayleigh number
 $Ra$
and Prandtl number
 $Pr$
. The intensity of thermal buoyancy over dissipation forces is calculated by the Rayleigh number
 $Ra=\unicode[STIX]{x1D6FC}\unicode[STIX]{x0394}gH^{3}/(\unicode[STIX]{x1D708}\unicode[STIX]{x1D705})$
, where
 $\unicode[STIX]{x1D6E5}$
is the temperature difference between the two plates,
 $H$
is the height of the fluid layer,
 $\unicode[STIX]{x1D6FC}$
,
 $\unicode[STIX]{x1D705}$
and
 $\unicode[STIX]{x1D708}$
are respectively the expansion coefficient, thermal diffusivity and kinematic viscosity of the convective fluid, and
 $g$
is the gravitational acceleration. The fluid properties are described by the Prandtl number
 $Pr=\unicode[STIX]{x1D708}/\unicode[STIX]{x1D705}$
, which is the ratio of viscous and thermal diffusions. In addition, the geometrical parameter of the convection cell is reflected by the aspect ratio
 $\unicode[STIX]{x1D6E4}=D/H$
, where
 $D$
is the cell diameter. One important response parameter that yields the heat-transfer efficiency of the system is the Nusselt number
 $Nu=JH/(\unicode[STIX]{x1D712}\unicode[STIX]{x1D6E5})$
, which compares the total heat flux
 $J$
with that given by pure conduction. Here,
 $\unicode[STIX]{x1D712}$
is the thermal conductivity of the working fluid. Another response parameter is the Reynolds number, defined as
 $Re=HU/\unicode[STIX]{x1D708}$
, where
 $U$
is the typical velocity of the large-scale circulation (LSC) across the convection cell.
To date, many studies have been performed, both experimentally and numerically, in cylindrical cells with a horizontal diameter comparable to their heights. For this geometry, a LSC, in the form of a single cellular structure that spans the height of the convection cell, emerges at sufficiently large values of
 $Ra$
(Ahlers et al.
Reference Ahlers, Grossmann and Lohse2009). Such a flow structure is self-organized from thermal plumes that originate from the upper and lower thermal boundary layers (Xi, Lam & Xia Reference Xi, Lam and Xia2004), and its discovery has stimulated considerable interest in the flow dynamics of turbulent RB convection. These include the LSC’s azimuthal (Xi, Zhou & Xia Reference Xi, Zhou and Xia2006; He, Bodenschatz & Ahlers Reference He, Bodenschatz and Ahlers2016), twisting (Funfschilling & Ahlers Reference Funfschilling and Ahlers2004) and sloshing (Brown & Ahlers Reference Brown and Ahlers2009; Xi et al.
Reference Xi, Zhou, Zhou, Chan and Xia2009; Zhou et al.
Reference Zhou, Xi, Zhou, Sun and Xia2009) motions, the flow cessations and reversals (Araujo, Grossmann & Lohse Reference Araujo, Grossmann and Lohse2005; Brown, Nikolaenko & Ahlers Reference Brown, Nikolaenko and Ahlers2005; Xi & Xia Reference Xi and Xia2007; Benzi & Verzicco Reference Benzi and Verzicco2008; Sugiyama et al.
Reference Sugiyama, Ni, Stevens, Chan, Zhou, Xi, Sun, Grossmann, Xia and Lohse2010; Chandra & Verma Reference Chandra and Verma2013; Foroozani et al.
Reference Foroozani, Niemela, Armenio and Sreenivasan2017; Wang et al.
Reference Wang, Lai, Song and P.2018), the high-order flow modes (Mishra et al.
Reference Mishra, De, Verma and Eswaran2011; Stevens, Clercx & Lohse Reference Stevens, Clercx and Lohse2011a
; Xi et al.
Reference Xi, Zhang, Hao and Xia2016; Vogt et al.
Reference Vogt, Horn, Grannan and Aurnou2018), the superstructures (Pandey, Scheel & Schumacher Reference Pandey, Scheel and Schumacher2018; Stevens et al.
Reference Stevens, Blass, Zhu, Verzicco and Lohse2018) and so on. As the dynamics of turbulent RB convection is controlled by both the Rayleigh number and the Prandtl number, there have been studies on the cessation and reversal dynamics of the LSC in the high-
 $Pr$
regime (see, for example, Xie, Wei & Xia Reference Xie, Wei and Xia2013).
It has long been proposed that the LSC plays an essential role in the heat-transport processes of turbulent convection (Ahlers et al.
Reference Ahlers, Grossmann and Lohse2009; Chilla & Schumacher Reference Chilla and Schumacher2012). Based on this viewpoint, many strategies have been put forward to try to modify or enhance the total heat-transfer efficiency by modifying the LSC. Xia & Lui (Reference Xia and Lui1997) stuck three layers of staggered fingers on the cell’s sidewall to suppress the LSC. They visualized that the mean flow pattern changes from a single-roll structure to a twisted asymmetric four-roll circulation, but the measured
 $Nu$
–
 $Ra$
scaling exponent remains almost unchanged. In order to prevent the corner-flow rolls and better accommodate the LSC, Song & Tong (Reference Song and Tong2010) adopted horizontal cylindrical cells that have a circular cross-section with no corners. They found that the measured
 $Nu(Ra)$
, as well as
 $Re(Ra)$
, associated with the LSC are insensitive to the change of the cell geometry, but the scaling behaviours of the temperature fluctuations at the cell centre change dramatically. To enhance the total heat-transfer efficiency, Bao et al. (Reference Bao, Chen, Liu, She, Zhang and Zhou2015) put forward the idea of partitioned thermal convection, i.e. inserting vertical partition walls into the convection cell with thin gaps left open between the partition walls and the upper/lower conducting plates. In this manner, they found that the convective flow in the partitioned cell becomes self-organized and more coherent, resulting in an unprecedented heat-transfer enhancement.
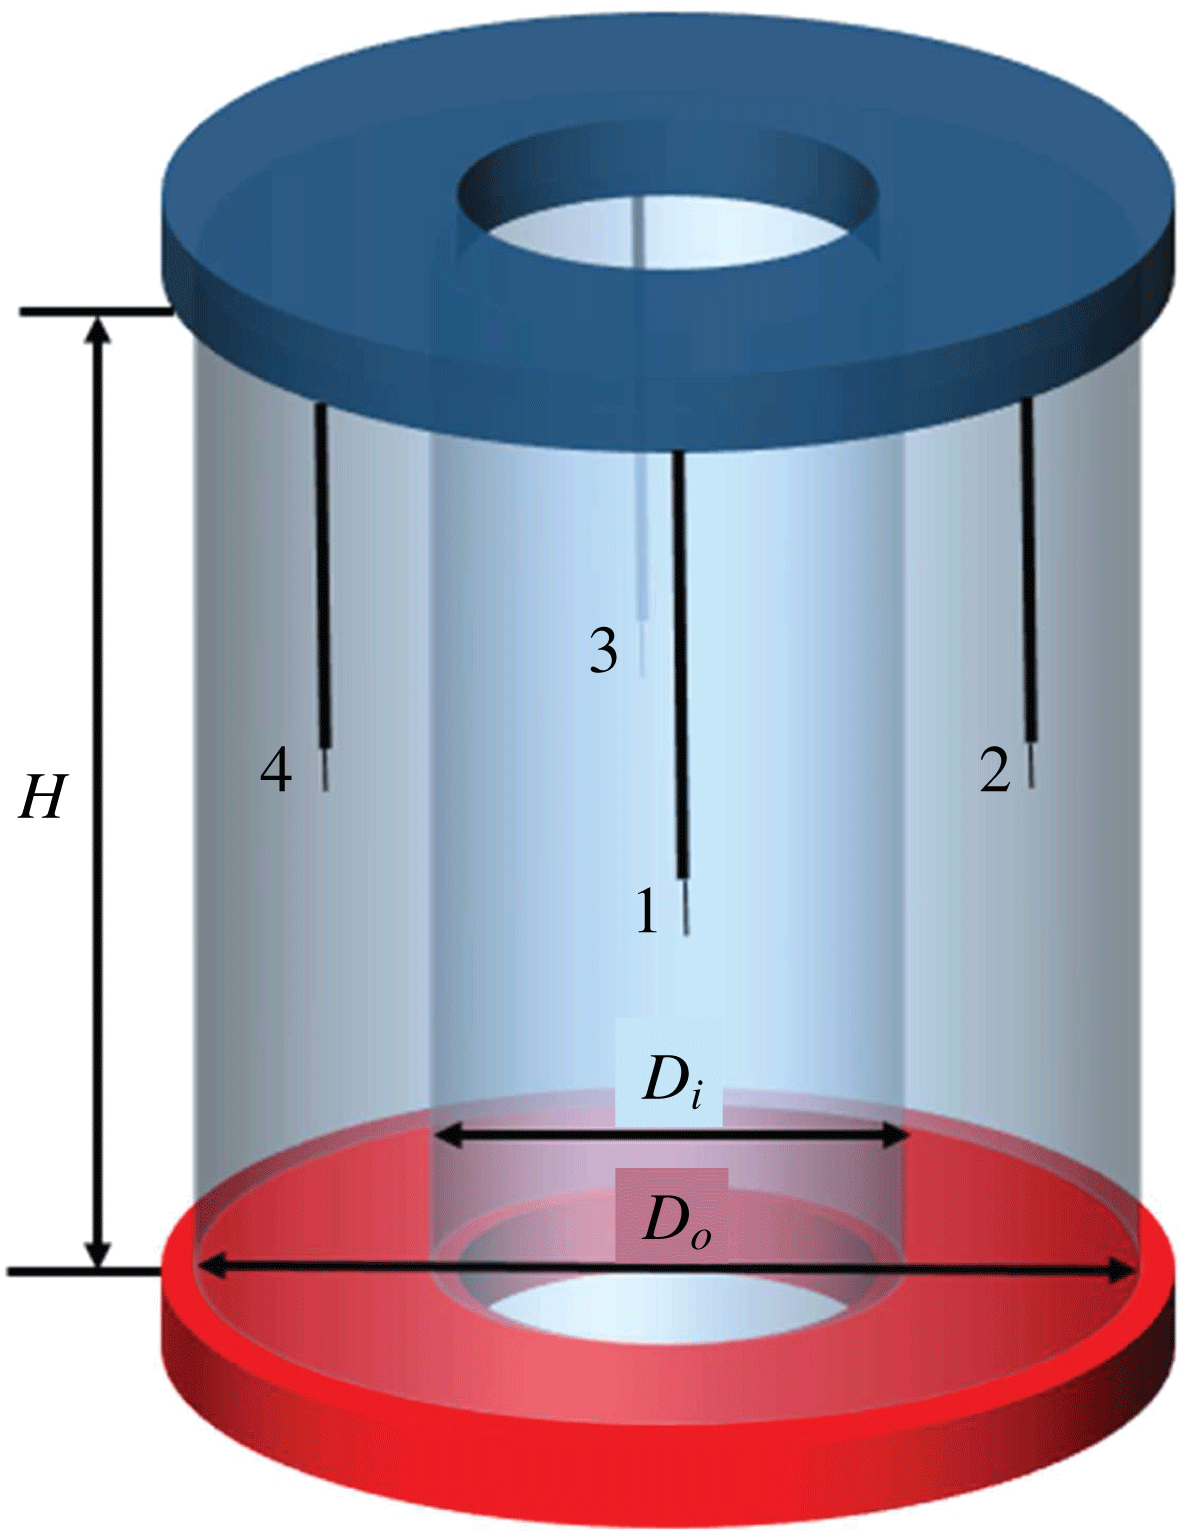
In this paper, we take a different approach to modify the LSC. Instead of using a traditional cylindrical cell, we make a new convection cell which has an annular shape as shown in figure 1. For this geometry, the lack of a cylindrical core will disturb the LSC from directly passing along the upper and lower conducting plates. We note that such a geometry has been previously adopted to investigate the flow instabilities and transitions (Wang et al.
Reference Wang, Wan, Ma and Sun2014). Very recently, Xie, Ding & Xia (Reference Xie, Ding and Xia2018) simultaneously measured the large-scale flow structures and the heat-transfer efficiency in an annular convection cell with a radius ratio
 $\unicode[STIX]{x1D702}=r_{i}/r_{o}=0.88$
in the
 $Ra$
range
 $6.0\times 10^{7}\leqslant Ra\leqslant 1.3\times 10^{9}$
, where
 $r_{i}$
and
 $r_{o}$
are the radii of the inner and outer cylinders of the annular cell. They observed that due to a spontaneous symmetry-breaking bifurcation, the system experiences a flow topology transition for the LSC from a high heat-transfer efficiency quadrupole state to a less symmetric dipole state with a lower heat-transfer efficiency. Due to the large radius ratio of their annular cell, the observed bifurcation may be attributed to the strong confinement effects (Huang et al.
Reference Huang, Kaczorowski, Ni and Xia2013) from the inner and outer cylinder sidewalls. Indeed, for our present annular configuration with a relative small radius ratio (
 $\unicode[STIX]{x1D702}\simeq 0.5$
), the geometrical confinement effect is not so pronounced, and thus such a kind of flow transition was not observed.
The remainder of this paper is organized as follows. We first give a detailed description of the experimental apparatus and methods in § 2. Section 3 presents key results of the global and local measurements, as well as a flow visualization. Results obtained in the present annular cell are compared with those obtained in the traditional cylindrical cells. Finally, the work is summarized in § 4.
2 Experimental apparatus and methods
Our experiments were carried out in an annular convection cell, which is sketched in figure 1. The sidewalls of the annular cell consist of two upright coaxial Plexiglas cylinders. The inner diameter of the outer cylinder is
 $D_{o}=39.9~\text{cm}$
and the outer diameter of the inner cylinder is
 $D_{i}=19.9~\text{cm}$
. Both cylinders have an equal height
 $H=39.7~\text{cm}$
and wall thickness of 5 mm. Thus, the corresponding aspect ratio is
 $\unicode[STIX]{x1D6E4}=D_{o}/H\simeq 1$
and the radius ratio is
 $\unicode[STIX]{x1D702}=D_{i}/D_{o}\simeq 0.5$
. Degassed water is chosen to be the working fluid, with a mean temperature of
 $40\,^{\circ }\text{C}$
, resulting in Prandtl number
 $Pr=4.3$
. During the measurements, the temperature difference
 $\unicode[STIX]{x1D6E5}$
across the fluid layer was changed between
 $1.8\,^{\circ }\text{C}$
and
 $19.6\,^{\circ }\text{C}$
, leading to the Rayleigh number range
 $4.2\times 10^{9}\leqslant Ra\leqslant 4.5\times 10^{10}$
, and we note that the Boussinesq conditions can be roughly satisfied for such a temperature range (Funfschilling et al.
Reference Funfschilling, Brown, Nikolaenko and Ahlers2005).
Schematic diagram of the annular convection cell adopted in the experiment. Four temperature probes 1, 2, 3, 4, are used to monitor the bulk temperature. During the measurements, we tilted the cell by
 $1.2^{\circ }$
at position 4 to lock the orientation of the LSC.

The upper and lower plates are made of pure copper. To avoid oxidation by water, a thin nickel layer is electroplated on the fluid-contact surfaces of both plates. The thickness of the upper plate is 2.5 cm. A water chamber (not shown), consisting of four parallel circular channels of 1.5 cm in both width and depth, is constructed with the upper plate and an attached Plexiglas plate of 2 cm in thickness. To cool the upper plate, temperature-controlled circulating water from a thermal bath with a temperature stability of 0.01 K (Polyscience AD15R-40-A12Y) is pumped through the chamber. To keep the temperature of the upper plate uniform, the circulating water in adjacent channels always flows in opposite directions. The lower plate has a thickness of 1.5 cm and is heated by four Kapton film heaters of equal area. These heaters, each in the shape of a sector with inner radius 20 cm and outer radius 40 cm, are parallel connected to a DC power supply with a
 $99.99\,\%$
long-term stability (SGI 330X15D). Four silicone O-rings are placed between the cylinder sidewalls and the conducting plates to prevent fluid leakage. The upper and lower plates are held together by sixteen stainless steel rods (not shown). To ensure excellent thermal isolation from the surrounding environment, electrical heating jackets are placed around the outside of the outer cylinder and the inside of the inner cylinder, and several layers of Styrofoam are used to fill the space between the heating jackets and sidewalls. The temperature of the heating jackets was kept at
 $40\,^{\circ }\text{C}$
during the measurements, which is the same as the mean temperature of the working fluid. This setup ensures the system has a temperature stability better than
 $0.05\,^{\circ }\text{C}$
.
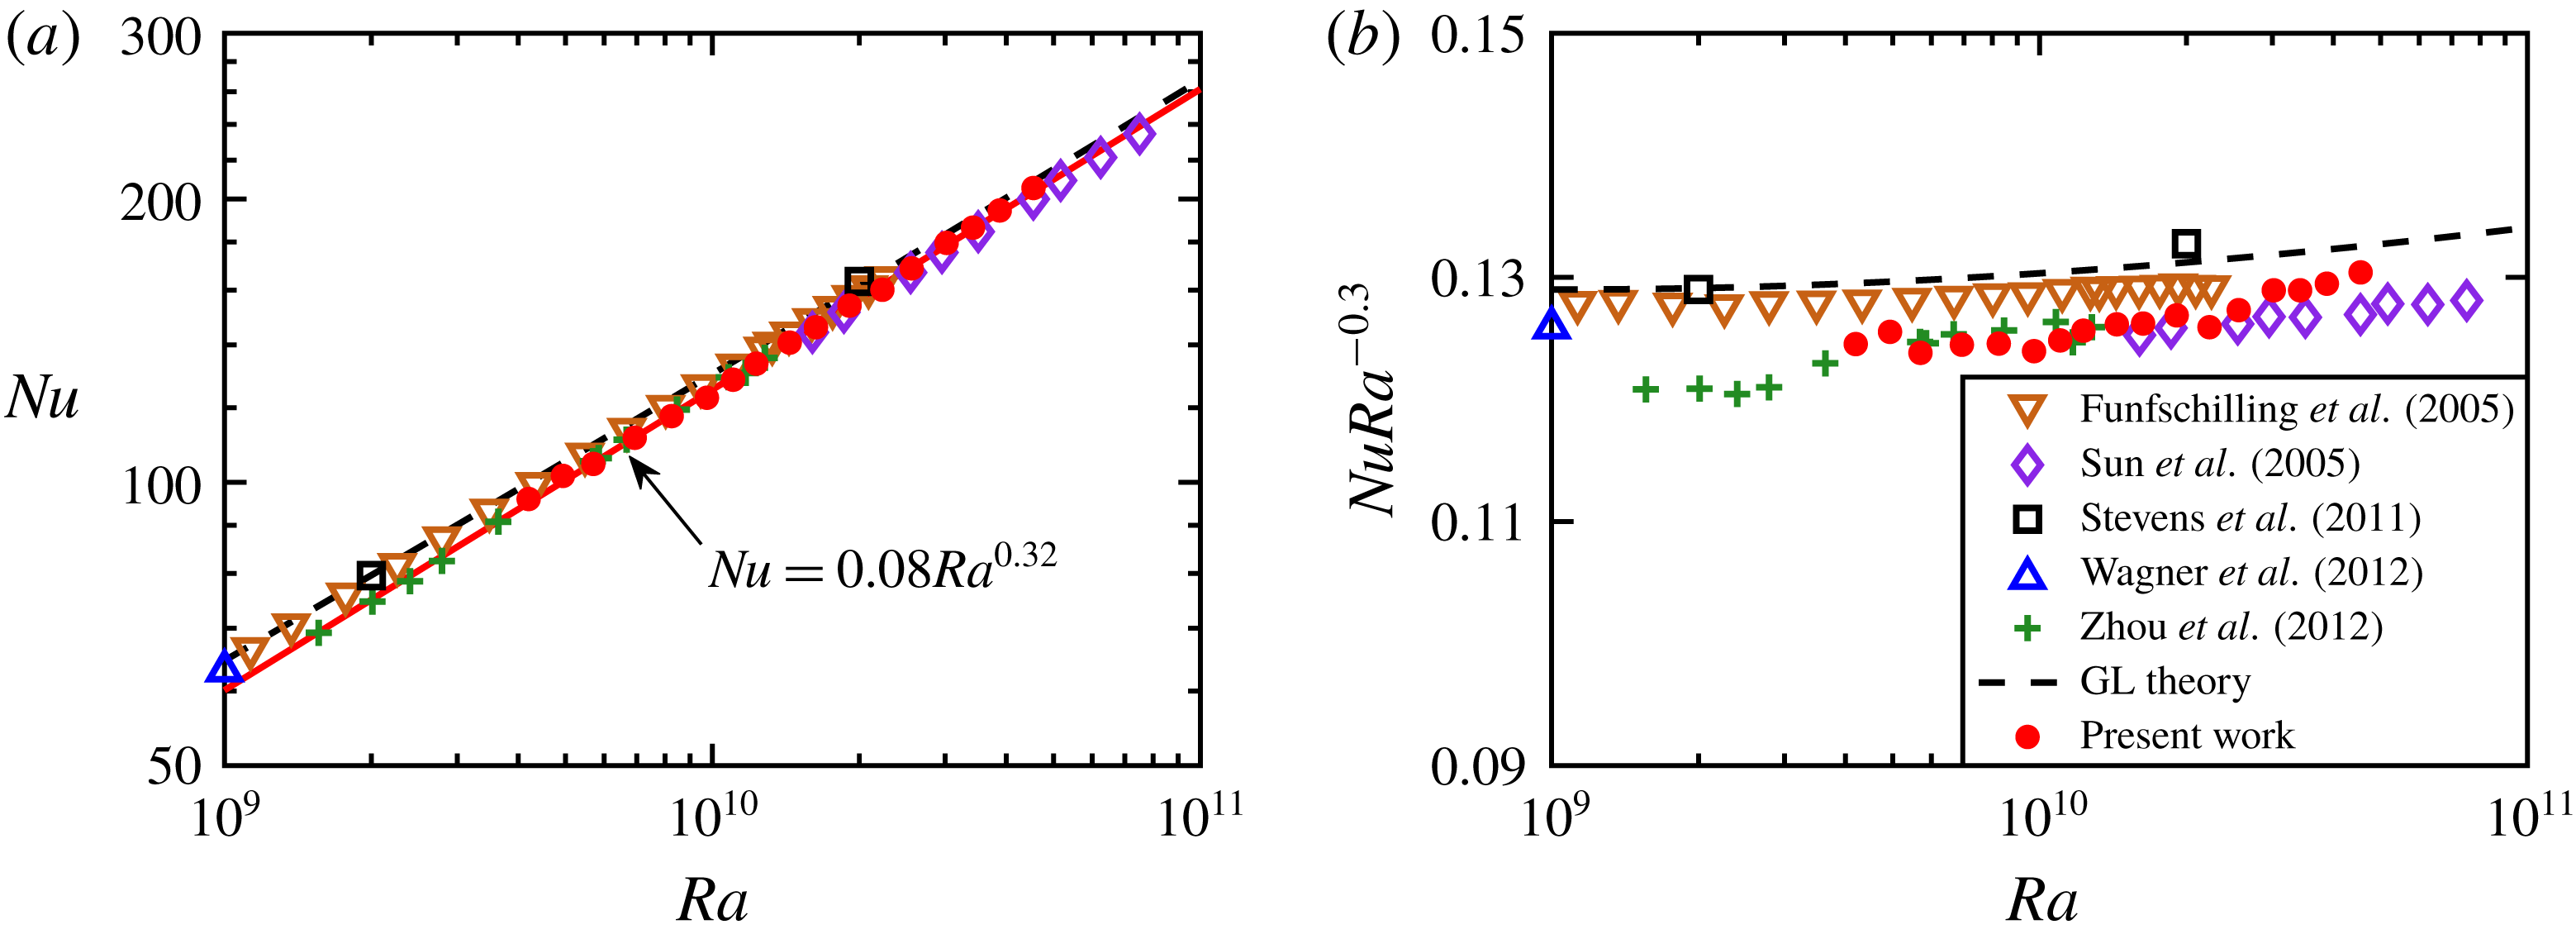
(a) Measured
 $Nu$
as a function of
 $Ra$
. Experimental data: our data of the annular cell (solid circles), Funfschilling et al. (Reference Funfschilling, Brown, Nikolaenko and Ahlers2005) (cylindrical cells of
 $\unicode[STIX]{x1D6E4}=1$
and
 $Pr=4.38$
, down triangles), Sun et al. (Reference Sun, Ren, Song and Xia2005) (cylindrical cells of
 $\unicode[STIX]{x1D6E4}=2$
and
 $Pr=4$
, diamonds), and Zhou et al. (Reference Zhou, Liu, Li and Zhong2012) (rectangular cells of
 $\unicode[STIX]{x1D6E4}=2$
and
 $Pr=5.3$
, pluses). Numerical data: Stevens, Lohse & Verzicco (Reference Stevens, Lohse and Verzicco2011b
) (cylindrical cells of
 $\unicode[STIX]{x1D6E4}=0.5$
and
 $Pr=0.7$
, squares), Wagner, Shishkina & Wagner (Reference Wagner, Shishkina and Wagner2012) (cylindrical cells of
 $\unicode[STIX]{x1D6E4}=1$
and
 $Pr=0.786$
, up triangles). GL theory: Stevens et al. (Reference Stevens, van der Poel, Grossmann and Lohse2013) (the dashed line). The red line gives the best power-law fit to our data,
 $Nu=0.08Ra^{0.32}$
. (b) Compensated
 $NuRa^{-0.3}$
for the same data sets.

The temperatures of the upper and lower conducting plates are measured by 16 thermistors (Model 44032, Omega) of diameter 2 mm (eight in each plate). These thermistors are embedded in the upper and lower plates, respectively, at
 $3D_{o}/8$
from the plate centre and approximately 4 mm away from the fluid-contact surface. Local temperatures in the fluid are measured by four thermistors (GAG22K7MCD419, Measurement Specialties) of diameter
 $400~\unicode[STIX]{x03BC}\text{m}$
. As shown in figure 1, these thermistors are threaded through stainless steel capillary tubing with an inner diameter of 1 mm, and are placed at the mid-height of the cell. They have an equal azimuthal separation and an equal distance from the outer and inner sidewalls. The thermistors are labelled as 1, 2, 3, 4, which also represent their azimuthal positions. The orientation of the LSC may have some azimuthal movement over time (Funfschilling & Ahlers Reference Funfschilling and Ahlers2004; Xi et al.
Reference Xi, Zhou and Xia2006). To restrain the azimuthal motion of the LSC, we tilted the annular cell by
 $1.2^{\circ }$
at position 4. The temperatures of the 16 large thermistors and 4 small thermistors are recorded sequentially by a
 $6\frac{1}{2}$
-digit multimeter at a sampling frequency of
 ${\sim}$
0.75 Hz. During the measurements, it took at least 8 hours for the convection system to reach the steady state, and a typical measurement for each
 $Ra$
lasted over 10 hours. In the present study, finite plate conductivity corrections (Verzicco Reference Verzicco2004) were not performed, but we find that this will not change our main conclusions.
3 Results and discussion
We first examine the effects of the annular geometry on the global heat-transfer efficiency of the system. Figure 2(a) shows the measured Nusselt number
 $Nu$
as a function of the Rayleigh number
 $Ra$
(solid red circles). The
 $Nu$
–
 $Ra$
data can be described well by an effective power law
 $Nu=0.08Ra^{0.32\pm 0.01}$
, as shown by the solid line in the figure. There have been a large number of experimental and numerical studies focusing on the
 $Ra$
-dependence of
 $Nu$
for various convecting fluids and cell geometries (Ahlers et al.
Reference Ahlers, Grossmann and Lohse2009; Chilla & Schumacher Reference Chilla and Schumacher2012). For comparison, we also plot in figure 2 some earlier experimental (Funfschilling et al.
Reference Funfschilling, Brown, Nikolaenko and Ahlers2005; Sun et al.
Reference Sun, Ren, Song and Xia2005; Zhou et al.
Reference Zhou, Liu, Li and Zhong2012) and numerical (Stevens et al.
Reference Stevens, Lohse and Verzicco2011b
; Wagner et al.
Reference Wagner, Shishkina and Wagner2012) results, as well as the prediction of the Grossmann–Lohse (GL) theory (Stevens et al.
Reference Stevens, van der Poel, Grossmann and Lohse2013). It is seen that our present data collapse well on top of other data sets. This agreement, which is particularly evident from the compensated Nusselt number
 $NuRa^{-0.3}$
plotted in figure 2(b), demonstrates that the
 $Ra$
-dependence of
 $Nu$
is insensitive to the change of cell geometry. Note that the scaling exponent in figure 2 is also consistent with those measured in two-dimensional numerical convection (Huang & Zhou Reference Huang and Zhou2013; van der Poel, Stevens & Lohse Reference van der Poel, Stevens and Lohse2013; Zhang, Zhou & Sun Reference Zhang, Zhou and Sun2017; Zhang et al.
Reference Zhang, Sun, Bao and Zhou2018). The present
 $Ra$
range is still in the classical regime of turbulent RB convection (Ahlers et al.
Reference Ahlers, Grossmann and Lohse2009) where the global heat-transfer efficiency is mainly dominated by thermal boundary layers. Thus, such an agreement in figure 2 further implies that the boundary-layer dynamics remains almost unchanged for the annular geometry.
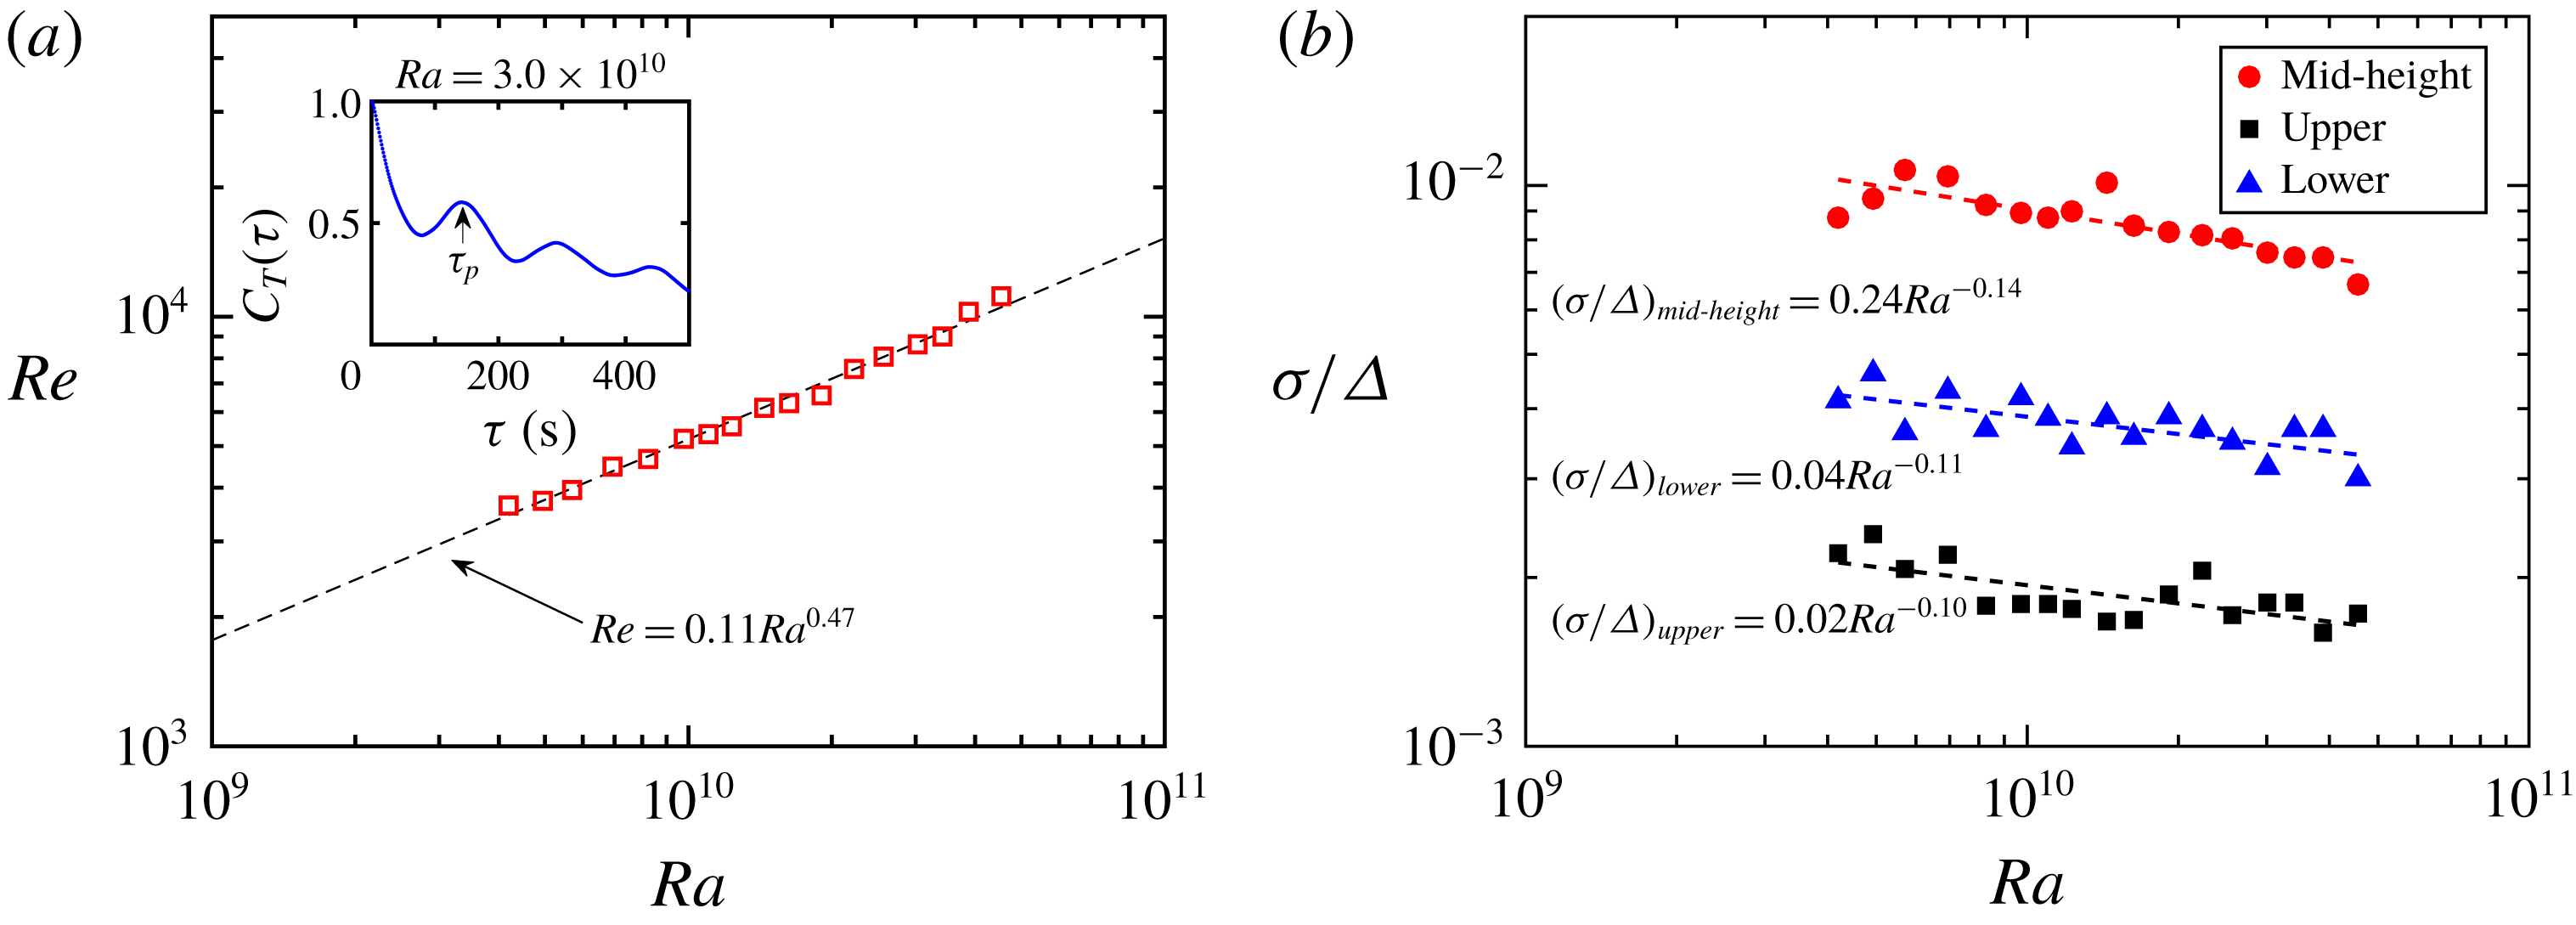
(a) Plume-based Reynolds number
 $Re$
as a function of
 $Ra$
. The dashed line represents the best power-law fit to the data,
 $Re=0.11Ra^{0.47}$
. Inset: Temperature autocorrelation function
 $C_{T}(\unicode[STIX]{x1D70F})$
of a single thermistor mounted on the lower conducting plate at azimuthal position 4 where hot plumes are emitted. The data were measured at
 $Ra=3.0\times 10^{10}$
. (b) The temperature standard deviation
 $\unicode[STIX]{x1D70E}$
normalized by the global temperature difference
 $\unicode[STIX]{x1D6E5}$
as a function of
 $Ra$
, measured by the small thermistors at the mid-height of the cell (circles) and the large thermistors mounted on the upper (squares) and lower (triangles) conducting plates. The dashed lines are the power-law fits to the corresponding data:
 $\unicode[STIX]{x1D70E}/\unicode[STIX]{x1D6E5}=0.24Ra^{-0.14}$
(mid-height),
 $\unicode[STIX]{x1D70E}/\unicode[STIX]{x1D6E5}=0.04Ra^{-0.11}$
(lower) and
 $\unicode[STIX]{x1D70E}/\unicode[STIX]{x1D6E5}=0.02Ra^{-0.10}$
(upper).

In spite of the lack of the cylindrical core for the annular geometry, as we shall see below, a flow visualization study and local temperature measurements both show that there also exists a LSC in the system. As the largest flow structure, the velocity of the LSC can be used to define the Reynolds number of the system. An important issue in the study of turbulent convection is to reveal the
 $Ra$
-dependence of
 $Re$
, as it reflects the underlying driving mechanism and energy budget (Grossmann & Lohse Reference Grossmann and Lohse2002). Experimentally, the circulation turnover time of the LSC is often adopted to obtain
 $Re$
. As the LSC is, in essence, a coherent motion of thermal plumes, the plume turnover time
 $\unicode[STIX]{x1D70F}_{p}$
is usually used to identify the LSC turnover time (Sun & Xia Reference Sun and Xia2005; Brown, Funfschilling & Ahlers Reference Brown, Funfschilling and Ahlers2007). In our present configuration, a well-defined oscillation can be observed for the autocorrelation functions
 $C_{T}(\unicode[STIX]{x1D70F})$
of the temperature
 $T(t)$
, measured by the large thermistors embedded in the upper and lower plates at the azimuthal positions 1 and 4 where cold/hot plumes are emitted from or impact on the conducting plates. In the inset of figure 3(a), we plot a sample
 $C_{T}(\unicode[STIX]{x1D70F})$
curve obtained at
 $Ra=3.0\times 10^{10}$
. It is seen that
 $C_{T}(\unicode[STIX]{x1D70F})$
has a peak centred at the origin and a second smaller peak at a later time which is identified with one turnover time
 $\unicode[STIX]{x1D70F}_{p}$
of thermal plumes. The corresponding Reynolds number is hence defined as
 $Re=(2+\unicode[STIX]{x03C0})L^{2}/\unicode[STIX]{x1D70F}_{p}\unicode[STIX]{x1D708}$
, where
 $(2+\unicode[STIX]{x03C0})L$
is chosen to be the circulation path length of the LSC in the annular cell (see figure 4 for the circulation path of the mean wind in our present configuration), and
 $\unicode[STIX]{x1D70F}_{p}$
is obtained by averaging over data for the embedded thermistors at the azimuthal positions 1 and 4 in both the conducting plates. The plume-based
 $Re$
calculated from the measured
 $\unicode[STIX]{x1D70F}_{p}$
is plotted as a function of
 $Ra$
in figure 3(a). Again, the
 $Re$
–
 $Ra$
data can be described well by an effective power law
 $Re=0.11Ra^{0.47\pm 0.02}$
, as shown by the dashed line in the figure. We note that this exponent is slightly smaller than the value 0.5 of a free-fall velocity, and the deviation may originate from the evolution in the circulation path of the LSC, as indicated by Niemela & Sreenivasan (Reference Niemela and Sreenivasan2003) and Sun & Xia (Reference Sun and Xia2005). We further note that the present exponent in the annular cell is in general agreement with those found in cylindrical cells of water (Qiu & Tong Reference Qiu and Tong2002) and helium (Chavanne et al.
Reference Chavanne, Chilla, Chabaud, Castaing and Hebral2001). This agreement illustrates that the scaling behaviour of
 $Re(Ra)$
remains almost the same under different cell geometries, and thus the driving mechanism of the convective flows is insensitive to the boundary effect of the container.
To see how the annular geometry affects the statistical properties of the temperature fluctuations, we examine in figure 3(b) the
 $Ra$
-dependence of the normalized temperature standard deviations,
 $\unicode[STIX]{x1D70E}/\unicode[STIX]{x1D6E5}$
, for data measured at the mid-height of the cell and inside the plates. Here,
 $\unicode[STIX]{x1D70E}$
is obtained by first calculating measurements from each thermistor and then spatially averaging over data for all embedded thermistors in the respective plates. The lower plate result (triangles) has a larger magnitude than the upper plate (squares), which is presumably because different temperature boundary conditions are applied to the two plates, i.e. constant heating power is supplied to the lower plate while the upper plate’s temperature is regulated by a refrigerated circulator. The dashed lines in the figure are the power-law fits to the corresponding data:
 $\unicode[STIX]{x1D70E}/\unicode[STIX]{x1D6E5}=0.24Ra^{-0.14\pm 0.03}$
(mid-height),
 $\unicode[STIX]{x1D70E}/\unicode[STIX]{x1D6E5}=0.04Ra^{-0.11\pm 0.03}$
(lower) and
 $\unicode[STIX]{x1D70E}/\unicode[STIX]{x1D6E5}=0.02Ra^{-0.10\pm 0.03}$
(upper). One sees that within our experimental uncertainties the three data sets essentially yield similar scaling exponents, suggesting that the temperature fluctuations in the bulk fluid and inside the plates are governed by the same local temperature scale. As the thermistors mounted on the plates are more sensitive to the ejections/impacts of thermal plumes, such a temperature scale may be related to the contributions from thermal plumes. Moreover, the mid-height exponent
 $-0.14\pm 0.03$
is consistent with previous experimental results obtained in cylindrical cells (Daya & Ecke Reference Daya and Ecke2001; Sun & Xia Reference Sun and Xia2007), and also agrees well with the theoretical predictions of the mixing-zone model (Castaing et al.
Reference Castaing, Gnuaratne, Heslot, Kadanoff, Libchaber, Thomae, Wu, Zaleski and Zanetti1989) and the GL theory (Grossmann & Lohse Reference Grossmann and Lohse2004). This agreement indicates that the scaling behaviours of the local temperature fluctuations in the annular cell remain approximately the same as those in the cylindrical cell; they are also insensitive to the change of cell geometry.
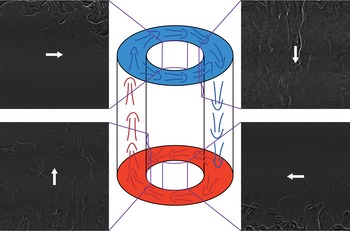
A schematic and four shadowgraph images showing the LSC and the spatial distribution of thermal plumes at
 $Ra=4.5\times 10^{10}$
. The purple frames mark the visualization windows at different positions of the annular cell, and the arrows represent the direction of the LSC. The corresponding supplementary movie is available at https://doi.org/10.1017/jfm.2019.246.

We next turn to the large-scale flow structures in our present apparatus. A standard shadowgraph method (Sun & Zhou Reference Sun and Zhou2014) is adopted to visualize the flow fields at different locations of the annular cell; the corresponding shadowgraph images are shown in figure 4. The purple frames in the figure mark the visualization windows and the arrows represent the direction of the LSC. The images show that thermal plumes organize themselves with the ascending hot plumes on the left and the descending cold plumes on the right. Near the upper plate, the mean flow moves from left to right along the two circular branches, while it moves from right to left close to the lower plate. A schematic of such a large-scale flow structure in the annular cell is illustrated in figure 4.
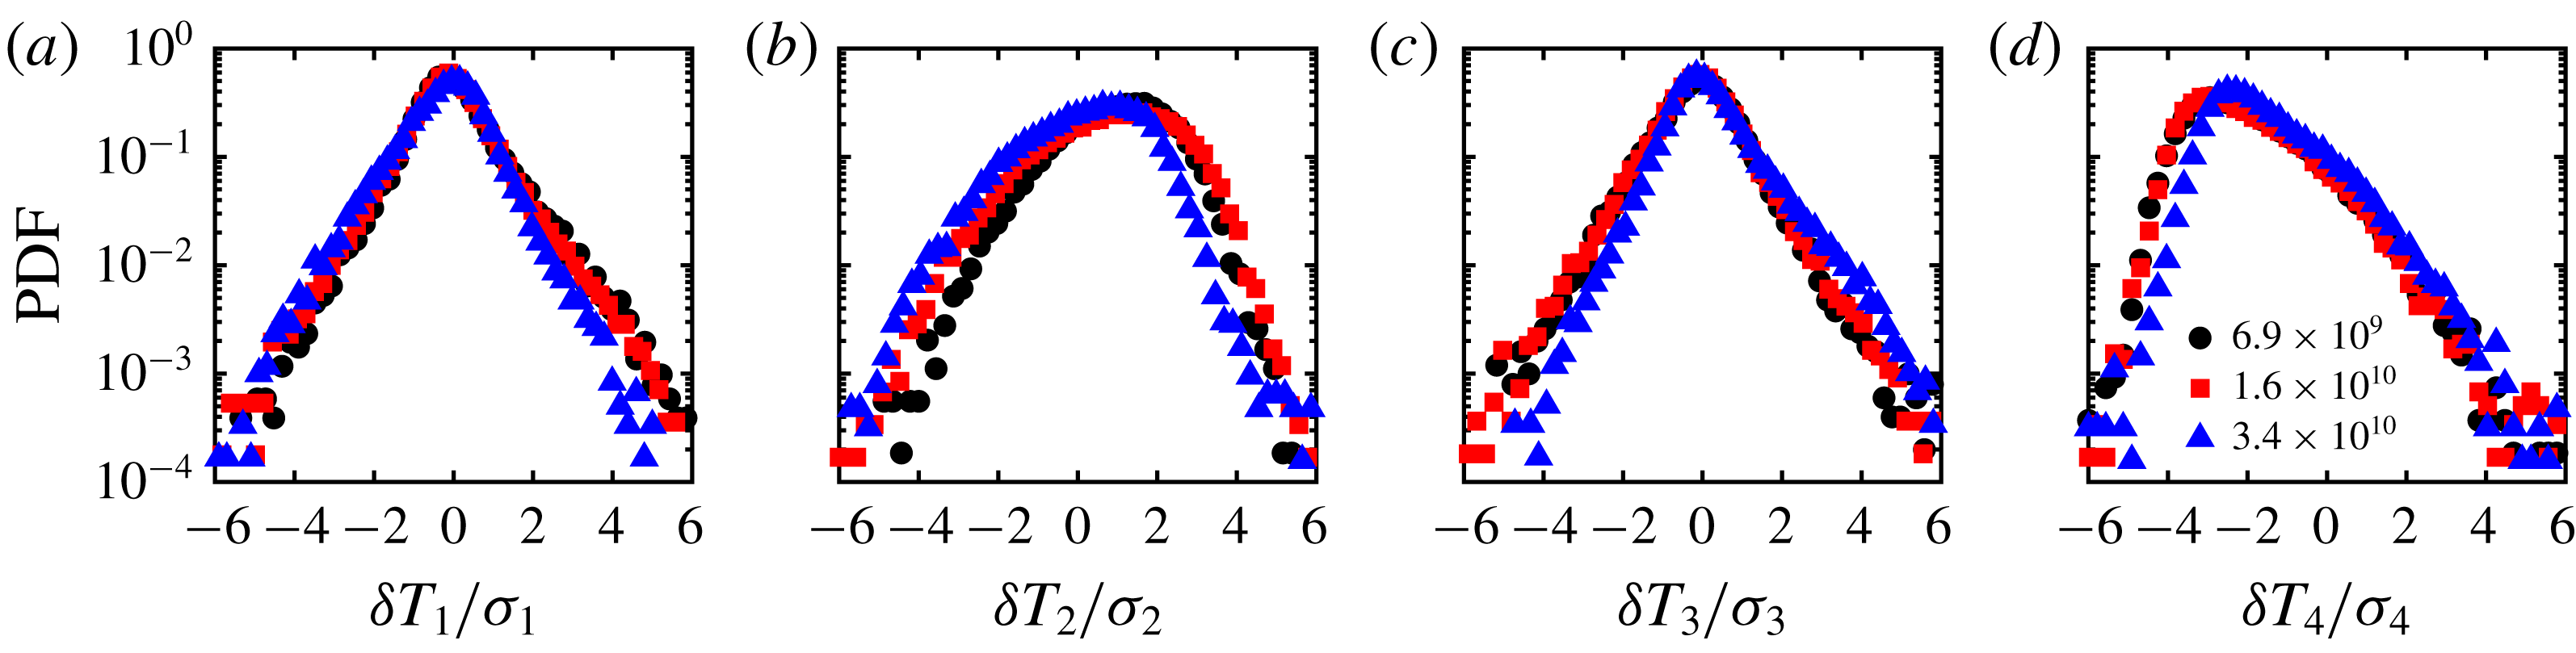
Such a LSC can also be revealed by the local temperature measurements. Figure 5 plots the probability density functions (PDFs) of the normalized temperature fluctuations
 $\unicode[STIX]{x1D6FF}T_{i}(t)/\unicode[STIX]{x1D70E}_{i}$
(
 $i=1,2,3,4$
) measured by the four small thermistors at the mid-height of the cell for three different
 $Ra$
, where
 $\unicode[STIX]{x1D6FF}T_{i}(t)=T_{i}(t)-\langle T_{i}(t)\rangle$
, with
 $\langle \cdots \rangle$
denoting the time average and
 $\unicode[STIX]{x1D70E}_{i}$
the standard deviation of
 $T_{i}(t)$
. One sees that the temperatures measured at different positions show quite different signatures. The temperatures at position 2 are skewed to low temperature and those at position 4 are skewed towards high temperature. The asymmetry of these PDFs originates from the rising hot or falling cold plumes, which is consistent with the coherent motions of plumes revealed in figure 4. On the other hand, the PDFs at positions 1 and 3 are more symmetric relative to the zero mean, and have exponential-like tails. These are very similar to those found at the centre of the cylindrical cell (Castaing et al.
Reference Castaing, Gnuaratne, Heslot, Kadanoff, Libchaber, Thomae, Wu, Zaleski and Zanetti1989; Du & Tong Reference Du and Tong2001) and the rectangular cell (Zhou & Xia Reference Zhou and Xia2013), implying that thermal plumes rarely appear at these positions and there is no dominant flow in these regions.
PDFs of the temperature fluctuations
 $\unicode[STIX]{x1D6FF}T_{i}(t)$
normalized by their respective standard deviations
 $\unicode[STIX]{x1D70E}_{i}$
measured by the small thermistors (
 $i=1,2,3,4$
) at the mid-height of the annular cell for
 $Ra=6.9\times 10^{9}$
(circles),
 $1.6\times 10^{10}$
(squares) and
 $3.4\times 10^{10}$
(triangles).

4 Conclusions
To summarize, we have experimentally performed a systematic investigation of turbulent RB convection using water in an annular cell with a radius ratio
 $\unicode[STIX]{x1D702}\simeq 0.5$
and a Prandtl number
 $Pr=4.3$
over the Rayleigh number range
 $4.2\times 10^{9}\leqslant Ra\leqslant 4.5\times 10^{10}$
. The scaling behaviours of the measured Nusselt number
 $Nu(Ra)$
, the Reynolds number
 $Re(Ra)$
, and the temperature fluctuations are all found to be insensitive to the boundary effects of the container, i.e. both the global and local properties remain almost unchanged for the annular geometry. In spite of the lack of the cylindrical core for the annular geometry, both the visualization study and local temperature measurements show that there also exists a large-scale flow structure in the system: the hot plumes move upwards along one side of the annular cell and the cold plumes move downwards along the opposite side. Near the upper and lower plates, the mean flow moves along the two circular branches.
Recently, Xie et al. (Reference Xie, Ding and Xia2018) reported for the first time a global bifurcation induced by spontaneous symmetry-breaking of the mean flow in annular RB convection. However, such a bifurcation was not observed in the present study, e.g. the transition in the
 $Nu$
–
 $Ra$
relation, as reported by Xie et al. (Reference Xie, Ding and Xia2018), was absent in our data. Of course, the parameter range studied by Xie et al. (Reference Xie, Ding and Xia2018) and the present work differ, i.e. our Rayleigh number range is approximately one order of magnitude larger than that used by Xie et al. (Reference Xie, Ding and Xia2018), and the cell geometry, especially the radius ratio of the annular cell, also differs. These observations suggest that the flow dynamics in turbulent convection in an annular geometry has a strong dependence on the cell geometry and the working range of
 $Ra$
. Therefore, more work needs to be done to fully understand turbulent convection in an annular geometry.
Note that the annular cell was tilted during our measurements. It is well appreciated for the cylindrical cell that cell tilting affects both the structure and dynamics of the LSC significantly (see, for example, Chillà et al.
Reference Chillà, Rastello, Chaumat and Castaing2004). To reveal the tilting effects here, we also carried out measurements in a levelled annular cell for a limited range of
 $Ra$
, and our preliminary results reveal that the difference in
 $Nu$
due to cell tilting is less than
 $1\,\%$
and cell tilting does not change the structures of the LSC. By using the multithermal-probe method (Brown et al.
Reference Brown, Nikolaenko and Ahlers2005; Xi & Xia Reference Xi and Xia2007), however, the azimuthal motion of the LSC is found to be different from the ones observed in the LSC dynamics of cylindrical cells, i.e. the orientation of the LSC oscillates in a narrow azimuthal angle range, and no cessations and reversals were detected. In addition, the net rotation of the LSC, as observed by Brown et al. (Reference Brown, Nikolaenko and Ahlers2005) and Xi et al. (Reference Xi, Zhou and Xia2006) in a cylindrical cell, is also absent in the annular cell. These results further confirm that the dynamics of the LSC is sensitive to the geometrical effects of the container. In our future study, we will focus on the LSC dynamics of the annular convection cell in greater detail.
Acknowledgements
This work was supported by the Natural Science Foundation of China under grant nos. 11572185, 11732010, 11825204 and 91852202, the Key Research Projects of Shanghai Science and Technology Commission under grant no. 18010500500, and the Program of Shanghai Academic Research Leader under grant no. 19XD1421400.
Supplementary movies
Supplementary movies are available at https://doi.org/10.1017/jfm.2019.246.