Introduction
Rove beetles (Coleoptera: Staphylinidae) are recognised as important components of agroecosystems worldwide and are mostly known for their mitigation of agricultural yield loss by predation of diverse pest arthropods, such as spider mites in Japan (Kishimoto and Adachi Reference Kishimoto and Adachi2008), cereal aphids in central Europe (Dennis and Wratten Reference Dennis and Wratten1991), horn flies in Florida (Hu and Frank Reference Hu and Frank1995), and cabbage maggots in central Canada (Andreassen et al. Reference Andreassen, Kuhlmann, Whistlecraft, Soroka, Mason and Akinremi2010). Most of our knowledge about staphylinids in agroecosystems is based on research in Europe (e.g., Clough et al. Reference Clough, Kruess and Tscharntke2007; Balog et al. Reference Balog, Markó and Szarvas2008), where the rove beetle assemblages are comprised mostly of generalist predators. Agroecosystems, especially annual crop habitats, have been described as unstable, ephemeral habitats that challenge predators with frequent disturbance and unpredictable populations of specific prey species (Wiedenmann and Smith Reference Wiedenmann and Smith1997). At least in Europe, agroecosystem assemblages share several predictable staphylinid species (reviewed by Andersen Reference Andersen1991), apparently possessing attributes that pre-adapt them to these habitats (Wiedenmann and Smith Reference Wiedenmann and Smith1997). In response to annual disturbance of the habitat, such as is caused by tillage and harvesting, some staphylinid species overwinter in unmanaged areas nearby (Holland et al. Reference Holland, Birkett and Southway2009). In addition, most dominant staphylinids in European agroecosystems are univoltine, are most active early in the growing season, and overwinter as adults (e.g., Andersen Reference Andersen1982; Balog and Markó Reference Balog and Markó2007).
There are relatively few studies of rove beetle assemblages in North American agroecosystems compared to other beetle groups, such as the Carabidae (e.g., references in Goulet Reference Goulet2003; Firlej et al. Reference Firlej, Gagnon, Laurin-Lemay and Brodeur2012) and Coccinellidae (e.g., Mignault et al. Reference Mignault, Roy and Brodeur2006). Most previous studies have been limited to partial surveys due to difficulties in identification at the species level (e.g., Levesque and Levesque Reference Levesque and Levesque1996). Levesque and Levesque (Reference Levesque and Levesque1996) is the only study to include detailed phenological information. Habitat use by Staphylinidae has not been studied within the agricultural landscape of North American annual crop systems. Furthermore, even a preliminary comparison of assemblages between different North American agroecosystems is lacking. Fortunately, recent taxonomic research in the difficult subfamily Aleocharinae (e.g., references within Brunke et al. Reference Brunke, Klimaszewski, Dorval, Bourdon, Paiero and Marshall2012) has made complete surveys more tractable in North America: Byers et al. (Reference Byers, Barker, Davidson, Hoebeke and Sanderson2000) characterised the assemblage of dairy cattle pastures; Leslie et al. (Reference Leslie, Hoheisel, Biddinger, Rohr and Fleischer2007) reported dominant species and their affiliation with different crops; and Renkema et al. (Reference Renkema, Lynch, Cutler, Mackenzie and Walde2012) demonstrated species-level responses to mulching in high bush blueberries.
To improve understanding of rove beetle agroecology in North America, a species-level investigation was conducted in the soybean agroecosystem, an important annual crop in northeastern United States of America and Canada (Ontario Ministry of Agriculture, Food and Rural Affairs 2011), to elucidate the composition and diversity of the assemblage, the seasonal activity of its common species, and their use of non-crop habitat (i.e., hedgerows) outside of the growing season. Finally, the available literature on staphylinids in northeastern North American agroecosystems was reviewed to elucidate whether some species are dominant in assemblages under a broad range of human-influenced conditions.
Materials and methods
Study sites
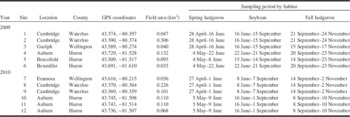
Twelve sites (six in each year), each consisting of a soybean field and corresponding hedgerow, were selected for study in southern Ontario, Canada in 2009 and 2010 (Table 1). Sites were selected equally from two different regions of southern Ontario (i.e., Wellington-Waterloo centrally, and Huron county to the west), to reduce potential effects of localised species pools. All fields were operational soybean fields cultivated under agronomic practices determined by each grower. Fields at all sites were not tilled, except site 12, and were planted to corn in the previous year, except site 3, which was planted to soybean. All sites were planted with seed-treated soybean (thiamethoxam+fludioxonil+metalaxyl-M, CruiserMaxx, Syngenta, Guelph, Ontario, Canada). At all sites, soil in hedgerows contained more dry organic matter than that in soybean fields, as determined by the Walkley-Black method (Walkley and Black Reference Walkley and Black1934) (Table A1). Except for site 5, fields were not sprayed with insecticides; herbicides were not used at any site. Site 5 was sprayed once in the week of 27 August 2009 with a broad-spectrum insecticide (λ-cyhalothrin, Matador 120EC, Syngenta, Guelph, Ontario, Canada) to control soybean aphid populations; however, our sampling area and a 5 m buffer were left unsprayed.
Summary of southern Ontario, Canada field site locations and sampling periods.

Note: Sampling periods indicate the first and last dates on which traps were active in each field.
Sampling protocol
Within a given habitat, field sites were sampled for one week, every other week to ameliorate trapping pressure on invertebrates. Sampling in hedgerows began in the last week of April in both years. Spring sampling in hedgerows was continued until ~50% of soybean plants in the adjacent field were at stage V1 (one node on main stem, with fully developed trifoliates; Pederson Reference Pederson2009); soybean sampling began at this time or one week later, (Table 1). Sampling in soybean fields continued until 50% or more plants had begun senescence, characterised by yellowed leaves, which drop from the plant (stage R7, Pedersen Reference Pederson2009). Fall hedgerow sampling was initiated at this time or one week later and continued until canopy traps failed to capture rove beetles for two consecutive sampling dates. Simultaneous sampling of hedgerows and soybean fields was not possible under the logistical constraints of this study, however our sampling protocol allowed for a greater number and variety of field sites than would have otherwise been possible, and was sufficient to address the objective of detecting hedgerow activity of staphylinids outside of the growing season.
Rove beetles were sampled using canopy traps (i.e., raised pan traps) and unfenced pitfall traps, placed in pairs (hereafter as “trap pairs”) successively along a transect. This combination of trap types was selected in order to reduce biases associated with pitfall trapping alone (Lang Reference Lang2000). Both trap types were constructed from clear plastic Polypro Deli Containers (10 cm diameter×7 cm height) (Solo Cup Company, Lake Forest, Illinois, United States of America) that acted as catch basins, filled one-quarter with 50% propylene glycol (Alchem, Alachua, Florida, United States of America). Canopy traps were held on an adjustable support attached to a wooden stake (Fig. 1). Pitfall traps were placed in the soil with the top lip level with or slightly below the soil surface, and protected from weather with a roof made from the container lid and supported by wire pegs ~10 cm above the trap lip. The interface between pitfall trap and soil was actively maintained each sampling period to prevent exposure of the container lip above the soil surface as a result of erosion by rainfall. Canopy traps were held on an adjustable support attached to a wooden stake and were not protected from above as these structures were found to interfere with capture efficacy.
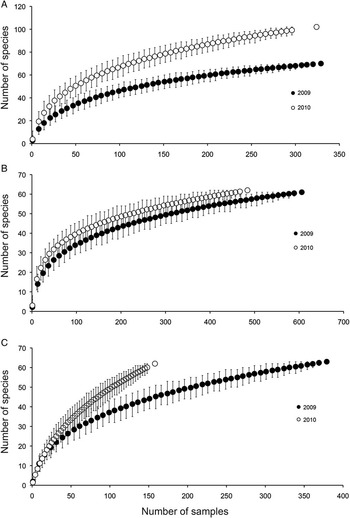
Rarefaction curves for soybean fields and their adjacent hederows sampled for Staphylinidae in 2009 and 2010. Curves result from plotting the number of species predicted by simulation at varied numbers of samples from raw capture data. Curves approaching an asymptote suggest sampling adequately characterises species richness within the sampling area. Rarefaction curves are given by sampling habitat and season: (A) spring hedgerows, (B) summer soybean, and (C) fall hedgerows.

In hedgerows, traps were placed in association with buckthorn shrubs to gain insight into potential interactions with the soybean aphid (Brunke Reference Brunke2011), which uses buckthorn as an overwintering host (Bahlai et al. Reference Bahlai, Welsman, Schaafsma and Sears2007). Traps were placed in a single transect along the hedgerow. Canopy traps were placed among buckthorn branches at ~1 m height, but were never placed higher than the nearest buckthorn plants. A pitfall trap was placed ⩽2 m of its paired canopy trap, under another buckthorn shrub, if possible. Adjacent trap pairs were separated by ⩾5 m, according to the density of buckthorn plants. Fifteen trap pairs (30 traps) were deployed in hedgerows, except at sites 4 (14 pairs) and 5 (10 pairs), where there was insufficient buckthorn.
In each soybean field, 15 trap pairs were arranged in three transects (5, 20, and 35 m from the field edge) to reduce microhabitat effects on assemblage composition. Five trap pairs were placed along each transect, with 5 m between adjacent trap pairs. Canopy traps were adjusted throughout the sampling period so that they were always positioned within the top third of the crop canopy.
Specimen identification and species characterisation
Trap contents were washed gently with water through coarse (425 µm mesh) and fine (180 µm mesh) sieves (Fisher Scientific, Ottawa, Ontario, Canada). Staphylinids were transferred to 70% ethanol and identified by A.J.B., with some exceptions noted below. All aleocharine staphylinids were dissected and sorted on the basis of genitalic characters. Specimens of Aleocharinae were identified by J.K. and some Omaliinae were identified by M. Thayer (Field Museum of Natural History, Chicago, Illinois, United States of America). The unrevised and taxonomically difficult genera Amischa Thompson and Acrotona Thompson were not treated at the species level. Voucher specimens were deposited in the University of Guelph Insect Collection, Guelph, Ontario, Canada. “Common” beetle species were defined as those that comprised ⩾1% of the total number of individuals captured in soybean. As the number of individuals captured in passive traps depends on both their activity and density, their abundance is hereafter referred to as activity density (Saska et al. Reference Saska, van der Werf, de Vries and Westerman2008). The lower limit of 1% was chosen to ensure inclusion of those species that were characteristic of the soybean field assemblage but that may not have been effectively sampled with pitfall and canopy traps, as well as to exclude those species with too few individuals to discern statistically significant patterns. To elucidate general, species-level patterns in seasonality for common staphylinids in soybean assemblages, the total number of individuals captured each sampling date, within sampling year, was standardised by the number of non-compromised traps and plotted. To provide a visualisation of activity density, a Gaussian smoothing curve was generated as a measure of central tendency, with a span of four sequential observations (by day of year). Sampling dates that differed by one day were combined to minimise site effects in the summary figures and to maintain equivalent weights for the smoothing curve. Common species were categorised according to peak seasonal activity, hedgerow inhabitation, feeding preference (literature-based), and microhabitat preference (literature and specimen record-based).
Analyses of species assemblages
Individuals captured, species richness and Shannon’s H index of diversity were calculated and used to compare the staphylinid assemblages of hedgerows and soybean fields. These analyses were performed using EcoSim Professional v. 1.2d (Acquired Intelligence Inc., www.garyentsminger.com/ecosim/index.htm). Rarefied captures, species richness and Shannon diversity indices for native and total staphylinids captured were computed using sample-based rarefaction for spring hedgerows, summer soybean, and fall hedgerows (Buddle et al. Reference Buddle, Beguin, Bolduc, Mercado, Sackett and Selby2005). Individual traps, rather than site totals, were used as the sampling unit to remove bias associated with compromised traps. Each diversity estimation was performed using 1000 iterations and using rarefaction curves as the randomisation algorithm. Diversity measures were rarefied to 150 samples for whole community analyses, and 50 samples for native-species-only analyses, and then season-long rarefied diversity measures, accompanied by their computed standard errors, were compared using analysis of variance followed by means separations using Tukey’s honest significant difference test, with α=0.05.
Results
Assemblage abundance, richness, diversity, and origin
One hundred and fifty-four species of Staphylinidae were captured in southern Ontario, Canada soybean-hedgerow landscapes. A total of 7306 individuals representing 80 species were captured in southern Ontario soybean fields (Table A2). Only 10 species were captured exclusively in soybean fields, with eight of these being singletons or infrequent captures; none were common species. Of the 80 species collected in soybean fields, 36 were non-native and comprised 43.1% of all individuals. A total of 6733 individuals representing 144 species were captured in hedgerows adjacent to soybean fields (Table A3); 75 were unique to hedgerows. Of these 144 species, 50 were non-native and comprised 73.1% of all individuals. Less than half (47%) of the species occurring in hedgerows were also detected in soybean fields.
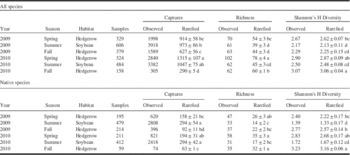
Hedgerows and soybean fields did not significantly differ in the total number of individuals captured (Table 2). Abundance and diversity varied between sites (Kruskal–Wallis test, abundance: H(11)=121.1, P<0.001; diversity: H(11)=186.7, P<0.001), but this variation was not explained by sampling region (Mann–Whitney test, abundance: U=140869, P=0.114; diversity: U=142076, P=0.173), and thus sites were grouped for analysis. Species accumulation curves reached an asymptote in all habitats, seasons, and years, except 2010 sampling of fall hedgerow assemblages (Fig. 1). Relatively few staphylinids were captured in fall hedgerow samples in 2010 and very few traps captured rove beetles (Table 2). Significant and sometimes marked differences in richness and diversity were found between years in hedgerows, but not soybean fields (Table 2). In 2010, the fall and spring assemblages in hedgerows were significantly more species rich and diverse than that of soybean fields during the growing season (Table 2). In 2009, only the spring hedgerow assemblage was significantly more species rich and diverse than the soybean field assemblage, although both spring and fall hedgerow assemblages were numerically more diverse and species rich (Table 2). Patterns in native species richness were similar to those observed in the full community, but native species were consistently, less diverse in soybean fields during the growing season (Table 2). Significantly more individuals of native species were captured in soybean fields during the growing season than hedgerows outside of the growing season in 2009; this was due to relatively high numbers of Strigota obscurata Klimaszewski and Brunke in soybean during that year.
Observed and rarefied estimates of captured individuals, species richness and Shannon’s H diversity index of hedgerow and soybean field staphylinid assemblages, generated from sample-based rarefaction to 150 (all species) or 50 (native species) samples.

Note: Results of analysis of variance for multiple comparisons: all species (captures, F=25, df=5894, P<0.0001; richness, F=23, df=5894, P<0.0001; Shannon’s H, F=13.74, df=5894, P<0.0001) and native species only (captures, F=9.3, df=5294, P<0.0001; richness, F=13.2, df=5294, P<0.0001; Shannon’s H, F=22.2, df=5294, P<0.0001). Within a category and column, means followed by the same letter are not significantly different, Tukey’s honest significant difference, α=0.05.
Common species
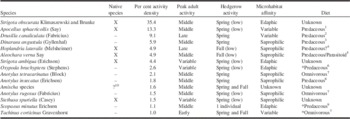
Fifteen species of the soybean field assemblage were considered common (Table 3). The native species Strigota obscurata accounted for more than one-third of all individuals captured. Apocellus sphaericollis (Say), also native, had the second highest activity density but was spatiotemporally localised as nearly all individuals were captured at sites 10–12 (2010 only). Based on information in the literature, approximately half of the common species were non-native (Klimaszewski et al. Reference Klimaszewski, Brunke, Assing, Langor, Newton and Bourdon2013) and most were predaceous, though the diet of some species is unknown or poorly known (Table 3, and references therein).
Percent total and peak activity density, season of highest hedgerow activity, typical microhabitat, and reported diet of common species (⩾1% of total individuals captured) collected in pitfall and canopy traps (pooled) in soybean fields in 2009–2010.
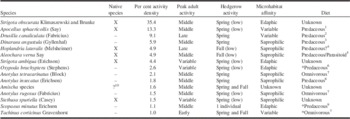
Note: Species with activity density peaks in June, mid June through to late July, and August were categorised as “early”, “middle”, and “late”, respectively. Data on microhabitats are derived from museum specimen records and diet from the literature. Saprophilic species are attracted to rapidly decaying organic matter such as carrion, decaying fungi, compost and/or dung. Edaphic species are rarely attracted to rapid decay and occur at or just below the soil surface.
1, Jo and Smitley (Reference Jo and Smitley2003); 2, Andersen et al. (Reference Andersen, Hansen, Rydland and Oyre1983); 3, Balduf (Reference Balduf1935); 4, Thayer et al. (Reference Thayer, Ashe and Hanley2004); 5, Klimaszewski (Reference Klimaszewski1984); 6, Dennison and Hodkinson (Reference Dennison and Hodkinson1983); 7, Good and Giller (Reference Good and Giller1991), and references therein; 8, Majka and Klimaszewski (Reference Majka and Klimaszewski2008a); 9, Thayer (Reference Thayer2005): all Paederinae are considered to be primarily predaceous; 10, It is unknown which species of this unrevised genus, if any, are native to North America.
* Diet records available only for related species.
Seasonality and habitat use of species common in soybean field assemblages
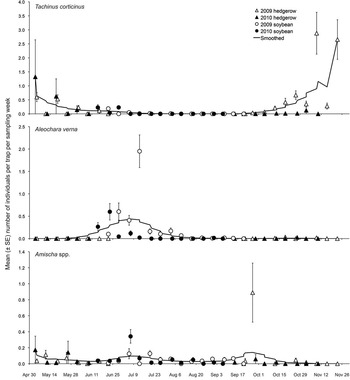
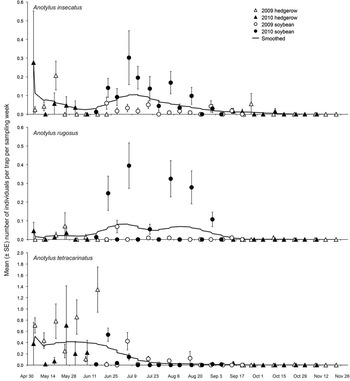
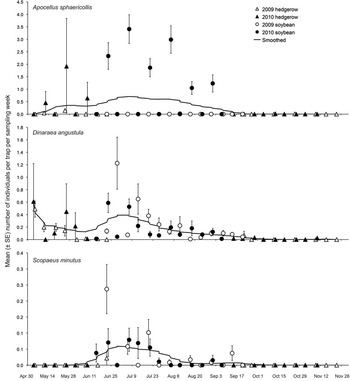
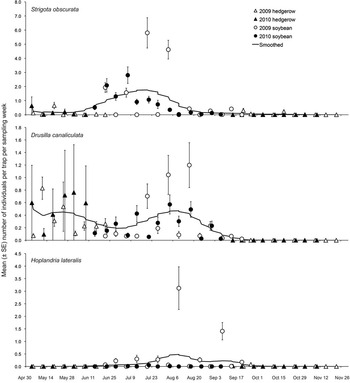
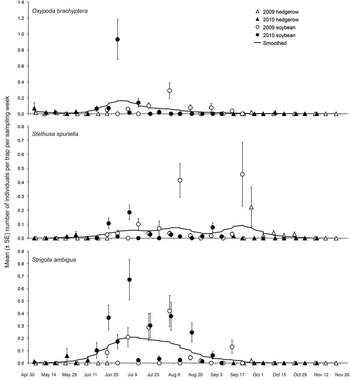
Tachinus corticinus Gravenhorst was restricted to the beginning of the growing season in soybean, with low activity density compared with hedgerows in the spring and fall (Fig. 2). Aleochara verna Say, Amischa species, Anotylus insecatus (Erichson), Anotylus rugosus (Fabricius), Anotylus tetracarinatus (Block), Apocellus sphaericollis, Dinaraea angustula (Gyllenhal), Scopaeus minutus Erichson, and Strigota obscurata, were most active in soybean fields during June and July; activity generally decreased over the soybean growing season, especially after canopy closure occurred in early August (Figs. 2–5). The highest activity densities of Drusilla canaliculata (Fabricius) and Hoplandria lateralis (Melsheimer) in soybean fields were observed later, from mid-July to mid-August, after the soybean canopy had closed (Fig. 5). Activity density of Oxypoda brachyptera (Stephens), Stethusa spuriella (Casey), and Strigota ambigua (Erichson) in soybean fields was greatest during June and July in 2010, and July–August in 2009 (Fig. 6). All species common in soybean assemblages were detected in hedgerows outside of the growing season (Table 3). Substantial spring activity in hedgerows was observed in Amischa species, Anotylus insecatus, Anotylus tetracarinatus, Dinaraea angustula, Drusilla canaliculata, and Tachinus corticinus, such that activity densities were equal to or greater than that observed in soybean fields. In the remaining species, hedgerow activity was observed at only low levels; only one individual of Scopaeus minutus was captured, in hedgerows during the spring. With the exception of Tachinus corticinus and Amischa species, hedgerow activity during the fall was either very low or not detected in the common soybean staphylinids.
Average number of individuals (±SE) of Tachinus corticinus Gravenhorst, Aleochara verna Say, and Amischa species captured per trap on by pitfall and canopy traps in southern Ontario, Canada soybean fields and their adjacent hedgerows in 2009 and 2010. Smoothing lines presented in figure are Gaussian smoothers with a span of four observations, used to visualise trends, and applied to all data points sequentially by ordinal date.

Average number of individuals (±SE) of Anotylus insecatus (Erichson), Anotylus rugosus (Fabricius), and Anotylus tetracarinatus (Block) captured per trap on by pitfall and canopy traps in southern Ontario, Canada soybean fields and their adjacent hedgerows in 2009 and 2010. Smoothing lines presented in figure are Gaussian smoothers with a span of four observations, used to visualise trends, and applied to all data points sequentially by ordinal date.

Average number of individuals (±SE) of Apocellus sphaericollis (Say), Dinaraea angustula (Gyllenhal), and Scopaeus minutus Erichson captured per trap on by pitfall and canopy traps in southern Ontario, Canada soybean fields and their adjacent hedgerows in 2009 and 2010. Smoothing lines presented in figure are Gaussian smoothers with a span of four observations, used to visualise trends, and applied to all data points sequentially by ordinal date.

Average number of individuals (±SE) of Strigota obscurata Klimaszewski and Brunke, Drusilla canaliculata (Fabricius), and Hopandria lateralis (Melsheimer) captured per trap on by pitfall and canopy traps in southern Ontario, Canada soybean fields and their adjacent hedgerows in 2009 and 2010. Smoothing lines presented in figure are Gaussian smoothers with a span of four observations, used to visualise trends, and applied to all data points sequentially by ordinal date.

Average number of individuals (±SE) of Oxypoda brachyptera (Stephens), Stethusa spuriella (Casey), and Strigota ambigua (Erichson) captured per trap on by pitfall and canopy traps in southern Ontario, Canada soybean fields and their adjacent hedgerows in 2009 and 2010. Smoothing lines presented in figure are Gaussian smoothers with a span of four observations, used to visualise trends, and applied to all data points sequentially by ordinal date.

Discussion
Assemblage richness, diversity, and composition
The total number of staphylinid species found in the soybean field-hedgerow landscape (154 species) was similar to a survey of apple (191 species) and pear (121 species) orchards in Hungary (Balog et al. Reference Balog, Markó and Szarvas2008). Comparisons between assemblages of North American staphylinids are limited as the Aleocharinae are rarely identified to species (e.g., Brunke et al. Reference Brunke, Bahlai, Sears and Hallett2009). Dairy pasture assemblages, including aleocharines in the northeastern United States of America (Byers et al. Reference Byers, Barker, Davidson, Hoebeke and Sanderson2000) were comparable in richness (79 species) to that of southern Ontario soybean fields in the present study (80 species). Comparisons are further limited when species richness or diversity are not corrected for differences in sampling effort (Buddle et al. Reference Buddle, Beguin, Bolduc, Mercado, Sackett and Selby2005). Species richness of staphylinids in highbush blueberry fields in Nova Scotia, Canada (Renkema et al. Reference Renkema, Lynch, Cutler, Mackenzie and Walde2012) was consistently lower than that found in the present study for soybean fields or even adjacent hedgerows, though the relative effects of geography versus crop type are difficult to surmise.
Species accumulation curves indicated that our sampling protocol adequately measured the richness and diversity of staphylinid species assemblages in hedgerows and soybean fields (Buddle et al. Reference Buddle, Beguin, Bolduc, Mercado, Sackett and Selby2005). Richness and diversity may have been underestimated in Reference Andreassen, Kuhlmann, Whistlecraft, Soroka, Mason and Akinremi2010 fall hedgerows, as an asymptote was not reached. However, this is of minor importance, as the 2010 fall hedgerow assemblage was shown to be more species rich and diverse than that of soybean in the same year, despite this bias. Species richness and diversity may normally vary greatly between years as habitat-level patterns could only be detected within a given year. Comparisons between the present results and those of the only other study providing rarefied estimates of staphylinid richness and diversity (Renkema et al. Reference Renkema, Lynch, Cutler, Mackenzie and Walde2012) are difficult as data was pooled across years and a different diversity index (i.e., Simpson’s) was used. However, large between-year variation in diversity and richness was also observed in ground beetle assemblages of Canadian soybean fields (Firlej et al. Reference Firlej, Gagnon, Laurin-Lemay and Brodeur2012).
Our study design allowed comparison of the staphylinid assemblages present in available habitats within and outside of the soybean growing season, but we acknowledge that the lack of simultaneous sampling in our study prevents a generalised comparison of hedgerow and soybean habitats per se. Although hedgerows outside of the growing season and soybean fields supported similar numbers of staphylinid individuals (Table 2), the soybean assemblage was generally found to be a subset of the spring and fall hedgerow assemblages (see Results), with lower diversity of native species, and in 2010, all species. This result suggests that fewer than half of the species occurring in the perennial hedgerows, and fewer native species have successfully overcome the challenges of the annual soybean agroecosystem, which could include the yearly disturbance of the soil and low habitat heterogeneity. Of the common staphylinid species present in this study, roughly half were non-native. A literature survey of the common species reported from other northeastern agroecosystems (Table 4) revealed that, while non-native species consistently form a significant component of assemblages, native species often represent a substantial, or occasionally the greatest, proportion of individuals captured. Other beetle assemblages in soybean show a similar pattern with high proportions of native ground beetle species in some situations (Hajek et al. Reference Hajek, Hannam, Nielsen, Bell and Liebherr2007) and relatively few natives in others (Firlej et al. Reference Firlej, Gagnon, Laurin-Lemay and Brodeur2012).
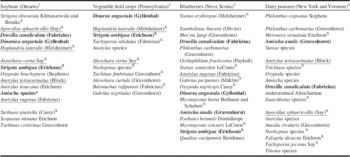
Common species of Staphylinidae (⩾1% of total captured by pitfall traps) in agroecosystems of northeastern North America ranked from highest to lowest activity density.

1, Present study; 2, Leslie et al. (Reference Leslie, Hoheisel, Biddinger, Rohr and Fleischer2007); 3, Renkema et al. (Reference Renkema, Lynch, Cutler, Mackenzie and Walde2012); 4, Byers et al. (Reference Byers, Barker, Davidson, Hoebeke and Sanderson2000).
Rankings for vegetable crops were estimated from bar graphs in Leslie et al. (Reference Leslie, Hoheisel, Biddinger, Rohr and Fleischer2007). Species occurring in three or more agroecosystems are in boldface, other shared species are underlined. Native species are indicated by “X”.
* Included at least some individuals of Amischa analis.
Habitat generalists, typical of open, early succession or disturbed areas, comprised the majority of the soybean assemblage (Campbell and Tomlin Reference Campbell and Tomlin1983; Klimaszewski Reference Klimaszewski1984; Andersen Reference Andersen1991; Levesque and Levesque Reference Levesque and Levesque1995; Klimaszewski et al. Reference Klimaszewski, Assing, Majka, Pelletier, Webster and Langor2007; Majka and Klimaszewski Reference Majka and Klimaszewski2008b; Assing Reference Assing2012; Brunke et al. Reference Brunke, Klimaszewski, Dorval, Bourdon, Paiero and Marshall2012; Webster et al. Reference Webster, Sweeney and DeMerchant2012). In an extensive review of rove beetle species typically found in Norwegian agroecosystems, Andersen (Reference Andersen1991) listed the 30 most widespread species based on their dominance in a variety of annual crop types; three of these species were also common in southern Ontario soybean fields: Anotylus rugosus, Dinaraea angustula, and Amischa species (Amischa analis (Gravenhorst) was among those captured). Three recent surveys of Staphylinidae in annual and perennial agroecosystems in northeastern North America (Byers et al. Reference Byers, Barker, Davidson, Hoebeke and Sanderson2000; Leslie et al. Reference Leslie, Hoheisel, Biddinger, Rohr and Fleischer2007; Renkema et al. Reference Renkema, Lynch, Cutler, Mackenzie and Walde2012) have reported common species (as defined in this study) and are relatively complete at the species level, having identified at least some Aleocharinae. A comparison of these assemblages (Table 4) demonstrated a pattern similar to that of Europe, with many shared species; Drusilla canaliculata, Dinaraea angustula, Strigota ambigua, and Amischa analis were common (>1% activity density) species in the greatest number of habitats. Individual species of Anotylus may be more widespread in agroecosystems than apparent in Table 4, due to differences among studies in the level at which members of this genus were reported.
Seasonal activity patterns in soybean fields
While a seasonal progression of species was observed in southern Ontario soybean fields, most species were active during June and July, and generally declined in activity density toward the end of the growing season. Few staphylinids were captured at the end of soybean sampling in September. This general trend was also found in soybean assemblages of Carabidae (Hajek et al. Reference Hajek, Hannam, Nielsen, Bell and Liebherr2007). Tachinus corticinus differed from other common species in that individuals were generally absent from soybean fields after June. Patterns of high early season activity and summer inactivity for Tachinus corticinus were also observed in Québec, Canada raspberry plantations (Levesque and Levesque Reference Levesque and Levesque1996).
The seasonal activity patterns observed in soybean for most species and the additional early season activity in spring hedgerows observed in some species, are consistent with the temporal dynamics of common agricultural species described by Andersen (Reference Andersen1982), Levesque and Levesque (Reference Levesque and Levesque1996), and Balog and Markó (Reference Balog and Markó2007), where species were univoltine and overwintered as adults. Based on these studies, the spring hedgerow activity should represent overwintered adults and the later activity observed in soybean should represent the emergence of new adults. However, in some species, these peaks in activity were weakly separated in time and, given our sampling methodology, difficult to distinguish from dispersal of individuals from hedgerows into soybean fields. The apparent long delay in maximal adult activity in soybean of Hoplandria lateralis may indicate that this species overwinters in the larval stage. Congruently, Thayer et al. (Reference Thayer, Ashe and Hanley2004) reported larvae of a related species, H. klimaszewskii, occurring in Illinois, United States of America, as early as April, while adults were not collected until July.
Habitat use of Staphylinidae common in soybean
All species common in soybean assemblages were detected in hedgerows outside of the soybean growing season and six of 15 species were observed in spring at activity density levels comparable to those observed in soybean fields. At present, it is unclear whether those species detected only at low levels in hedgerows typically occur in other habitats at this time or simply do not exhibit high levels of adult activity outside of the growing season due to aestivation. Adjacent hedgerows provide important habitat to predatory beetles outside the growing season in Europe (Holland et al. Reference Holland, Birkett and Southway2009). Staphylinid species sampled during the winter in a wheat and grass field landscape were more abundant in hedgerows compared with grass fields or ploughed winter wheat in Norway (Andersen Reference Andersen1997). The present study demonstrated that most species common in soybean assemblages do inhabit hedgerows outside of the growing season. Dispersal of beetles between hedgerows and fields is well documented in European agroecosystems (e.g., Holland et al. Reference Holland, Birkett and Southway2009) and thus it is unlikely that hedgerow and field populations of a given species were mutually exclusive. Further research comparing numbers of overwintering staphylinids between fields and hedgerows (as in Andersen Reference Andersen1997 or Pfiffner and Luka Reference Pfiffner and Luka2000) is needed to assess the degree to which staphylinids benefit from provision of hedgerow habitat. European staphylinid species that use hedgerows for overwintering habitat were generally spring-active, whereas those with summer activity generally overwintered in the fields themselves (Holland et al. Reference Holland, Birkett and Southway2009). This pattern was not detected in the current study and differences in the degree of hedgerow use by soybean staphylinids may be due to habitat or host requirements rather than phenology, at least for some species. For example, Scopaeus minutus prefers unshaded habitats with disturbed ground (Bohac Reference Bohac1985), and the Diptera hosts of Aleochara verna (Hummel et al. Reference Hummel, Dosdall, Clayton, Harker and O’Donovan2010) may not occur in hedgerows at levels adequate to sustain stable populations. Further research is needed to determine whether these species overwinter in the fields themselves or elsewhere. Holland et al. (Reference Holland, Birkett and Southway2009) emphasised the importance of cultural practices such as non-inversion tillage in the conservation of those species that overwintered in fields rather than hedgerows. Additional surveys are needed to establish whether hedgerow use by the above species is stable across a wider geographic area and range of annual crop systems.
Conclusions
This study identified the common staphylinid species in soybean fields, enabling a description of their spatiotemporal distributions and use of the soybean-hedgerow landscape. The staphylinid assemblage in soybean was generally most active from late June to July and was evenly comprised of native and non-native common species. All species were detected in hedgerows outside of the growing season, consistent with European assemblages, and may benefit from the provision of overwintering habitat. A review of common staphylinids in northeastern North American agroecosystems revealed a shared group of species including Drusilla canaliculata, Dinaraea angustula, Amischa species, and Strigota ambigua. Strigota obscurata, the most abundant species in the present study, was described only recently (Brunke et al. Reference Brunke, Klimaszewski, Dorval, Bourdon, Paiero and Marshall2012) and may have gone unnoticed among individuals of Strigota ambigua in previous surveys. Basic knowledge of the natural history of these species in North America, including diet, is limited or non-existent but, given their widespread occurrence as dominant species, is of general interest to agroecologists. More research is needed to understand the ecology of those species that consistently form dominant components of North American agroecosystems and to elucidate the conditions under which native or non-native species dominate rove beetle assemblages.
The current investigation represents the first species-level survey and study of Staphylinidae in soybean and in northeastern North American field crops. The use of hedgerows by staphylinid species outside of the growing season was not previously reported in annual North American agroecosystems. This study demonstrates that rove beetles are an abundant, diverse component of the soybean arthropod assemblage and their ecological significance in this and other agroecosystems deserves further research attention.
Acknowledgements
The authors thank the following people for their assistance in the field and laboratory: Cody Anderson, Lauren Des Marteaux, Adam Jewiss-Gaines, and David Makynen. Tracey Baute (OMAFRA) provided the initial list of contacts for field sites. The authors thank all participating growers for volunteering their fields and their time. Thanks to the Nature Conservancy of Canada and Rare Charitable Research Reserve for access to their properties. Margaret Thayer (Field Museum of Natural History, Chicago, Illinois, United States of America) identified some Omaliinae for this study. The authors thank the subject editor, David McCorquodale, and the anonymous reviewers for their valuable input, which improved this manuscript. This project was supported by research grants to R.H.H. from the Ontario Ministry of Agriculture and Food/Rural Affairs-University of Guelph Sustainable Production Systems program, and the Grain Farmers of Ontario through the Farm Innovation Program, and by Natural Sciences and Engineering Research Council Postgraduate Scholarships-Masters and Rare research scholarships awarded to A.J.B.
Supplementary materials
To view supplementary material for this article, please visit http://dx.doi.org/10.4039/tce.2014.19.