I. INTRODUCTION
Erosion of solid metal in liquid metal occurs widely in processes such as hot-dipping coating, Reference Scheid, Schreiner and D’Oliveira1 soldering, Reference Ke, Chuang, Shih and Kao2 and nuclear industry. Reference Hémery, Auger, Courouau and Balbaud-Célérier3,Reference Kondo, Takahashi, Tanaka, Tsisar and Murogac4 The erosion of pot hardware by molten zinc is one of the most important reasons to cause the downtime of production lines. Thus, erosion resistance becomes a primary criterion for the selection of pot hardware materials. Reference Liu, Barbero, Xu, Burris, Chang and Sikka5 A deep understanding of erosion behavior and corresponding mechanisms is of great importance for controlling structural properties during hot-dipping coating, predicting, and extending the lifetimes of pot hardware materials subjected to liquid metal erosion. Reference Tang, Li, Koizumi, Kurosu and Chiba6
Numerous materials are currently being developed and explored to evaluate their corrosion resistance in static liquid zinc. Reference Wang, Lin, Wang and Chen7,Reference Dong, Yan, He, Zhang and Li8 In these materials, Fe–B alloy has excellent corrosion resistance to liquid zinc due to the existence of boride which exhibits nonwetting with liquid zinc. Reference Tsipas and Perez-Perez9–Reference Tsipas, Triantafyllidis, Kiplagat and Psillaki15 During corrosion, the un-corroded intact boride can maintain at corrosion layers a long time, thus, the microstructure of boride has important effects on the corrosion layers and corrosion resistant properties of Fe–B alloy. Directional solidification technology can effectively control the microstructure of alloys and improve the wear and corrosion resistance. Reference Gordon, Trexler, Neu, Sanders and McDowell16–Reference Freitas, Spinelli, Casteletti and Garcia20 Nevertheless, little research has been performed on the erosion characteristic of directionally solidified Fe–B alloy in flowing liquid zinc, and the erosion can reflect the more real applied conditions of pot hardware materials.
The main objective of this work is to investigate the microstructure characterization and inhibiting effect of erosion layers of directionally solidified Fe–B alloy in flowing liquid zinc, and the effect of directionally solidified organization on the microstructure of erosion layers and the erosion resistance of Fe–B alloy.
II. MATERIAL AND METHODS
A. Experimental material
In the present work, as-cast directionally solidified Fe–B alloy containing 3.5 wt% B was prepared in a 10 kg medium frequency induction furnace to obtain Y-block ingots. A water-cooled solidification set-up and a preheating sandmold were used to obtain directionally solidified castings of Fe–B alloy samples. This solidification set-up was designed in such way that the heat was conducted only through the water-cooled bottom.
According to different orientation relationships between the growth direction of Fe2B columnar grain and the cutting direction, the samples were divided into transverse sample (when cutting direction was perpendicular to the growth direction of Fe2B columnar grain) and longitudinal sample (when cutting direction was parallel to the growth direction of Fe2B columnar grain).
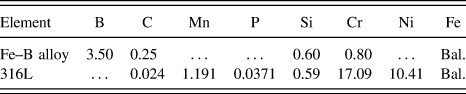
To compare the erosion performance of directionally solidified Fe–B alloy in flowing liquid zinc, 316L stainless steel was selected as a standard sample. The chemical compositions of Fe–B alloy and 316L stainless steel are listed in Table I.
Chemical compositions of the directionally solidified Fe–B alloy and 316L stainless steel (wt%).

B. Experimental methods
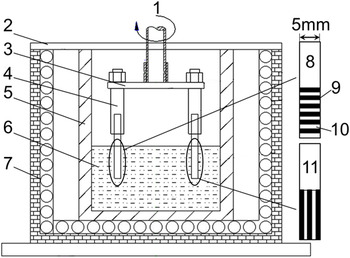
The rotating-disk technique was used to perform the liquid zinc erosion test, and the test device is schematically shown in Fig. 1. The dimensions of all test specimens cut by wire electric discharge machine were 120 × 15 × 5 mm, dipped into liquid zinc to the depth of 40 mm. During the erosion test, the growth direction of Fe2B columnar grain in the transverse sample was perpendicular to the erosion surface (the largest surface) and that in the longitudinal sample was parallel to the erosion surface, as shown in Fig. 1. In each erosion test, 30 kg fresh pure zinc was melted and kept at 460 °C in furnace. The ceramic crucible for melting zinc (Φ230 mm in diameter and 300 mm in length) was made of 33 wt% SiN, 66 wt% SiC, and about 1 wt% Si. A pure zinc ingot was added into the crucible on fixed intervals. Moreover, the furnace was sealed by an adhesive tape of aluminum foil and an Ar atmosphere was used to avoid liquid zinc oxidation. To ensure that the iron in the liquid zinc was unsaturated, the chemical composition of corroded liquid zinc was measured during the test by compositional analysis to make liquid zinc unsaturated completely.
Schematic drawing of the erosion test and the different directionally solidified sample in flowing liquid zinc: 1-rotating shaft, 2-furnace cover, 3-erosion angle control unit, 4-fixture test, 5-crucible, 6-liquid zinc, 7-furnace, 8-transverse sample, 9-Fe2B phase, 10-α-Fe matrix, 11-longitudinal sample.

C. Erosion rate measurement
Before the erosion test, all the specimens were polished by carborundum paper until 2000 grade and cleaned using ultrasonic in pure alcohol. The initial thickness of the specimen was obtained from the average value measured 12 times at multiple locations using micron micrometer. Reference Wang, Lin, Wang and Chen21 After the erosion test, firstly, for ensuring the accuracy of experimental data, the eroded sample was taken from liquid zinc and was cut perpendicularly to their erosion surface after the tests and then the cut sample was embedded in the resin in which the perpendicular relationship was maintained during sample preparation for microscopical observation to obtain thickness loss. Reference Tang, Li, Kurosu, Koizumi, Matsumoto and Chiba22 Then, the thickness of each eroded sample was measured microscopically at 1 mm intervals across the cross-sections. To eliminate erroneous data from the sample tapered by accelerated erosion in these areas, the measurement was not performed to the end of the sample but made 6 mm to either side of the sample center. The average thickness loss was used to calculate erosion rates of the tested alloys as follows [Eq. (1)] Reference Liu, Barbero, Xu, Burris, Chang and Sikka5,Reference Tang, Li, Kurosu, Koizumi, Matsumoto and Chiba22–Reference Ma, Xing, Yi, Fu and Liu24 :
 $$R = {{(a - b)} \mathord{\left/ {\vphantom {{(a - b)} {2t}}} \right. \kern-\nulldelimiterspace} {2t}}\quad ,$$
where R is the erosion rate (μm/h), a is the average original thickness (μm), b is the average final thickness (μm), and t is the erosion time (h). A factor of 1/2 was used in the equation to reflect the fact that the average thickness change of the sample is caused by the erosion of both sample faces.
D. Characterization
The microanalysis of the specimens was performed by using a Leica DMI5000M optical microscope (OM; Leica Microsystems, Wetzlar, Germany), a backscattered electron image (BEI), an energy dispersive spectrum (EDS), and an X-ray diffraction (XRD). XRD was performed on a MXP21VAHF diffractometer (Mac Science Co. Ltd., Yokohama, Japan) with copper Kα radiation coupling continuous scanning in a 2θ ranging from 20° to 100° at 200 mA and 40 kV, and a scanning speed of 2°/min and a step space of 0.02°.
III. RESULTS
A. As-cast directionally solidified Fe–B alloy
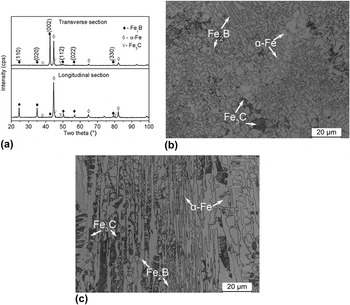
Figure 2 shows the XRD pattern and microstructure of the directionally solidified Fe–B alloy. From Fig. 2(a), it is obvious that the as-cast microstructure of the directionally solidified Fe–B alloy comprises α-Fe, Fe2B and Fe3C. It can be seen that a remarkably strong peak of (002) plane is detected from Fe2B phase in the transverse section. Reference Ma, Xing, Fu, He, Bai, Li and Bai25 Nevertheless, the (002) peak in the longitudinal section is evidently disappeared. It indicates that the directionally solidified Fe–B alloy shows obviously textured structure and its preferred growth direction is [002] orientation. Figures 2(b) and 2(c) show the optical microstructure of the directionally solidified Fe–B alloy. From Fig. 2(b), the transverse section of the directionally solidified Fe–B alloy shows that polygonal grains of Fe2B are surrounded by α-Fe matrix and that the matrix becomes very fragmented. The longitudinal section is columnar grains with the growth orientation opposite to heat-transfer direction [Fig. 2(c)].
XRD pattern and microstructure of as-cast directionally solidified Fe–B alloy: (a) XRD pattern, (b) OM image of transverse section, and (c) OM image of longitudinal section.

B. Erosion performance
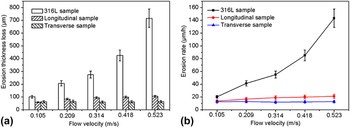
The test samples in flowing liquid zinc with the erosion angle of 0°, the velocities of flowing liquid zinc were 0.105, 0.209, 0.314, 0.418, and 0.523 m/s (the rotation velocities of the set-up were 20, 40, 60, 80, and 100 rpm) and the erosion time was 5 h. Figure 3 shows the average thickness loss and erosion rate as the function of liquid zinc flow velocity. From Fig. 3(a), it can be seen that the erosion thickness loss of 316L stainless steel is obviously larger than that of the directionally solidified Fe–B alloy in the same test conditions. The average thickness loss of 316L stainless steel increases quickly with the increase of liquid zinc flow velocity, but that of the directionally solidified Fe–B alloy increases slowly. The transverse sample possesses the best erosion resistance compared with other test samples. When the flow velocity of liquid zinc is 0.523 m/s, the erosion rate of the transverse sample is one-tenth of that of 316L, as shown in Fig. 3(b).
Erosion thickness losses and erosion rate as a function of liquid zinc flow velocity: (a) erosion thickness loss versus flow velocity, (b) erosion rate versus flow velocity.

IV. DISCUSSION
A. The effect of orientation of Fe2B phase
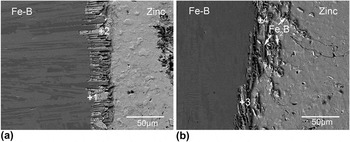
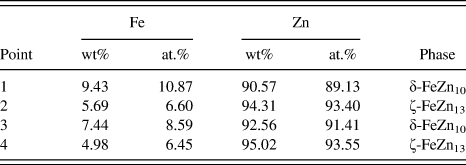
The different orientations of Fe2B phase lead to the interaction of matrix and Fe2B phase, and that of residual Fe2B skeleton and erosion compounds which have different effects on the transverse and longitudinal sample. Figure 4 shows EDS analysis of erosion compounds and the microstructure of erosion layers of the different orientated directionally solidified Fe–B alloy in flowing liquid zinc (the flow velocity is 0.209 m/s). The compositional results of EDS analysis of the points in Fig. 4 are shown in Table II. According to previous researches, Reference Ma, Xing, Fu, Yi, Zhi and Li23,Reference Marder26–Reference Peng, Wang, Su, Li and Yin28 the types of erosion compounds of the directionally solidified Fe–B alloy are composed of δ-FeZn10 and ζ-FeZn13, as shown in Table II. The δ-FeZn10 phase closes to the matrix [point 1 in Fig. 4(a), point 3 in Fig. 4(b)] and the ζ-FeZn13 lain on the outside of δ-FeZn10 phase closes to the liquid zinc [point 2 in Fig. 4(a), point 4 in Fig. 4(b)]. For the transverse sample, the Fe2B phase immerses into liquid zinc along the growth direction when the matrix is eroded by flowing liquid zinc. The Fe2B phase protrudes from the matrix but still roots deeply in alloy and maintains an intact structure at erosion layers. The δ-FeZn10 and ζ-FeZn13 generate and grow among the residual Fe2B skeleton near the matrix. They combine with the residual Fe2B skeleton and then form a combining layer, as shown in Fig. 4(a). The growth direction of Fe2B phase of the longitudinal sample is parallel to the erosion surface, so liquid zinc erodes longitudinal sample along with the radial direction of Fe2B phase. Thus, flowing liquid zinc can bypass the Fe2B phase and erode the α-Fe matrix quickly, which results in the Fe2B phase losing support effect of surrounding matrix. Meanwhile, the growth of erosion compounds between the matrix and Fe2B phase accelerates the fracturing and spalling of residual Fe2B, as shown in Fig. 4(b). In consequence, Fe2B phase cannot effectively combine with erosion compounds, and the inhibition effect of erosion layers of longitudinal sample is less than that of transverse sample.
EDS analysis of erosion compounds and the microstructure of erosion layers of the different orientated directionally solidified Fe–B alloy in flowing liquid zinc (the flow velocity is 0.209 m/s): (a) transverse sample, (b) longitudinal sample.

Compositional results of erosion compounds measured by EDS analysis.

B. The effect of erosion velocity
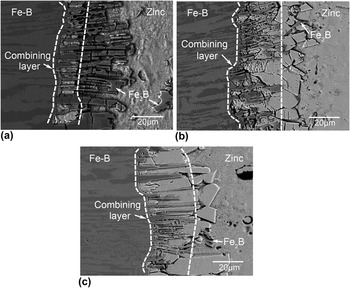
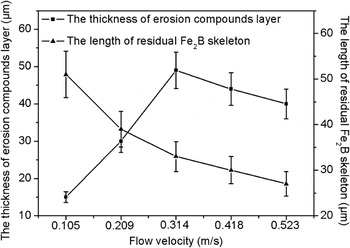
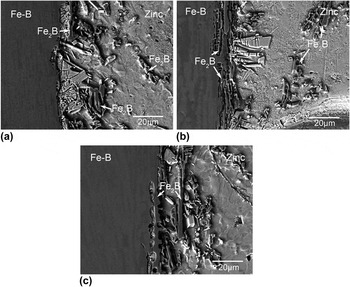
Figure 5 shows the microstructure of erosion layers of the transverse samples in flowing liquid zinc. When the flow velocity of liquid zinc is 0.105 m/s, the completely exposed residual Fe2B skeleton which is through the combining layer immerses into flowing liquid zinc [Fig. 5(a)]. When the flow velocities of liquid zinc are 0.314 and 0.523 m/s respectively, due to the obvious fracture and spalling of Fe2B, the length of residual Fe2B skeleton decreases significantly and the outside of the combining layer is loosened ζ-FeZn13 phase [Figs. 5(b) and 5(c)]. The thickness of erosion compounds layer (the combining layer and the loosened ζ-FeZn13 phase layer) increases firstly and then decreases with the increase of flow velocity, and the length of residual Fe2B skeleton decreases with the increase of flow velocity as shown in Fig. 6. Because of the presence of Fe2B phase, the distribution of matrix becomes very fragmented, as shown in Fig. 2(b). This results in the erosion compounds become very tiny and loosened, so the erosion compounds are easy to be scoured and dissolved by flowing liquid zinc in initial erosion. During the erosion, the length of residual Fe2B skeleton increases firstly with the prolonging of erosion time. When the length exceeds a critical value, the long residual Fe2B skeleton shows a buffer effect on flowing liquid zinc and fixes the loosened erosion compounds near the matrix. Thus, the combining layer can form near the matrix and inhibit the erosion of flowing liquid zinc effectively. But the long residual Fe2B skeleton can be destroyed by flowing liquid zinc later, and the higher the flow velocity is, the earlier the residual Fe2B skeleton fractures. Under the low flow velocity conditions, the fluid shear of flowing liquid zinc is weak and the long residual Fe2B skeleton cannot be destroyed by flowing liquid zinc during the test time, hence, the long Fe2B skeleton immerses into the liquid zinc. Under the high flow velocity conditions, the residual Fe2B skeleton immerses into the liquid zinc spalls from erosion layers after it fractures because of corrosion and scouring in flowing liquid zinc. The fracturing and spalling of residual Fe2B accelerate transitorily erosion and lead to the ζ-FeZn13 growing rapidly. The newly growing ζ-FeZn13 is difficult to be scoured by flowing liquid zinc, because the new ζ-FeZn13 grows from original ζ-FeZn13 in the combining layer, which results in a lot of the ζ-FeZn13 stacking at the outside of residual Fe2B skeleton and blocking the diffusion path of liquid zinc. Thus, the transverse samples possess low erosion rate under high flow velocity conditions.
Microstructure of erosion layers of the transverse samples in flowing liquid zinc: (a) 0.105 m/s, (b) 0.314 m/s, and (c) 0.523 m/s.

Thickness of erosion compounds layer and the length of residual Fe2B skeleton as a function of liquid zinc flow velocity.

Figure 7 shows the microstructure of erosion layers of the longitudinal samples in flowing liquid zinc. When the flow velocity of liquid zinc is 0.105 m/s, a lot of erosion compounds at erosion layers block the erosion of matrix, thus a little residual Fe2B skeleton is exposed from the matrix, as shown in Fig. 7(a). When the flow velocity of liquid zinc is 0.314 m/s, much residual Fe2B skeleton is exposed from the matrix and the amount of erosion compounds decreases because of the quick erosion of matrix and the strong scouring of flowing liquid zinc for the erosion compounds, as shown in Fig. 7(b). When the flow velocity of liquid zinc is 0.523 m/s, severe erosion and scouring of flowing liquid zinc lead to the residual Fe2B skeleton stripping from erosion layers quickly, as shown in Fig. 7(c). For longitudinal sample, because of losing protection of matrix and erosion compounds, the blocking effect of Fe2B in the erosion layers is weakened.
Microstructure of erosion layers of the longitudinal samples in flowing liquid zinc: (a) 0.105 m/s, (b) 0.314 m/s, and (c) 0.523 m/s.

C. The microstructure of erosion layers and the erosion process of directionally solidified Fe–B alloy in flowing liquid zinc
According to the boundary layer theory, there is a laminar region at the entrance of liquid flow into a flat plate sample. Then the liquid zinc flows across the surface of the sample, which is approximately parallel to the sample surface. Thus, the length of laminar region can be calculated by Eqs. (2), (3), and (4) Reference Giorgl, Durighello and Nicolle29–Reference Cussler31 :
 $${\mathop{\rm Re}\nolimits} = {{\omega {r^2}} \mathord{\left/ {\vphantom {{\omega {r^2}} v}} \right. \kern-\nulldelimiterspace} v}\quad .$$
 $${\mathop{\rm Re}\nolimits} = {{\rho Vx} \mathord{\left/ {\vphantom {{\rho Vx} u}} \right. \kern-\nulldelimiterspace} u}\quad .$$
 $$V = \omega \cdot r\quad .$$
By Eqs. (2), (3), and (4) deduce Eq. (5):
 $$x = {{ur} \mathord{\left/ {\vphantom {{ur} {v\rho }}} \right. \kern-\nulldelimiterspace} {v\rho }}\quad ,$$
where Re is the Reynolds number, r is the radius of sample rotation, v is the kinematic viscosity of the bath (m2/s), ω is the angular velocity (1/s), ρ is the density of molten metal (kg/m), V is the linear velocity of molten metal (m/s), u is the dynamic viscosity [kg/(m s)], and x is the distance which is between the front end of the flat plate sample and the laminar boundary layer end. From Eq. (5), the value of x is independent of liquid flow velocity. The kinematic viscosity of molten zinc (v) is 5 × 10⁻⁷ m2/s at the 465 °C, Reference Giorgl, Durighello and Nicolle29,Reference Assael, Armyra, Brillo, Stankus, Wu and Wakeham32 and according to the Ref. Reference Assael, Armyra, Brillo, Stankus, Wu and Wakeham32, the density of molten zinc (ρ) is 6508 kg/m and the dynamic viscosity of molten zinc (u) is 3.245 × 10⁻³ kg/(m s) at 476.85 °C. The estimated value of x is 50 mm and it is more than the length of liquid zinc flowing through the sample surface (15 mm). So the boundary layer is laminar flow.
Meanwhile, the effect of boundary layer and diffusion boundary layer of solid–liquid interface on erosion in flowing liquid metal is studied by many researchers. Reference Giorgl, Durighello and Nicolle29,Reference Dybkov30,Reference Niinomi, Ueda and Sano33 The thickness of boundary layer is described by Eq. (6) Reference Giorgl, Durighello and Nicolle29 :
 $$\delta = 3.6{v^{{\rm{1/2}}}}{\omega ^{ - {\rm{1/2}}}}\quad ,$$
where δ is the thickness of boundary layer (m). From Eq. (6), when the flow velocity of liquid zinc is 0.105 m/s, the thickness of boundary layer is 1.7 × 10⁻³ m, so the long Fe2B skeleton do not cross through the boundary layer, as shown in Fig. 6, and the thickness of boundary layer thins with the increasing of flow velocity. The thickness of diffusion boundary layer is described by Eq. (7) Reference Dybkov30 :
 $${\delta _{\rm{d}}} = 1.61{D^{{\rm{1/3}}}}{v^{{\rm{1/6}}}}{\omega ^{ - {\rm{1/2}}}}\quad ,$$
where δd is the thickness of diffusion boundary layer (m), D is the diffusion coefficient of iron in liquid zinc (m2/s). From Eq. (7), the thickness of diffusion boundary layer thins with the increasing of flow velocity. So the diffusion in diffusion boundary layer is accelerated with the increasing of flowing velocity. The diffusion boundary layer is included in the boundary layer.
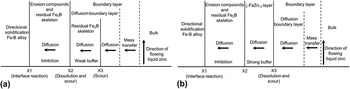
The erosion process of directionally solidified Fe–B alloy in flowing liquid zinc is illustrated in Fig. 8. Under low flow velocity conditions, the erosion layers from the erosion surface of alloy to the liquid zinc is divided into two areas, the combining layer of residual Fe2B skeleton and erosion compounds, and the boundary layer of flowing liquid zinc, as shown in Fig. 8(a), the residual Fe2B skeleton area includes in the boundary layer as previously mentioned. The interface reaction between iron and zinc occurs at X1 location. The complete and compact combining layer is formed by erosion compounds and residual Fe2B skeleton at the location between X1 and X2. Due to the interaction of the erosion compounds and the residual Fe2B skeleton, the inhibition effect and stability of combining layer are enhanced, so the diffusion of zinc through the combining layer is the controlling step of liquid zinc erosion. The ζ-FeZn13 near liquid zinc is dissolved and scoured at X2. The location between X2 and X3 is completely exposed residual Fe2B skeleton, the serried residual Fe2B skeleton has a weak buffer effect on flowing liquid zinc. Thus, the combining layer and completely exposed residual Fe2B skeleton collectively resist the erosion of flowing liquid zinc under the low flow velocity conditions. As shown in Fig. 8(b), under the high flow velocity conditions, the different areas of erosion layers of transverse sample from the erosion surface to the liquid zinc are, in order, the combining layer of residual Fe2B skeleton and erosion compounds, a loosened ζ-FeZn13 layer and a boundary layer. Thus, the interface reaction occurs at X1 location too, but the dissolution and scouring of flowing liquid zinc for the ζ-FeZn13 occur at X3 location. Thickness of combining layer under the high flow velocity conditions is thicker than that under low flow velocity conditions because of quick corrosion of matrix and the fixation effect of residual Fe2B skeleton in the previous erosion, as shown in Fig. 6, so the inhibition effect of it is enhanced further. Though the ζ-FeZn13 at outside of combining layer (the location between X2 and X3) is loosened, it still has a buffer effect on the flowing liquid zinc. Therefore, the unique erosion layers structure ensures that transverse sample possesses an excellent erosion resistance in flowing liquid zinc.
Description of the erosion process of directionally solidified Fe–B alloy in flowing liquid zinc: (a) low flow velocity conditions, (b) high flow velocity conditions.

Because of growth direction of Fe2B in the longitudinal sample is parallel to the erosion surface, the residual Fe2B skeleton and erosion compounds are easy to spall from the erosion layers by flowing liquid zinc. But the new Fe2B can be exposed from the matrix constantly and resist the erosion of flowing liquid zinc. Thus, the microstructure of the erosion layers of longitudinal sample is composed of ordinary erosion compounds layer (i.e., erosion compounds do not combine with the residual Fe2B skeleton) and boundary layer. Thus, the erosion resistance of longitudinal sample mainly depends on the serried Fe2B phase in flowing liquid zinc.
V. CONCLUSIONS
-
(1) The erosion resistance of the directionally solidified Fe–B alloy is better than that of 316L in flowing liquid zinc.
-
(2) The microstructure of erosion layers depends on the orientation of Fe2B phase. When the growth direction of Fe2B columnar grain is perpendicular to the erosion surface, the Fe2B phase, and the erosion compounds form a compact and stable combining layer that effectively inhibits the erosion of flowing liquid zinc and further improves the erosion resistance of Fe–B alloy.
-
(3) The microstructure of erosion layers of transverse sample changes with the increasing of liquid zinc flow velocity, thus, the transverse sample possesses a low erosion rate in flowing liquid zinc.
ACKNOWLEDGMENTS
The authors thank the financial support for this work from the National Natural Science Foundation of China under Grants No. 51601085 & 51301128, Shaanxi provincial post-doctoral research project and the Fundamental Research Funds of Xi’an Jiaotong University under Grant No. XJJ2013038.