I. INTRODUCTION
The determination of mechanical properties of small scale systems or thin films is not always straightforward. Various size effects play an important role when structures are miniaturized and material properties are investigated on a very local scale. Uchic et al. Reference Uchic, Dimiduk, Florando and Nix1 performed micropillar compression experiments and found that the mechanical strength rises upon sample miniaturization and that the deformation behavior is strongly dependent on the ratio of sample size to internal length scale. In many cases, the fracture properties, which are of great importance considering the lifetime and performance of microsystems, are one of the crucial aspects and need to be specified thoroughly. The theory of linear-elastic fracture mechanics (LEFM) is successfully applicable in determining qualitatively as well as quantitatively the fracture properties like fracture strength σf and fracture toughness. Schaufler et al. Reference Schaufler, Schmid, Durst and Göken2 investigated the interfacial strength and fracture toughness of a-C:H coatings by notched and unnotched microcantilevers and Matoy et al. Reference Matoy, Detzel, Müller, Motz and Dehm3 used a very similar approach to characterize the fracture properties of thin film systems. Yet, little is reported in the literature about plastic deformation processes at crack tips in combination with the determination of local fracture properties and methods to describe them. To study the mechanical properties of solid–solid interfaces at the microscale, Kupka and Lilleodden Reference Kupka and Lilleodden4 performed notched microcantilever bending experiments in combination with finite element (FE) simulations. For the investigated grain boundaries, they determined critical fracture loads and characteristic stiffness values, which were normalized with the help of the simulations that were carefully adapted to the experiments. Wurster et al. Reference Wurster, Motz and Pippan5 studied the semi-brittle fracture behavior of single crystalline tungsten with the help of microcantilever bending experiments. They milled notches at different angles to a specific cleavage plane and noticed an increase in fracture toughness with increasing deviation of the notch plane from the investigated cleavage plane. By applying the J-integral technique and evaluating the crack tip opening displacement (CTOD), conditional fracture toughness values were derived and crack growth was determined for this model material. But even microstructurally more complex materials like graded (Pt,Ni)Al bond coats are currently investigated with respect to local fracture toughness determination. Jaya et al. Reference Jaya B, Jayaram and Biswas6 used a combined experimental and modeling approach to calculate the fracture toughness in individual zones of the coating by means of edge-notched doubly clamped microbeams and discussed amongst others the effects of sample geometry and the local microstructural changes on their results.
In this study, the local fracture behavior of single crystalline stoichiometric intermetallic compounds of the B2 phase NiAl was investigated using notched microcantilevers. Iqbal et al. Reference Iqbal, Ast, Göken and Durst7 showed that the fracture toughness can be determined for single crystalline NiAl by means of in situ microcantilever bending tests when applying LEFM. The results agree with data for the same material from macroscopic four-point bend testing. Reference Bergmann and Vehoff8,Reference Thome, Göken and Vehoff9 Normally, the estimated size of the plastic zone according to Irwin's approximation Reference Irwin10 would be too large to perform reliable fracture toughness tests for this material on such a small scale. However, their results are astonishingly close to the macroscopically determined values. Yet, non-negligible plastic deformation was observed around the crack tip for the hard orientation, giving rise to the question whether methods from elastic–plastic fracture mechanics (EPFM) would be more helpful to better understand the semi-brittle fracture processes such as crack initiation and propagation. This implies the demand to derive the fracture toughness more accurately. Therefore, a more detailed experimental study with improved sample preparation approaches is given here to provide a more profound understanding. Two different methods are presented. One was performed in situ in the scanning electron microscope (SEM) and one ex situ with a nanoindenter. Within the scope of the experiments we concentrate in particular on anisotropy effects on the fracture results (“soft” and “hard” orientation) and on size effects by testing small and larger samples with dimensions in width and height of about 2 µm up to about 10 µm and span lengths of about 7 µm up to about 30 µm. With the help of equations derived from FE simulations we developed an improved determination of crack growth in our ex situ experiments in which we used a wedge-type indenter. Finally, our focus is on fracture surface analysis and on the measurement of the plastic deformation around the crack tip.
II. EXPERIMENTAL
A. Specimen preparation
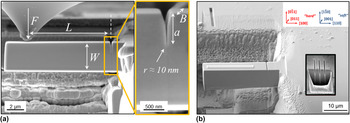
The preparation routine of the microcantilevers is comparable to the one described by Iqbal et al. Reference Iqbal, Ast, Göken and Durst7 Prior to the experiments, the crystallographic orientations of the NiAl samples were evaluated by means of electron backscatter diffraction (EBSD). Then nanoindentations, using a Berkovich indenter, were performed at low indentation depths to make sure that all damage introduced during the mechanical grinding and polishing in the surficial region was gone after the electropolishing procedure. For detailed knowledge about this procedure, the reader is referred to the work of Iqbal et al. Reference Iqbal, Ast, Göken and Durst7 The focused ion beam (FIB) milling currents were progressively reduced at the dual-beam device (1540 EsB, Carl Zeiss, Germany) to design the notched cantilever geometries starting with a coarse milling step (30 kV; 10 nA) and ending with a fine milling step (30 kV; 200 and 500 pA for the smaller and the larger beams, respectively). Here, the FIB-milled notches (30 kV; 10 and 100 pA, respectively) were introduced only at about 1 µm away from the support to avoid undesired plastic deformation. Another change in design was the milling from the top instead of the side as described by Iqbal et al. Reference Iqbal, Ast, Göken and Durst7 which resulted in sharper crack tip radii – estimated according to high-resolution SE micrographs to about 10–20 nm – as shown in Fig. 1(a) for an in situ geometry. The smaller beams had approximate aspect ratios of L:W:B of about 7:2.5:2 whereas for the larger beams ratios of about 30:9:7 were chosen.
The complete in situ setup is shown in the SE micrograph in (a) along with geometric dimensions and the force measurement tip. The notch is milled from the top with 10 pA providing a homogeneous aspect ratio of a/W ≈ 0.3 and a sharp notch tip radius. The ex situ setup is shown in the SE micrograph in (b) together with the respective crystallographic orientations giving the definition for “soft” and “hard” as classified in the literature. A rectangular FIB mark was milled for the nanoindenter positioning and a Pt-layer was deposited on the cantilever's top face to facilitate the calculation of the span length L after the experiment. The reduced SE micgrograph in (b) explains the determination of the notch depth in the bulk material.

B. Testing techniques
Two different testing techniques were applied to determine the fracture behavior and to deduce the fracture toughness. The first technique is an in situ one meaning that the microcantilevers are tested inside the SEM with the help of a force measurement system (Kleindiek Nanotechnik, Germany), which is also presented in Fig. 1(a). By means of the in situ experiments, it is generally possible to focus on very small samples in the micrometer regime, and even below, and their deformation behavior during the test. Fracture features just like crack initiation and propagation and the opening of the crack mouth are directly observable in the SEM. This allows the characterization of the elastic–plastic fracture behavior around a crack tip at each point of a force–displacement curve and the determination of fracture toughness values according to the CTOD method.
In the ex situ experiments, the larger beams were tested with a nanoindenter G200 (Agilent Technologies). In that way, force–displacement curves were recorded more accurately and higher forces were realized. Partial unloading sequences were implemented and constant displacement rates could be achieved. All ex situ tests were performed with a wedge-type indenter having a width of ∼20 µm and a tip radius of ∼5 µm. By using a rounded wedge indenter, the indentation into the beam is strongly reduced and only elastic as proven by indentations into the bulk material at respective forces. The advantage of this fact is that the indenter displacements do not need to be corrected and that a pure bending test is carried out which is not influenced by tensile components. These occur once the indenter penetrates the beam during the test. A change of the moment arm upon bending due to a rounded indenter is discussed and presented by Demir et al. Reference Demir, Roters and Raabe11 However, in our case, it is very difficult to define precise contact conditions as the indenter is not perfectly round, the precise initial contact for the determination of an initial moment arm cannot be exactly defined and limited slipping of the wedge indenter on the cantilever's smooth top side is also possible. Consequently to simplify matters, a constant span length has been used which was determined after each test from SEM images.
Once well aligned, the wedge covered the whole beam width. In that way, a line contact was established and the bending was free of any torque. The alignment procedure is shown in Fig. 1(b). First, a FIB mark was milled into the bulk material for optical positioning of the nanoindenter tip. After that, a relative movement was performed onto the microcantilever and the ex situ experiment was started. A thin Pt-layer which was deposited as a final preparation step on the beam was used to quantify the span length L. Yet, as all the beams were still attached to their support after testing, this procedure was not maintained for all tests. To determine the notch depth, lines were milled (30 kV; 100 pA) next to the microcantilevers into the bulk material for different times. The depth of these lines was measured by cross-section analysis and the desired notch length adjusted. Loading and unloading sequences were executed with the nanoindenter and the upper parts of the unloading slopes were evaluated in every i-th unloading segment. This part was in the range between F max,i and F 0.90,i, where the latter force was characterized by 90% of the maximum force in the i-th unloading segment. A decrease in slope is generally related to an increase in compliance which again means crack growth in the specimens. This procedure allows the determination of J-integrals and thus the calculation of the fracture toughness for a material showing non-negligible plastic deformation at the crack tip accompanied by crack growth.
III. FRACTURE MECHANICAL ANALYSIS OF NOTCHED MICROCANTILEVERS
A. Evaluation of LEFM
To determine reliably the plane strain fracture toughness K Ic, a couple of requirements have to be fulfilled according to various standards. 12–14 Ideally atomistically sharp notches have to be introduced, as e.g., done by fatigue precracking, which is hardly possible at this tested length scale. Due to the fact that not all regulations are met, all fracture toughness values shall be denominated as “conditional” ones in this study and presented with the subscript “Q”. The J-integral and also the CTOD method incorporate an elastic part, which is determined using the equation from LEFM according to Ref. 12:
 $$K_{{\rm{IQ,LEFM}}} = {{F_{\rm{Q}} L} \over {BW^{3/2} }}f\left( {a/W} \right)\quad {\rm{,}}$$
where F Q is the force which was set to F max for comparison with LEFM. The purely elastic part of the force–displacement curve was calculated by setting F Q = F 0.95 which is the load from where the line back to the origin has 95% of the initial loading slope. L is the span length between the notch and the loading point or line, B is the beam thickness, W is the beam width, and f(a/W) is a dimensionless geometry factor which was determined for various notched beam geometries by Iqbal et al. Reference Iqbal, Ast, Göken and Durst7 from FE simulations.
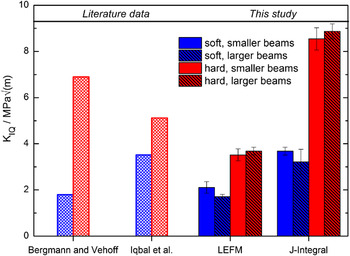
Fracture toughness data for the two orientations and for the different testing methods are presented. Literature data are again taken from Bergmann and Vehoff Reference Bergmann and Vehoff8 and Iqbal et al. Reference Iqbal, Ast, Göken and Durst7

B. Evaluation of the J-integral
If the plastic zone size is large with respect to the sample dimensions, LEFM is no longer applicable and EPFM methods must be chosen to evaluate the fracture toughness. The J-integral was calculated in the ex situ tests by recording partial loading and unloading sequences and by measuring the unloading compliances in each unloading segment. The J-integral for the i-th loading and unloading part can be determined by means of the following equation taken from Ref. 14:
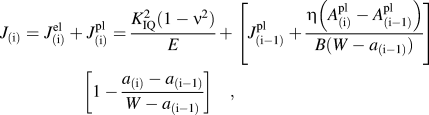 $$J_{\left( {\rm{i}} \right)} = J_{\left( {\rm{i}} \right)}^{{\rm{el}}} + J_{\left( {\rm{i}} \right)}^{{\rm{pl}}} = {{K_{{\rm{IQ}}} ^2 \left( {1 - \nu ^2 } \right)} \over E} + \left[ {J_{\left( {{\rm{i}} - 1} \right)}^{{\rm{pl}}} + {{\eta \left( {A_{\left( {\rm{i}} \right)}^{{\rm{pl}}} - A_{\left( {{\rm{i}} - 1} \right)}^{{\rm{pl}}} } \right)} \over {B(W - a_{\left( {{\rm{i}} - 1} \right)} )}}} \right]\quad\left[ {1 - {{a_{\left( {\rm{i}} \right)} - a_{\left( {{\rm{i}} - 1} \right)} } \over {W - a_{\left( {{\rm{i}} - 1} \right)} }}} \right]\quad {\rm{,}}$$
where K
IQ is specified this time by setting F
Q = F
0.95 in the i-th loading part,
 $\eta$
is a constant factor which was set to 2, and A
pl is defined as the area under the force–displacement curve excluding the elastic contribution. The ratio of (1−ν²)/E, where ν is the Poisson ratio and E the Young's modulus, is determined for the soft and the hard orientation as described in Section III. D. From the crack resistance curve, a critical J-value J
Q is deduced as also explained in more detail in the results section. By using J
Q, the fracture toughness is calculated according to the following equation:
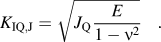 $$K_{{\rm{IQ,J}}} = \sqrt {J_{{\rm{Q}}} {E \over {1 - \nu ^2 }}} \quad {\rm{.}}$$
C. Evaluation of the CTOD
According to the standard E 1290, 13 the crack mouth opening displacement (CMOD) has to be determined to calculate a critical CTOD, CTODc = δc. For rather brittle materials like single crystalline NiAl in the soft [110] direction, this is characterized by the onset of unstable crack extension with no significant prior stable crack extension. For materials like NiAl in the hard [100] orientation showing crack tip blunting, this critical value is determined at the first attainment of a maximum force plateau. Again, not critical but conditional values were calculated as certain restrictions – like a fatigue precrack, a certain a/W ratio being such that 0.45 ≤ a/W ≤ 0.7, and a specific specimen geometry like the arc-shaped geometry or 3-point bend specimens – are not fulfilled. The CTOD is separated into an elastic and a plastic component just as it was shown in the previous section for the J-integral. The elastic part is again obtained by the LEFM formulations and a hinge model is applied for the plastic part as proposed in Ref. 15:
 $$\delta _{\rm{Q}} = \delta _{\rm{Q}}^{{\rm{el}}} + \delta _{\rm{Q}}^{{\rm{pl}}} = d_{\rm{n}} {{K_{{\rm{IQ}}} ^2 (1 - \nu ^2 )} \over {\sigma _{\rm{Y}} E}} + {{r_{{\rm{pl}}} (W - a_0 )v_{{\rm{pl}}} } \over {r_{{\rm{pl}}} \left( {W - a_0 } \right) + a_0 }}\quad .$$
The dimensionless factor d n – which depends, according to Ref. Reference Shih16, on the strain hardening exponent n and the ratio of σY/E – was set to 0.5 when assuming plane strain conditions for the hard and the soft orientation. Values for the yield strength σY were taken from the literature from compression tests Reference Noebe, Bowman and Nathal17 and are ∼150 and ∼1400 MPa for the soft and the hard orientation, respectively. The hinge model incorporates the plastic rotational factor which is around 0.44 for the SE(B) geometry and which was chosen as well for this geometry. From the recorded force–CMOD curves, the plastic part of the displacement v pl is again characterized by constructing a line parallel to the loading line. This procedure to determine δQ values is called the basic test method and provides only an approximation for the fracture toughness in the case of a ductile material. More accuracy is achieved by R-curve testing which was not performed in this study. Instead, fracture toughness values were calculated using the equation in Ref. 13:
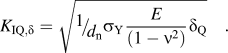 $$K_{{\rm{IQ,}}\delta } = \sqrt {{\raise0.7ex\hbox{$1$} \!\mathord{\left/ {\vphantom {1 {d_{\rm{n}} }}}\right.\kern-\nulldelimiterspace}\!\lower0.7ex\hbox{${d_{\rm{n}} }$}}\sigma _{\rm{Y}} {E \over {(1 - \nu ^2 )}}\delta _{\rm{Q}} } \quad .$$
D. Anisotropic stress field around loaded crack tips
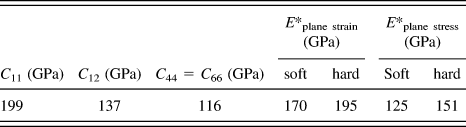
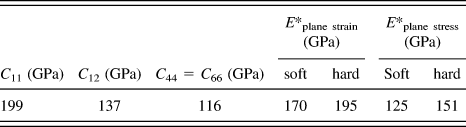
The elastic anisotropy factor of NiAl, calculated with the elastic constants given in Table I, is quite high and of importance regarding the determination of the fracture toughness. To use EPFM for an elastically anisotropic material, the factor E/(1−ν²) in the case of plane strain and E in the case of plane stress must be exchanged by a factor which shall be denoted as E*plane strain and E*plane stress, respectively. This factor considers both the elastic constants and the orientation of the cantilevers and was calculated by applying the theory of a linear-elastic stress field around a crack tip according to Ref. Reference Sih and Liebowitz18 and by rotating the basis vectors into the respective coordinate system for the hard and the soft orientation. The values for E*plane strain and E*plane stress are shown in Table I.
Overview of elastic constants of NiAl (taken from Ref. Reference Thome, Göken and Vehoff9) for the determination of E*plane strain and E*plane stress for the soft and the hard orientation.
IV. RESULTS
A. In situ testing and fracture analysis of the notched cantilevers
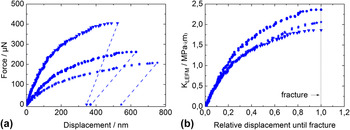
Three load–displacement curves for cantilevers tested in the soft orientation with the same nominal geometry are shown in Fig. 2(a). Due to slight variations in the sample dimensions, some of the cantilevers appear stiffer compared to others. By using Eq. (1), the load is normalized with respect to the sample geometry. The data match nicely for the initial elastic loading part as shown in Fig. 2(b). However, some scatter in the data is visible at larger displacements where the beams deviate from the linear behavior. If only LEFM was applied the final point of each curve, F max, in Fig. 2(b) would give the respective K IQ value. Since F max/F 0.95 > 1.1, LEFM is not applicable and the presentation of the curves in Fig. 2(b) is only useful for a comparison. LEFM can only be chosen once the crack tip is loaded elastically with the tolerance of some amount of small scale yielding and no crack growth. Prior to the tests, a variation of the a/W ratio was carried out with 0.2 ≤ a/W ≤ 0.45. No effect on the stress intensity factors was found and thus all a/W ratios were tried to be kept constant for the in situ tests at around 0.3.
(a) Exemplary force–displacement curves for the smaller cantilevers tested in situ. The unloading slopes were estimated to be the same as the individual loading slopes. Slight changes in the geometrical dimensions like span length or beam width cause different force levels and displacements until the point of brittle fracture. Therefore, the respective stress intensity factors as a function of the “relative displacement until fracture” are shown in (b).

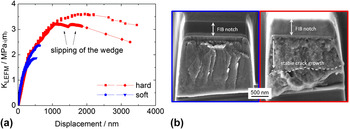
Figure 3(a) shows a plot of the stress intensity factor as a function of the indenter displacement for the hard orientation in comparison to the soft orientation. The stress intensity factor, which was calculated again according to LEFM, reaches ∼3.5 MPa
 $\sqrt {\rm{m}}$
prior to stable fracture. The hard orientation shows substantial strain hardening and plasticity before final fracture. After reaching a maximum, K drops which is related to crack growth as proven by SEM observations. For the test performed using the wedge indenter, it was found that the rounded indenter seems to slip on the cantilever's top after a displacement of around 1200 nm for the first time. This leads to a higher moment arm and K, which was calculated with a constant span length, consequently drops. At a displacement of around 1800 nm, spontaneous instable fracture takes place and the span length is supposed to change again. Due to these facts, the in situ routine was preferred for the testing of the smaller cantilevers.
The stress intensity factors are plotted in (a) for the soft and the hard orientation for the cantilevers of smaller size as a function of indenter displacement. A further cantilever of similar dimensions was tested for the hard orientation with the ex situ setup revealing difficulties (slipping of the wedge) in the testing procedure. SE micrographs are shown in (b) of the fracture surfaces of the microcantilevers presented in (a). Features of brittle fracture are visible for the soft orientation with around 100 nm of stable crack growth. The cantilever of the hard orientation revealed ductile fracture surfaces and a more stable crack growth.
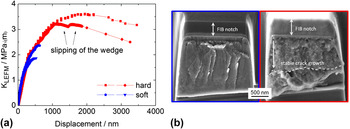
A fracture surface is presented in Fig. 3(b) for each orientation of the small cantilevers. The soft orientation reveals a rather smooth surface since the fracture plane is the preferred {110} cleavage plane for NiAl. Reference Chang, Darolia and Lipsitt19 In the in situ experiments, only a little crack growth was observed in the SEM during the tests. The amount of crack growth was better visible and measurable on the fracture surfaces after the tests. In general, for the small cantilevers, ∼100 nm crack growth was measurable before brittle failure which is characterized by a slightly facetted fracture surface with river lines. A change to the hard orientation provokes a very different fracture behavior. The notch plane is strongly plastically deformed during the bending process. At a critical stress intensity, the crack starts to grow controllably into the highly deformed region. To make the fracture surface visible the part of the cantilever, which still stuck to the support, had to be broken away (area below the dashed line in Fig. 3(b) of the SE micrograph for the hard orientation).
B. In situ CTOD testing
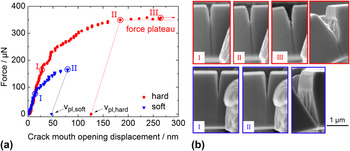
The CMOD was determined by in situ SEM analysis for both the hard and the soft orientation (each orientation four cantilevers). Figure 4 shows the analysis with the corresponding SE micrographs at distinct times during the experiment. For the soft orientation, only limited CMOD and hence little crack growth was observed followed by brittle and instantaneous failure. A more pronounced CMOD was found for the hard orientation which in all tests reached a more or less constant force plateau. Since the geometries of the tested cantilevers were quite similar, it was concluded that the crack mouth opens further for the hard orientation and higher forces are also achieved which is well in agreement with the results shown in Fig. 3. This leads to higher plastic CMODs v pl and a higher fracture toughness for the hard orientation as shown in Table II.
(a) Force versus CMOD for the two investigated orientations. SE micrographs, shown in (b), were taken at distinct times during the experiment from videos recorded for these tests. The soft orientation showed brittle fracture whereas the hard orientation ended in a constant force plateau. The begin of the force plateau (II) was taken as final data point for the determination of v pl,hard. Note the apparent crack growth from image (II) to (III). After the tests, the samples were slightly tilted at the same magnification to allow an inclined observation of the fracture surfaces.

/
A force plateau is reached for the hard orientation due to two oppositional effects. Strain hardening leads to a further increase of the force but as crack growth takes place, the cross-sectional area is reduced leading to a decrease in force. The basic procedure, as described in Ref. 13, is to take the onset of this force plateau as the start for crack growth which seems to work well regarding the SE micrographs in Fig. 4(b). Yet, this onset of a constant force might depend on the sample size which might consequently lead to a size dependent fracture toughness K IQ,δ. To determine the fracture toughness from the CTOD data, the yield strength is needed. From nanoindentation experiments, Iqbal et al. Reference Iqbal, Ast, Göken and Durst7 tried to derive the yield strength at the microscale for NiAl and they reported a value of up to 1800 MPa which is slightly higher than the literature data for the hard orientation and an order of magnitude higher for the soft orientation with respect to the literature. Reference Noebe, Bowman and Nathal17 The reason for this is the indentation size effect Reference Durst, Backes, Franke and Göken20 where the hardness increases with decreasing indentation depth. Yet, the hardness from which yield strength can be calculated by Tabor's approximation Reference Tabor21 is only an average value from which a uniaxial yield strength – in this case in the [110] or the [100] crystallographic orientation – cannot be determined. A rise in the yield strength is supposed to be of minor relevance as the smallest cantilever dimensions were still around 2 µm and therefore the macroscopic yield strength data were applied. Yet, further investigations are needed to accurately quantify this value at the microscale.
C. Ex situ testing with the wedge indenter
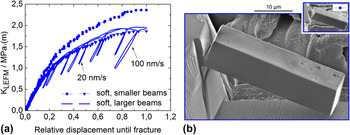
A series of four large notched cantilevers (aspect ratio L:W:B ≈ 30:9:7) were tested for each orientation ex situ at various displacement rates. In Fig. 5, two exemplary tests are shown for the soft orientation along with curves from the in situ tests. The problem of slipping noted for the smaller cantilevers was not observed for the larger ones probably due to a larger contact zone. Nearly the same stress intensities are reached prior to fracture as in the in situ experiments. All curves were very reproducible no matter the displacement rate and it was therefore concluded that the results are independent of the indenter velocity during the test and thus of the temporal derivative of the fracture toughness dK/dt. Due to the slightly rounded wedge type diamond indenter for the ex situ tests, the displacements did not have to be corrected and pure bending was expected. The effect of yet the hysteresis in Fig. 5 for the sample loaded at 100 nm/s at the last unloading/loading sequence, might be due to a slightly changed contact line. It is notable that with the wedge geometry a linear-elastic initial loading part is achieved after a successful alignment procedure.
(a) Calculated stress intensity factors versus the relative displacement until fracture. Two exemplary curves for the ex situ tests for the soft orientation at different displacement rates with unloading segments are shown. For comparison, two curves from the in situ tests from Fig. 2(b) are also displayed along with two SE micrographs, shown in (b), one from an in situ and one from an ex situ test loaded at 20 nm/s (please note the same scale bar). The ex situ tests fractured at absolute displacements of around 1000 nm.

As in the in situ tests, crack growth is supposed to be negligible for the soft orientation as visible from the fracture surfaces and by comparison of the unloading compliances. No significant change in the unloading slopes was notable, making a successful determination of a critical J-value J Q impossible according to crack resistance curve testing. Therefore, the whole curve was taken until the last data point to determine a single J-integral for the determination of a K IQ,J. Yet, in contrast to the in situ tests, the unloading slope of the last unloading cycle before fracture instead of the initial loading slope was chosen to calculate A pl.
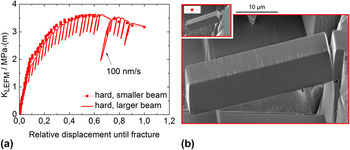
For clarity reasons, only one of the four tests is shown in Fig. 6 for the hard orientation with many unloading sections to be able to follow potential crack growth. Again no difference in the material's response was notable upon changing the displacement rate and thus various experiments at 20 nm/s and at 100 nm/s revealed a very similar behavior with a short linear-elastic loading regime followed by excessive hardening behavior. By means of reference FE simulations, the initial compliance in the experiments was verified to correctly calculate the crack growth for the individual unloading segments. The experiment was again recorded until instable fracture took place and no more unloading parts could be captured. Beforehand, pronounced stable crack growth was observed. For a comparison, a second curve of one of the in situ tests for the hard orientation is also shown in Fig. 6. After calculating again the relative displacement until fracture it becomes obvious that the two data sets match nicely and no size effect appears.
(a) Stress intensity factor versus the relative displacement until fracture. One exemplary curve for the ex situ tests at a displacement rate of 100 nm/s with unloading segments is shown. A second curve from the in situ tests with the small cantilevers from Fig. 3 is also displayed along with two SE micrographs, shown in (b), one from the in situ and one from the ex situ test (please note the same scale bar). The ex situ tests fractured at absolute displacements of around 8000 nm.

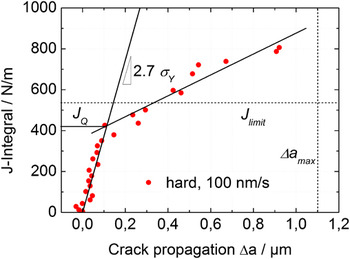
The evaluation of the J-integral method is shown in Fig. 7 for the test presented in Fig. 6. It demonstrates a typical behavior for a material, showing crack tip blunting followed by stable crack growth. A blunting line characterizes the widening of the crack due to plastic deformation ahead of the crack tip in the stretch zone and its slope is typically M ≥ 2. 14 The slope for NiAl in the ex situ tests for the larger samples was calculated to be around M ≈ 2.7. After a critical J-value of around 400 N/m to about 500 N/m, a second linear trend is recognizable (also indicated in Fig. 7). The J-integral keeps rising with pronounced crack growth and at around 700 N/m to about 800 N/m instable crack growth begins and the experiment ended. The testing procedure is restricted to a couple of limitations concerning sample size. A limitation for the J-integral is given by
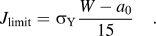 $$J_{{\rm{limit}}} = \sigma _{\rm{Y}} {{W - a_0 } \over {15}}\quad {\rm{.}}$$
Crack resistance curve for the ex situ test from Fig. 6. This time, enhanced crack growth is calculable from the unloading segments. The blunting line for M = 2.7, which was calculated for σY = 1400 MPa, as well as the limit for the J-integral, the maximum allowable crack growth and a second regression line which is needed to determine J Q are indicated.

In the experiments performed, the uppermost limit of J is therefore 420 N/m ≤ J ≤ 537 N/m which means that the values needed for the determination of J Q by means of a second regression line according to Ref. 14 would lie all above this limitation. The maximum allowable crack growth to calculate valid J Q values is given by
 $$\Delta a_{{\rm{limit}}} = 0.25\left( {W - a_0 } \right)\quad .$$
For all tests, this requirement was fulfilled. It should be noted that there are further restrictions in the standard used to determine valid J Q values. Yet, some of them cannot be fulfilled as already described by Wurster et al. Reference Wurster, Motz and Pippan5 For example, exclusion lines which have the same slopes as the blunting line shall be included at the offset values of 0.15 and 1.5 mm which is not possible at this size regime.
D. Comparison of the fracture toughness data
Only the ex situ method provided enough accuracy to determine valid K Q,J values. Nevertheless for the smaller beams which were tested in situ a value is estimated by using the value of the initial loading slope also as unloading slope. For the hard orientation, A pl was calculated taking the onset of the force plateau as a characteristic point up to which presumably no crack growth occurs. For the soft orientation, crack growth was so little that a K Q,J value was calculated by taking the whole curve into account for the measure of A pl. These data are shown in Fig. 8 and listed in Table II together with the data from the LEFM evaluation and the J-integral testing of the larger cantilevers.
Fracture toughness data from LEFM and the J-integral technique are shown. These are compared to the literature data taken from Bergmann and Vehoff Reference Bergmann and Vehoff8 who used the four-point bending technique on stoichiometric NiAl samples and Iqbal et al. Reference Iqbal, Ast, Göken and Durst7 who tested also microcantilevers but with side-milled FIB notches.

V. DISCUSSION
A. Crack tip plasticity – EBSD measurements
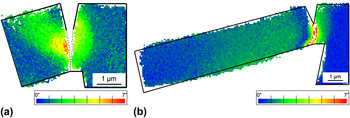
To visualize plastic deformation and to calculate dislocation densities, the EBSD technique is one of the appropriate tools allowing the quantification of lattice rotations due to deformation in crystalline materials. Reference Demir, Raabe, Zaafarani and Zaefferer22 With respect to an undeformed region of the crystal lattice, the crystal rotations are evaluated by means of the Euler angles (texture component mapping). As shown in Fig. 9, a very different behavior is notable for the hard and the soft orientation. For the soft orientation, the plastic zone size is very confined as can be seen in Fig. 9(a) but nevertheless a crystal misorientation of up to 7° proves that dislocation activity has taken place prior to spontaneous cleavage fracture.
EBSD measurements taken from the inner sections of the smaller cantilevers. Texture component mappings (TCM) are shown with respect to the undeformed crystal lattice (blue color) for a fractured cantilever for (a) the soft orientation and (b) the hard orientation. Note that the cantilever in (a) fractured completely (indicated with dashed lines) whereas the cantilever in (b) fractured only partially leaving a highly deformed region ahead of the blunted crack tip which could not be indexed.

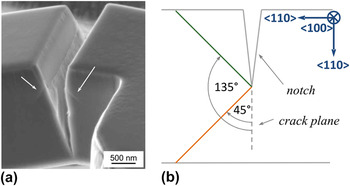
The asymmetric shape of the plastic zone for the soft orientation reaches <1 µm into the support in the case of the smaller sized cantilevers and is confined to the notch zone as there is no remaining plastic deformation remarkable at the beam's surface on the support side. On the other side of the notch, the dislocations move from the crack tip backwards in a 135° angle to the cantilever's top side once a critical crack mouth opening is attained. The slip system is supposed to be of a <100>{100} kind for the soft orientation as the slip vector for NiAl is generally of type a <100>. Reference Miracle23 This effect was already explained for NiAl in macroscopic four-point bend tests by Göken et al. Reference Göken, Vehoff and Neumann24 – the specimens were oriented for the soft orientation exactly as in this study – where dislocation activity was also observed leading in a 135° angle away from the notch tip in the direction of the upper sample side. The elastic–plastic deformation behavior around the crack tip was imaged in situ with an atomic force microscope (AFM). Yet, they also found slip traces in a 45° angle ahead of the crack tip indicating the presence of a further slip system of the same type. This circumstance was also found for the smaller microcantilevers as shown in Fig. 10.
(a) SE micrograph of the fractured region of a microcantilever tested in situ in the soft orientation. Slip traces are clearly visible and indicated with the white arrows. The slip system is supposed to be <100>{100} according to Ref. Reference Miracle23. A 2D schematic after Ref. Reference Göken, Vehoff and Neumann24 is shown in (b) indicating the two possible slip systems for the soft orientation.

For the hard orientation, a very different result is found, and can be seen in Fig. 9(b). The cross-sectional area ahead of the crack is strongly strain hardened before stable fracture takes place as indicated by the high amount of crystal rotation close to the notch and by the impossibility of indexing the crystal ahead of the notch. At the same time, a large plastic zone develops toward the outer region of the beam where crystal rotations of around 2°–3° are measurable until the end of the fracture experiment. This is due to plastic deformation of the beam itself because of the large bending strains which are distributed more homogeneously once strain hardening ahead of the crack tip reaches a certain level.
B. Fracture toughness evaluation
Regarding the quantitative results for the fracture toughness shown in Fig. 8 and Table II, it is obvious that the results from Ref. Reference Bergmann and Vehoff8 are well confirmed for the soft orientation for each of the three testing techniques. Applying the CTOD technique and LEFM, a somewhat lower bound is provided with K
IQ ≈ 1.9 MPa
 $\sqrt {\rm{m}}$
as an average value. The J-integral technique gives a higher value with K
IQ ≈ 3.5 MPa
 $\sqrt {\rm{m}}$
. It is possible that here the fracture toughness has been slightly overestimated as R-curve testing was not performed due to the very finite crack growth in the samples prior to spontaneous failure. For the evaluation of K
IQ from CTOD a yield strength of 150 MPa was chosen. An increase of this value at the microscale might consequently increase the fracture toughness. The materials' strength rises with a decrease in size, which was also shown for microcantilevers by Motz et al.
Reference Motz, Schöberl and Pippan25
and Demir et al.
Reference Demir, Raabe and Roters26
in copper. The authors argue that this rise in flow stress of their microbend samples might be due to a limited amount of active dislocation sources in small volumes and/or due to dislocation pile-up at the center of the beam. Nevertheless, it was supposed in this study that the macroscopic yield strength for the hard and the soft orientations are still applicable because the sample dimensions are larger than ∼2 µm and only below this dimension a considerable increase of the yield strength is expected for NiAl. When comparing the LEFM results for the soft orientation to the ones from Iqbal et al.
Reference Iqbal, Ast, Göken and Durst7
who also used LEFM for the evaluation, the effect of the notch milling on the fracture toughness becomes apparent. Milling from the top, as performed in this study, instead of from the side leads to a much sharper notch tip radius and consequently to a lower fracture toughness due to an increase in stress intensity. The same effect is found for the hard orientation. One can draw the conclusion that with the three presented evaluation methods, a lower and an upper bound for the fracture toughness were set in the case of the soft <110> orientation at the microscale.
For the hard orientation, it is clearly visible from Fig. 8 that LEFM strongly underestimates the fracture toughness as pronounced plastic behavior is found for these tests, which cannot be accounted for using the equations from LEFM. A lot of studies show that the macroscopic fracture toughness for the hard orientation is between 5–9 MPa
 $\sqrt {\rm{m}}$
Reference Bergmann and Vehoff8,Reference Thome, Göken and Vehoff9,Reference Chang, Darolia and Lipsitt19
when samples were tested at ambient conditions and under vacuum. Using the CTOD approach and the J-integral method, the fracture toughness appears to be in the same range. As there is a direct link between these two methods by the equation CTODc = d
n
J/σY, it makes sense that both methods lead to the same result. Yet, it has to be kept in mind that the hinge model has limitations when applied for microcantilevers. Samples for successful CTOD testing are usually deeply notched and the imposed stress state should allow the development of a symmetric plastic zone. These circumstances were not completely fulfilled in our experiments which might result in a slightly asymmetric shape of the plastic zone ahead of the crack tip.
Taking all tests into consideration, one can conclude that no apparent size effect on the fracture toughness is found and the smaller beams which were tested in situ behaved just like the larger samples. No apparent effects are found when testing the smaller samples under vacuum conditions and when comparing their results to the larger beams tested in air. Despite of the good agreement of the quantitative results, certain restrictions cannot be maintained and the following equation given in the ASTM E 1820, 14 which gives lower bounds for the cantilever dimensions, is not applicable:
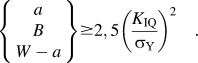 $$\left\{ {\matrix{ a \cr B \cr {W - a} \cr } } \right\} \ge 2,5\left( {{{K_{{\rm{IQ}}} } \over {\sigma _{\rm{Y}} }}} \right)^2 \quad .$$
Supposing a fracture toughness and a yield strength as indicated in this study, the calculated dimensions for a, B, and (W−a) are around two orders of magnitude higher than the dimensions of the microcantilevers in the experiments. To better understand the anisotropic fracture behavior accompanied by plasticity, further FE simulations including crystal plasticity is needed. Furthermore, the plastic zone size needs to be quantitatively evaluated in terms of dislocation density measurements which will be accessible by high-resolution EBSD and transmission electron microscopy (TEM). These techniques should additionally prove if the yield strength is affected essentially at this length scale or not. It would be also interesting to investigate the temperature dependence on the microscopic fracture toughness and to study the occurrence of a brittle to ductile transition in the behavior just as found for macroscopic samples. Reference Chang, Darolia and Lipsitt19
C. Influence of FIB preparation on the measurements
A topic, which is always vividly discussed when samples are prepared by FIB, is the impact of the highly energetic gallium ions needed to perform precise cuts. Of course, lower acceleration voltages are adjustable but the quality of the milled structures becomes worse which is undesired. Therefore, 30 kV was chosen for all milling steps. We suppose that the influence of the gallium implantation and consequently surficial amorphization of the samples on the fracture toughness is negligible in our study due to the following reasons. First, we did not find any FIB-damaged zone on the fracture surfaces of the cantilevers after the tests as shown in Fig. 3(b). Second, the fracture toughness is found to be in the same range as for macroscopic samples. Yet, most importantly we varied the aspect ratio a/W by keeping W constant and changing the notch length by a variation of the milling time. In that way, the dose of gallium was maintained for longer times to achieve larger notches. Nevertheless, as already mentioned earlier, we did not find a change in stress intensity factors due to a change in a/W ratio. This means that the longer milling times also lead to reduced final ligament lengths (W−a) but do not influence the results. Wurster et al. Reference Wurster, Motz and Pippan5 performed besides the cantilever experiments with FIB-milled notch experiments, where they had naturally cracked cantilevers of the same material. They did not find a decisive deviation in the fracture toughness when comparing these two sets of experiments and also concluded that the impact damage of the gallium ions for their investigated material tungsten is negligible. Kiener et al. Reference Kiener, Motz, Rester, Jenko and Dehm27 performed various investigations to quantify the amount of damage experienced by copper exposed to gallium ion bombardment. They found that even at the highest acceleration voltages (30 kV) and under perpendicular ion impact (worse than grazing impact in terms of gallium penetration) a maximum damage layer of ∼50 nm was not exceeded, as confirmed by TEM and Auger electron spectroscopy. Considering its strength, NiAl as an intermetallic compound is supposed to show an even lower value than copper in this regard. The authors show amongst others that FIB preparation has, due to the formation of this thin amorphous layer, only a decisive effect on the mechanical properties like the flow stress of copper when sample dimensions are in the submicrometer regime. Yet, all test dimensions in this study are above this threshold.
VI. CONCLUSIONS
Two testing methods are presented, one in situ in a SEM and one ex situ with a nanoindenter to investigate the local anisotropic fracture behavior of the semi-brittle intermetallic compound NiAl. Both testing methods – in situ and ex situ – provide very reproducible results. It was shown that with the help of the in situ technique, the microscopic fracture and deformation behavior is directly observable and that the fracture toughness can be determined by applying the CTOD method. By using the J-integral technique with serial loading and unloading parts, the unloading compliances were measured and converted into crack growth by an adopted FE model which also takes into account the stiffness and the geometry of the elastic support. Both testing methods show plastic deformation at the crack tip and a higher fracture toughness, contrary to an evaluation technique according to LEFM, and are thus in good agreement with data from macroscopic experiments. By applying smaller and larger cantilever geometries, a size dependence of the fracture toughness values was checked but not found. It is therefore concluded that the fracture toughness as a material constant is, at least at room temperature, constant down to the microscale for NiAl.
ACKNOWLEDGMENTS
The authors gratefully acknowledge the funding of the German Research Council (DFG), which within the framework of its ‘Excellence Initiative’ supports the cluster of Excellence ‘Engineering of Advanced Materials’ at the University of Erlangen-Nürnberg. Johannes Möller is thanked for his support concerning the anisotropy calculations.
APPENDIX: EVALUATION OF CRACK GROWTH FOR NOTCHED MICROCANTILEVERS
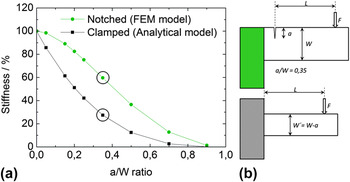
Crack growth was calculated by the determination of the unloading stiffness recorded during the loading–unloading experiments. In general, a growing crack corresponds to an increased a/W ratio and a decreasing bending stiffness. For the understanding of the correlation between the stiffness of a notched cantilever and the a/W ratio, FEM calculations were performed. The stiffness decrease is plotted as a function of the a/W ratio in Fig. A1 for the applied geometry according to these simulations. For comparison, the analytical solution of a clamped bending beam with respective dimensions is also shown. The correlation between the stiffness k and the geometrical dimensions is according to Ref. 28:
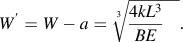 $$W^\prime = W - a = \root 3 \of {{{4kL^3 } \over {BE}}\quad } {\rm{.}}$$
(a) Stiffness decrease as a function of individual a/W ratios for the tested geometry (from FEM simulations, green circles) and for the analytical solution (black squares) of a fixed bending beam according to Eq. (9). Schematics are shown in (b) for the notched geometry from the FE simulations where the support (in green) is around four times thicker than the thickness B of the cantilever and for the clamped beam where the width W is by definition reduced by the respective notch length a for a better comparison.

The stiffness is shown in Fig. A1 for the two geometries and normalized to each maximum stiffness value. The decrease in stiffness with increasing a/W ratio is clearly visible. It is apparent that the stiffness decrease is more pronounced for the unnotched geometry which is explained by the existing support for the notched cantilever. Only at very large a/W ratios when both structures become very slim, the stiffness values are comparable. It is concluded that the stiffness reduction due to a change in the a/W ratio which represents crack growth depends strongly on the boundary conditions and the sample geometry.
When an initial crack to width ratio a 0/W = 0.35 is chosen, which is approximately the experimental case, a stiffness decrease in percent is calculated by dividing the stiffness value at any a/W ≥ 0.35 by the stiffness value of a 0/W = 0.35. By calculating the stiffness values from all the unloading sequences in the experiments, a direct correlation between these values and the modeled a/W ratios is possible and crack growth can be determined. It becomes obvious that the analytical solution for the clamped beam underestimates the crack growth because for various stiffness decreases the notched configuration provides larger a/W ratios and hence larger crack lengths than the analytical solution. This emphasizes again the need for detailed knowledge of the geometry and the boundary conditions of the model to determine the correct crack growth from the unloading stiffness.