About 70% of the worldwide adult population presents some level of lactose intolerance, with higher incidence in individuals of South America, Africa and Asia (Lule et al., Reference Lule, Garg, Tomar, Khedkar and Nalage2015). It is estimated that 50% of dairy products manufactured by multinational dairy companies are lactose free (Lule et al., Reference Lule, Garg, Tomar, Khedkar and Nalage2015), although not all are marketed as such. Among the industrial technologies, lactose reduction by the action of β-galactosidase (lactase) enzyme has been the most applied method for dairy production. This enzyme hydrolyzes the lactose into glucose and galactose whose concentrations increase in the final product. The methodology can be applied to various dairy products, including the concentrated ones such as Dulce de leche (DL: Rodriguez et al., Reference Rodriguez, Cuffia, Piagentini, Lema, Panizzolo and Rozycki2016).
DL is typically produced by countries in South America (Sabione et al., Reference Sabione, Silva, Pinheiro, Borges and Chaves1984) and has the potential to be commercialized on the international market. Considering its high amount of lactose, approximately 10.43% w/w (Perrone et al., Reference Perrone, Stephani and Neves2011), the use of lactase enzyme is a promising solution to the formation of lactose crystals on the product (Sabione et al., Reference Sabione, Silva, Pinheiro, Borges and Chaves1984) and, at the same time, to allow its consumption by people with intolerance to this carbohydrate.
DL is produced by milk concentration at considerably high temperatures (Brazil, 1997). Hence, the hydrolyzed product is prone to develop Maillard reaction (MR) products because of the higher availability of reducing carbohydrates (galactose and glucose). Besides compromising nutritional aspects, excessive MR may alter the sensory characteristics of DL because of more intense color or sandiness texture (Walstra et al., Reference Walstra, Wouters and Geurts2006). Therefore, ways to monitor and control the development of MR during low lactose DL production must be considered.
The kinetics of MR product formation is influenced by factors as pH, type and amount of amine/reducing sugar, and temperature of heating treatment (Martins et al., Reference Martins, Jongen and Boekel2001). By changing these factors it is possible to control the intensity of the reaction and, consequently, the excess accumulation of dark compounds (melanoidins) that contribute to the non-conform color of the product (Francisquini et al., Reference Francisquini, Martins, Silva, Schuck, Perrone and Carvalho2017).
Therefore, the aim of this study was to monitor the development of MR in lactose hydrolyzed DL through evaluation of 5-hydroxymethylfurfural (HMF) concentration. The effects of sucrose concentration, pH and level of hydrolysis on HMF content and the product's color were also assessed. Two hypotheses guided this work. The first was: the HMF amount in DL is dependent on the percentage of added sucrose, pH of milk and lactose hydrolysis level. The second was: the intensity of DL color cannot be explained only by HMF amount formed during evaporation.
Material and methods
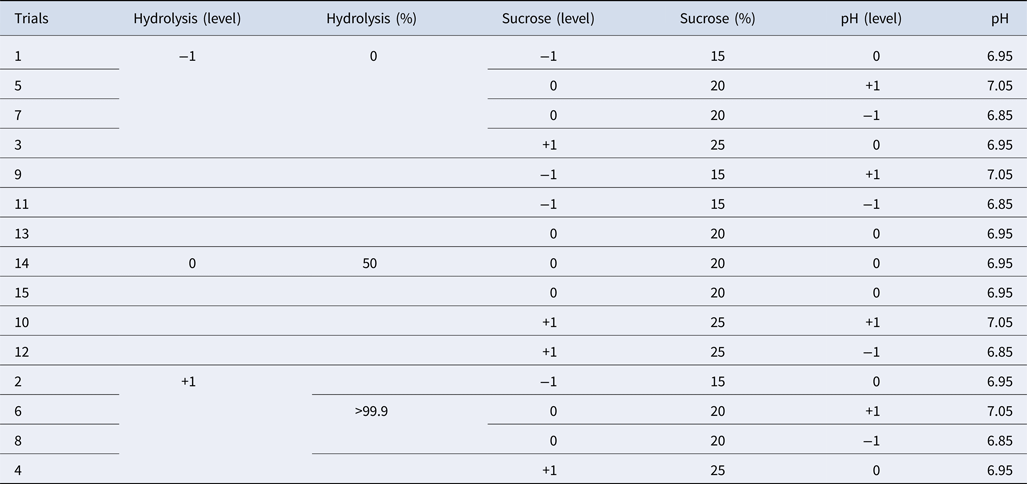
Brazilian legislation (1997) allows a maximum 30 kg of sucrose per 100 l of milk for DL production. Therefore, concentrations of 15, 20 or 25% w/v of sucrose were studied. To determine the effect of the variables lactose hydrolysis, pH and sucrose content on HMF formation in DL, a factorial Box-Behnken 33 design with 15 trials was defined (Table 1).
Box-Behnken 33 design matrix for experimental Dulce de leche production

DL spread was produced from pasteurized whole milk previously adjusted for pH and lactose content, with sucrose added according to the methodology described by Perrone et al. (Reference Perrone, Stephani and Neves2011). The ingredients (milk and sugar) were mixed and concentrated by evaporation in a process simulator Thermomix® TM5 (Vorwerk, Wuppertal, Germany) coupled with a load cell (Ramuza IDR 7.500, Santana de Parnaíba, Brazil) of 1 g precision and a temperature sensor PT-100. The process was continued until concentration of 68 ± 2 °Brix was measured by digital refractometer (AR200, Reichert Technologies Analytical Instruments, New York). The warm products were packaged in 200 g plastic containers and storage at room temperature until analysis.
Water activity (a w) was analyzed by AquaLab (4 ATE model, Meter Group Inc., São Paulo). The colorimetric analyses were determined by Hunter Lab colorimeter (Colour Quest XE, Reston, USA). All the analyses were conducted in duplicate.
Moisture analysis was conducted by drying 1.5 g of DL at 105 °C to an oven (model 404D, Nova Ética, São Paulo). Fat content was analyzed using Gerber method. Protein was analyzed trough micro Kjeldahl method using 1 ml of sample solution (20% m/v) of DL. Ash content was obtained after incineration of 1 g of sample in a furnace at 550 °C (LF0612 model, Jung, Florida). Sample composition analysis followed AOAC International official methods (2005). All the analyses were done in duplicate.
DL samples were collected throughout the production on times 0, 20, 40 and 80 min to monitor total and free HMF formation. All analyses were conducted in duplicate according to methodology of Keeney and Bassete (Reference Keeney and Bassete1959). HMF concentration was obtained from the analytical curve.
The results were analyzed using Minitab® 17.3.1, Excel, 2011 and MATLAB 7.10 software. More detailed information's are described in the online Supplementary Materials and Methods.
Results and discussion
Analyses of the products (Table 2) confirmed that all formulations meet the legislation standards for DL physico-chemical and compositional criteria (Brasil, 1997; Perrone et al., Reference Perrone, Stephani and Neves2011) despite variations on lactose hydrolysis degree, sucrose content and pH (Silva et al., Reference Silva, Ferreira, Souza, Almeida, Stephani, Pirozi, Carvalho and Perrone2015). Therefore, it is possible to infer that the process simulator used on this study is an efficient laboratorial tool to simulate industrial processes of DL production on open pan evaporator.
Statistical analysis of Dulce de leche composition and free HMF just after production

sd, Standard deviation of the mean.
*Calculated values.
**Limits established by legislation (Brazil, 1997) and/or literature (Perrone et al., Reference Perrone, Stephani and Neves2011).
***For free HMF there are no reference values.
Products 1, 2, 3 and 4 (Table 2), without lactose reduction, can be considered traditional formulations of DL. Hence, for the purpose of this study, these formulations will be considered as control for HMF concentration and color formation against lactose hydrolyzed products.
Hydroxymethyl furfural analysis throughout production time
The formulations showed a HMF formation potential of 16 478 ± 7,838 µmol/g. The differences can be explained by variations in the raw materials. However, the DLs showed lower free HMF values than total HMF, which suggests that heating was not enough to induce the maximum formation of this compound (Table 1).
Considering control samples (Free HMF = 55.3 µmol/g), samples with lactose hydrolysis >99% (Free HMF = 110.4 µmol/g) and 50% hydrolysis (Free HMF = 86.1 µmol/g) presented respectively means 2.0 and 1.5 times bigger than control samples. This result strongly suggests that lactose hydrolysis has a big influence on HMF formation in DL. Other authors also observed that lactose hydrolyzed dairy products tend to present higher HMF formation and consequently higher concentration of MR products (Jansson et al., Reference Jansson, Clausen, Sundekilde, Eggers, Nyegaard, Larsen, Ray, Sundgren, Andersen and Bertram2014).
The increase in sucrose concentration did not necessarily result in higher rates of HMF accumulation and its contribution to HMF formation was not apparent. Sucrose is a non-reducing sugar and does not directly take part in Maillard reaction with the formation of HMF (Newton et al., Reference Newton, Fairbanks, Golding, Andrewes and Gerrard2012).
As observed for % of sucrose, the pH influence on HMF formation was variable. The pH affects the intensity of Maillard reaction with a maximum velocity at the alkaline range of pH 9 and 10 (Rodriguez et al., Reference Rodriguez, Cuffia, Piagentini, Lema, Panizzolo and Rozycki2016; Francisquini et al., Reference Francisquini, Martins, Silva, Schuck, Perrone and Carvalho2017). Milk pH is close to this ideal range so, when heat treated, this food becomes very susceptible to the increase of MR product formation (Van Boekel, Reference Van Boekel1998).
An acidity reducer is typically added during DL manufacturing with the aim of reducing or avoiding precipitation as well as helping the development of sensorial characteristics of the food (Perrone et al., Reference Perrone, Stephani and Neves2011). Therefore, this ingredient influences pH increase, resulting in darker coloration of DL. According to Francisquini et al. (Reference Francisquini, Neves, Torres, Carvalho, Perrone and Da Silva2018), free HMF index tends to increase in DLs with higher concentration of sodium bicarbonate (acidity reducer). In this study, the pH variation (6.85−7.05) was limited in order to avoid casein micelles precipitation during production of DL, hence the influence of this parameter was not as well established as in other studies.
Analysis of each parameter separately indicated that the degree of lactose hydrolysis has a central role on the rate of HMF accumulation on DL. However, the role of variables as sucrose addition and pH was not well enlightening. On the other hand, it is feasible to consider that these parameters may contribute synergistically to the HMF formation which justifies an analysis of the simultaneous contributions.
HMF in relation to lactose hydrolysis, sucrose concentration, and pH
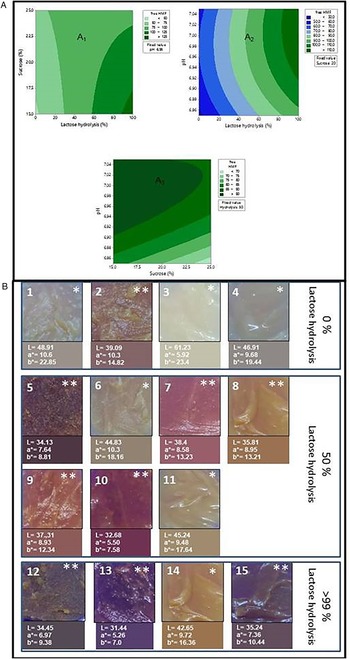
With the aim of evaluating the synergistic effect of the variables, contour curves were created keeping at least one of the parameters constant (Fig. 1). The major HMF accumulation was observed in DLs with higher lactose hydrolysis and lower amount of sucrose (Fig. 1A) or with a higher degree of hydrolysis and slightly alkaline pH (Fig. 1B) or finally a low amount of sucrose and alkaline pH (Fig. 1C).
(A) Contour graph of free HMF formed during Dulce de leche production: (A 1) constant pH at level 0 (6.95); (A 2) sucrose content constant at level 0 (20%); (A 3) lactose hydrolysis constant at level 0 (50%). (B) Visual appearance and color analysis of Dulce de leche: Lightness (L), red/green coordinate (a*) and yellow/blue coordinate (b*) of the samples with different levels of lactose hydrolysis.*Light samples (L > 40); **Dark samples (L ≤ 40).

From the Box-Behnken 33 factorial design, it is possible to identify that the parameters do not independently act on the HMF formation and the contribution of each variable can be predicted by equation 1 at a level of 95% confidence.
 $$\eqalign{{\rm Free}\,{\rm HMF} &= \,-36303\,-\,2.56\, \times \,H\,-\,45.9\, \times \,S\, \cr &\quad + 10546\, \times \,{\rm pH}\,-\,0.00126 \cr&\quad \times H^2\,-\,0.026 \times S^2\,-\,766\, \times \,{\rm p}{\rm H}^2\,-\,0.0640\, \times \,H \cr &\quad \times S\, + \,0.650\, \times \,H\, \times \,{\rm pH}\, + \,7.10\, \times \,S\, \times \,{\rm pH}} $$
Where: Free HMF = HMF concentration expressed as μmol/g; H = % hydrolysis; S = % sucrose; pH = potential of hydrogen ion activity
Relationship between colorimetric analysis and HMF
According to lightness values, samples can be grouped as light (L > 40) or dark (L ≤ 40) (Fig. 1). DLs with hydrolyzed lactose tend to be darker than the traditional ones, which can be partly explained by a higher accumulation of HMF and final products of Maillard reaction (melanoidins). Therefore, HMF seems to influence the dark coloration of the DLs, while pH is decisive in luminosity definition.
This happens because the Maillard reaction begins with a condensation of a reducing sugar with an amino group of an amino acid, peptide or protein. The increase of pH promotes a nucleophilic attack, which is necessary to start the condensation, and consequently provides a bigger stimulus to the start of the Maillard reaction. On the other hand, the decrease in pH decreases the nucleophilic attack, stopping the condensation and the consequent beginning of MR (Newton et al., Reference Newton, Fairbanks, Golding, Andrewes and Gerrard2012; Walstra et al., Reference Walstra, Wouters and Geurts2006). Therefore, high pH increases the formation of MR products (including HMF), resulting in darker foods.
Relationships between HMF and physico-chemical and compositional attributes
From Principal Component Analysis (PCA) it is possible to verify that samples without lactose hydrolysis (1, 7, 3 and 5) formed one group. Products with 50 and 100% of lactose hydrolysis (4, 8, 9, 10, 13, 14 and 15) were grouped far from the ones with 0% of hydrolysis. Characteristics of physico-chemistry, composition and HMF formation were similar between samples in a group. It is clear, therefore, that lactose hydrolysis had a bigger influence on the analyzed attributes when compared to sucrose concentration and pH.
In conclusion, free HMF is a compound indicator of MR and can be related to DL color. Despite the formation of this indicator being influenced by processing time, sucrose content, pH of milk and by lactose hydrolysis level, this work demonstrated that the final color of DL cannot only be explained by higher free HMF concentration on the product. The pH was a central factor defining the intensity of luminosity of the product, which implies that this sensorial attribute can be controlled by adjusting the initial pH of the formulation. From this observation, it is possible to create lactose-free DL that is closer to traditional and well-established products in the market.
Supplementary material
The supplementary material for this article can be found at https://doi.org/10.1017/S0022029919000815.
Acknowledgement
This work was supported by Research Foundation of Minas Gerais State (FAPEMIG), Brazilian National Council for Scientific and Technological Development (CNPq) and Coordination for the Improvement of Higher Education Personnel (CAPES).