How the media affect voter participation is important for several reasons. One is the effect on citizens’ control of government. A lack of information on government performance may lower political participation, allowing an incumbent government to serve its own private interests rather than the population at large.Footnote 1 Low voter turnout may bias party representation, which has important implications for policy decisions.Footnote 2 Politicians may also discriminate against citizens living in particular areas with limited access to media and information.Footnote 3
In an important study, Gentzkow suggested that access to television caused a major drop in voter turnout in US congressional elections.Footnote 4 Since the 1950s, about half of the decline in voter turnout may have been caused by the introduction of television. At least part of the explanation appears to be that television has caused voters to switch from newspapers and radio to commercial television, which appears to have resulted in a decline in political knowledge. TV might have exerted a positive influence on voter turnout if US television had offered better coverage of news stories and political events.Footnote 5 If television had improved its coverage of news stories and political events, it could have had a positive effect on democratic participation.Footnote 6
The current article explores this hypothesis using data tracing the introduction of public broadcasting TV in Norway. Whereas the US regulatory philosophy favored privately owned, for-profit broadcasting companies, most European countries established independent, state-owned broadcasting agencies. These institutions were established with the stated intent to inform the electorate, thereby improving citizens’ ability to influence election outcomes. Empirical research appears to confirm that access to information can increase voter participation.Footnote 7 In fact, TV might reach wider audiences than radio and newspapers when it combines entertainment and easy-to-follow information. The non-selective nature of TV may also generate a ‘trap effect’, in which viewers acquire political information without seeking it.Footnote 8 This article’s key hypothesis is therefore that exposure to TV news and political programming aroused political interest and stimulated electoral participation in Norway.
A number of empirical studies have used survey data to examine the electoral impact of television.Footnote 9 Studies based on self-reported indicators of media use are susceptible to a number of methodological problems, including omitted variable bias and reverse causality.Footnote 10 Other studies compare countries with different media systems, suggesting that countries with public service broadcasting have electorates that are better informed and display higher rates of voter participation than those with market-oriented systems.Footnote 11 These designs may suffer from related problems, not least because media regulations and institutions result from political choices, which also can affect voter behavior.
This article exploits an empirical approach pioneered by Besley and Burgess, Stromberg and Gentzkow.Footnote 12 They estimate the political effects of mass media by comparing voter behavior before and after their introduction.Footnote 13 This design has allowed us to learn about the causal effects of media on political behavior, including the consequences for voter behavior and for the policies implemented by political elites. The Norwegian case offers an opportunity to assess the effects of the state-owned broadcaster. The timing of access to television signals was a side effect of geography, which facilitates the estimation of causal effects.
As the article shows, a significant proportion of the public broadcaster’s schedule was devoted to serious programming, including news and current affairs. When television signals became available, TV penetration increased rapidly, and people turned from radio to the new medium. Newspaper consumption remained high, however. Analyses of three consecutive election surveys indicate that television induced a significant increase in several types of political activity, and, importantly, a modest increase in voter turnout.
The first part of the article outlines the development of TV and presents descriptive statistics of television penetration, the amount of TV programming and levels of media consumption. It provides evidence in support of the identification assumption, and estimates the impact of television on voter turnout. The second part of the article uses survey data to explore how television influenced media consumption and a set of indicators of political behavior.
THE EMERGENCE AND EXPANSION OF TELEVISION IN NORWAY
The pros and cons of television were debated passionately in the 1950s before Norway introduced television. The situation in the United States was used as an argument against television, with opponents pointing in horror to ‘American conditions’.Footnote 14 Nevertheless, while the Norwegian Parliament wanted to avoid what its members saw as the stupefying effects of commercial television, despite serious reservationsFootnote 15 it approved the introduction of television in 1957, becoming one of the last European countries to do so.Footnote 16 The public broadcaster – the Norwegian Broadcasting Corporation (NRK) – was tasked with developing a national television channel. Inspired by the BBC, the Norwegian model was meant to inform the public and motivate their involvement in political issues. At a time when most newspapers were affiliated with a political party, information coming from the state broadcaster was supposed to be independent and impartial. In the 1960s and 1970s, NRK had only one channel and programs were usually broadcast between 6 p.m. and 11 p.m. The program schedule had a ‘serious’ profile: more than half was devoted to news, documentaries and cultural programs.Footnote 17 News and current affairs had a large budget. Many sports and entertainment programs were also given priority during the period. From the mid-1980s, international providers began offering commercial television channels via cable and satellite. The national telecommunications agency allowed cable companies to distribute Swedish television. It was not until 1992 that the first Norwegian commercial television company – TV2 – was given the green light to broadcast programs to the nation.
The Construction of Transmitters and Relay Stations
A television network consists of master transmitters that receive signals from the program line network and relay stations (frequency converters) that make the signals available to areas not reached by the main transmitter (shadow zones). To access signals, a receiver needs to be relatively close to the transmitter (depending on signal strength and antenna capacity); a direct sight transmission path is usually required. Given Norway’s challenging geography and dispersed settlement patterns, it was difficult to reach every household in every corner of the country.Footnote 18 With the exception of the region round Oslo in the southeast, the country is sparsely populated. The main cities are mostly located along a coastline of more than 2,500 kilometers. Much of the inland region and many areas along the coast are dominated by high mountains.
When parliament allowed the introduction of television in 1957, it approved a master plan for developing a nationwide network of transmitters.Footnote 19 The government telecommunications agencyFootnote 20 drafted and implemented the plan. According to the master plan, television signals would become available in the Oslo area from 1960, followed by the cities on the south and west coasts. Television did not arrive in Northern Norway until the late 1960s and early 1970s, and rural communities in the valleys and mountains had to wait even longer.
Radio lines connected the various mountaintop transmitters. The same locations had previously been used as transmission stations for the telephone network. In large parts of the country, the main transmitter did not provide satisfactory TV reception. Networks of relay stations (frequency converters) were built to bring signals to scattered settlements in mountainous areas. The first relay stations were strategically positioned to serve the greatest number of households. Although people in one municipality might receive television signals relatively early, topography could prevent their distribution to people in large parts of a neighboring municipality. The cost of constructing senders was often very high relative to the populations served.Footnote 21 A large and complex TV transmitter network was completed in the early 1990s, with forty-eight main transmitters and more than 2,900 local relay stations.
I have obtained information on the exact location and startup date of all these senders in each of Norway’s 454 municipalities.Footnote 22 I take the official opening of television in 1960 as the first year.Footnote 23 The current operator of the ground-based television network – Norkring – has fed these historical data into a state-of-the-art simulation program that displays the reach of signals depending on signal strength from sender, geographical distance and topography. Annual maps display the location of main transmitters and relay stations, and yield a very detailed picture of the geographical coverage of TV signals.Footnote 24 TV coverage has been defined as the signal strength required to receive signals of sufficient strength using an ordinary outdoor antenna.
The timing of television access has been coded by the year when part or all of the population in a municipality could receive signals. Local and national elections are always held in September, and I therefore assume that television will have been available during an election campaign if the relevant main transmitter or relay stations had started operating earlier than 1 August of the election year.
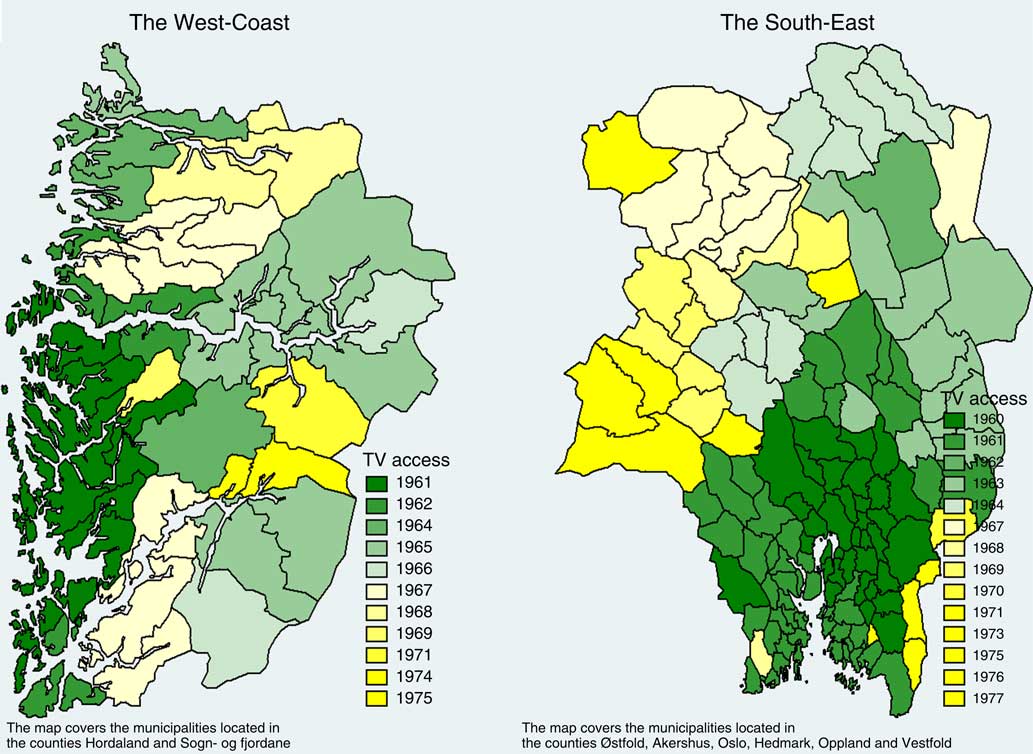
The maps displayed in Figure 1 indicate the first year of TV signal reception in the municipalities. During the early years, main transmitters came on line in the greater Oslo area in the southeast and one transmitter in Bergen on the west coast. Because of the mountainous terrain of the west coast, the first senders could only cover a limited area, mainly coastal areas. Municipalities along the fjords and in the interior received TV access later, sometimes a decade later. Figure 1 shows the differences in access between the west coast and the southeast region, where TV signals covered a much wider geographical area with multiple municipalities. Many of the smaller (rural) municipalities in the region gained access to TV signals at the same time as the central municipalities with larger populations.Footnote 25
First year of TV access

TV and Media Consumption
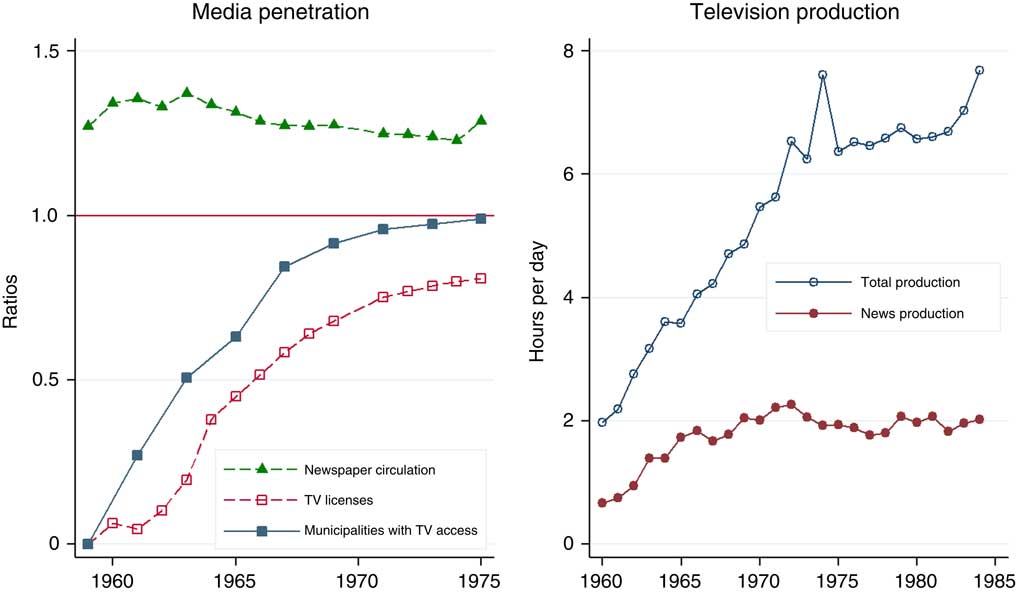
Figure 2 yields further information on the spread of television. The left-hand diagram shows developments in media penetration. The proportion of municipalities with TV access reached 50 per cent by 1965. The second phase started in 1966 and lasted until 1988, when complete TV coverage was attained.Footnote 26 Newspaper circulation remained at a high level throughout the period.
TV and media developments Notes: Daily net news paper circulation and number of TV licenses are measured relative to number of radio licenses; The diagram displays average numbers of TV production, using annual numbers of production. Source: Editons of Statistical Yearbook, Statistics Norway.

The right-hand diagram displays television production. TV broadcasting was initially limited to a couple of hours of a day, and expanded gradually to an average of seven hours in the mid-1970s. News productions increased to about two hours per day in the late 1960s, and leveled off thereafter. At that stage, about 70 per cent of the population watched television on weekdays and the average viewer saw seventy to ninety minutes per day. The evening news (Dagsrevyen) was the most popular program, watched by more than half of those with access to TV.Footnote 27
Voter Participation, 1947–87
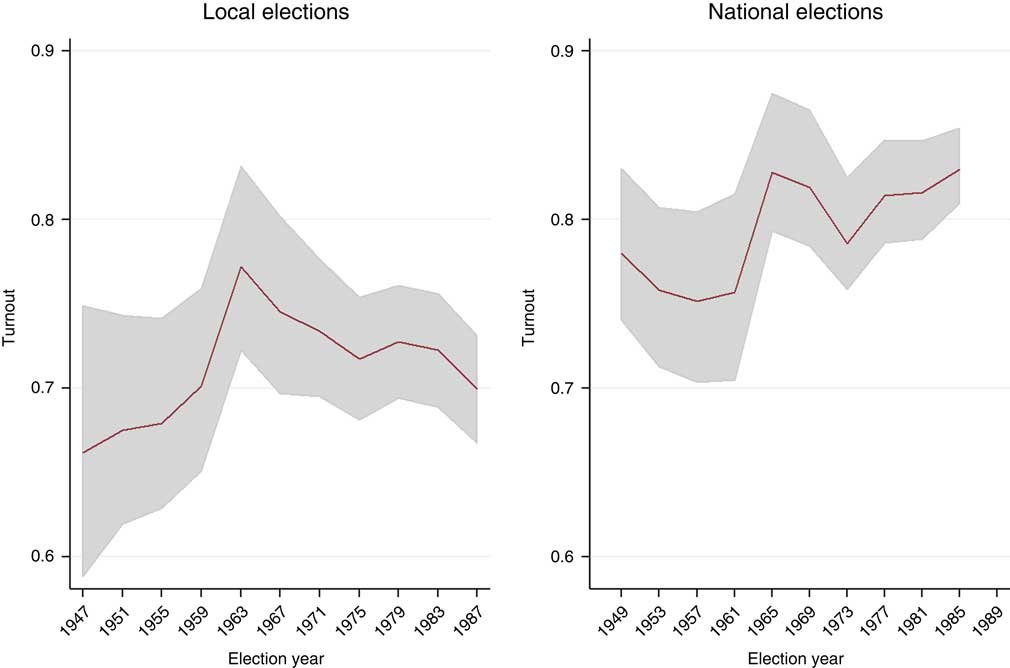
In the Norwegian system, local and national elections are held on fixed dates every fourth year, with local (to the municipal councils) national elections (to parliament) alternating every second year. National elections are conducted in nineteen county districts. The municipalities are nested within each of the counties, each municipality constituting one election district. The election statistics collected at the municipal level include data on voter turnout at local and national elections. Voters are automatically registered on the election roll by the Population Registry, and turnout is defined relative to the number of eligible inhabitants in each municipality.Footnote 28 The analyses are based on data for each election year in the period 1947–87. Figure 3 shows voter turnout in local and national elections measured at the municipal level.
Voter turnout 1947–87 Note: The shaded area indicate the interquartile range of voter turnout, and the lines show average voter turnout.

Figure 3 shows that voter turnout is consistently lower in local than national elections. TV broadcasts started in 1960, and the 1963 and 1965 elections are commonly seen as the first television elections. That levels of voter turnout peaked in these elections is widely attributed to the so-called King’s Bay incident.Footnote 29 The high turnout levels in the 1963 local elections were probably triggered by the sharp parliamentary debate, which ended with a vote of no confidence. The non-socialist party bloc demonstrated that it was a credible challenger to the previously dominant Labor Party, which had held a majority in the national parliament since 1945. These events were extensively covered on national television.
Voter turnout in national elections was somewhat higher in the 1970s and 1980s than prior to the introduction of TV.Footnote 30 From the mid-1960s, there was a decline in local voter turnout relative to the national elections. Another important pattern in Figure 1 is the convergence in turnout rates across municipalities. The variations in levels of turnout declined considerably over the forty-year period plotted, and the reductions were somewhat larger in the local elections.
EMPIRICAL STRATEGY
In the baseline model displayed below, I regress levels of voter turnout against a dummy intervention variable. TV it equals 0 before television signals could be received in municipality i in year t, and 1 when the signals could be received. Turnout it is defined as the share of the eligible population that voted in municipality i in election year t. The baseline specification is estimated separately for voter turnout in local and national elections. Notation for types of elections is suppressed in the formalization below.
 $$ln\,\left( {{{Turnout_{{it}} } \over {1{\minus}Turnout_{{it}} }}} \right)\,{\equals}\,\alpha TV_{{it}} {\plus}X_{{it}} \varphi {\plus}\vartheta _{i} {\plus}\tau _{t} {\plus}\omega _{{it}} $$
I estimate a regression model using a logistic transformation of the response variable, which takes the fractional character of the response variable into account.Footnote 31 The baseline model specification employs fixed effects for municipalities (ϑ i ) and election years (τ t ), and a random error component (ω it ). The key hypothesis is that television has positive effects on voter turnout (α > 0). Some existing studies suggest that national media can crowd out information on local politics, causing a drop in local voter turnout. The models are therefore estimated separately for local and national elections.Footnote 32
The specification implies that television caused a one-time ‘jump’ in voter participation. I also estimate models that allow TV to have a more a gradual influence on voter participation.Footnote 33 Television exposure increased gradually over time (Figure 2), suggesting that those who received TV relatively late would be subject to a larger television shock. I therefore define an alternative treatment variable, P t ·TV it , where P t represents the amount of television production.
I assume that voter turnout in municipalities that obtained TV access in a particular year would have followed the same trend as voter turnout in municipalities that adopted television later, had television not been available. I relax the parallel trends assumption by estimating models with county-year fixed effects. In this specification, the assumption of parallel trends applies within counties only. In the online appendix I also estimate models with a linear, municipality-specific time trend.
The models also include a vector of time-varying controls, population size (log), share of eligible voters in the population, share of eligible women voters in the electorate, share of population living in sparsely populated areas, and share of populated aged 15 or more with higher education. The Appendix A presents the relevant descriptive statistics.
Pre-treatment Trends in Electoral Behavior
The main idea of the current article is that the arrival of television in the different municipalities was a side effect of geography, and can therefore be analyzed as a natural experiment. In this context, three features of television uptake are important:
∙ Norwegian television was developed according to a national plan shaped by technical limitations and cost constraints. The aim was to provide TV signals to the entire population within a defined period. Commercial objectives were not a major concern.
∙ In some cases, a main transmitter offered television access over a wide geographical area, covering various types of urban settlements and rural communities. It was often hard to foresee whether a main transmitter would provide adequate signal strength in a particular area. In other cases, a network of local relay stations was required to adequately receive the signals.
∙ The costs of providing access to television in a particular municipality increased as the number of required local senders grew. Municipalities covering a large area, often separated by high mountains, required a large network of senders. Such areas received TV access later.
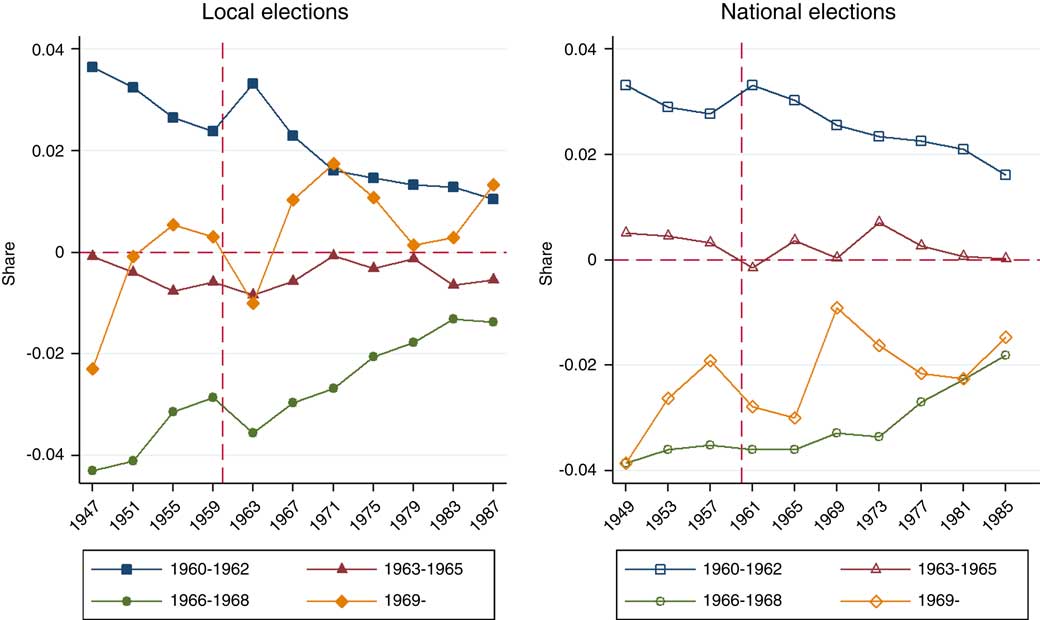
The identifying assumption is that trends in voter turnout would have been the same across municipalities in the absence of television access, conditional on the relevant controls. One way of addressing the parallel trends assumption is to explore trends in voter turnout before television was introduced. I have classified municipalities into four groups depending on their first access to signals. The first wave received access to TV signals in the periods 1960–62 and 1963–65, and the second wave in 1966–68 and 1969 and later. In Figure 4, I display average voter turnout measured as deviations from the election-specific national averages (Figure 4).
Voter turnout by first year of TV access Note: voter turout has been measured as deviations from the annual means. The first muncipalities received access to TV signals in 1960.

According to Figure 4, the timing of television access correlates with levels and trends in voter turnout before and after 1960. Municipalities with early access (1960–63) had relatively high turnout rates in the beginning of the period. The latecomers (1964 and later) had lower turnout rates. Relative turnout rates among those who received TV early fell dramatically, while they increased in areas that received television later.
The timing of television access was heavily influenced by two factors, both of which also correlate with voter turnout. One was the development of the main transmitter network starting in the southeast and finishing in the north, and the subsequent regional timing of TV signal delivery. The other factor was population density. Political mobilization came relatively early in the urban areas, which were the first to receive signals within the broader economic regions.
The regional timing of TV access can be measured by including fixed effects for the municipalities located within nineteen county regions. The other factor was the relatively early construction of relay stations in the major population centers within each of the counties. Voting participation was also higher in the urban municipalities.
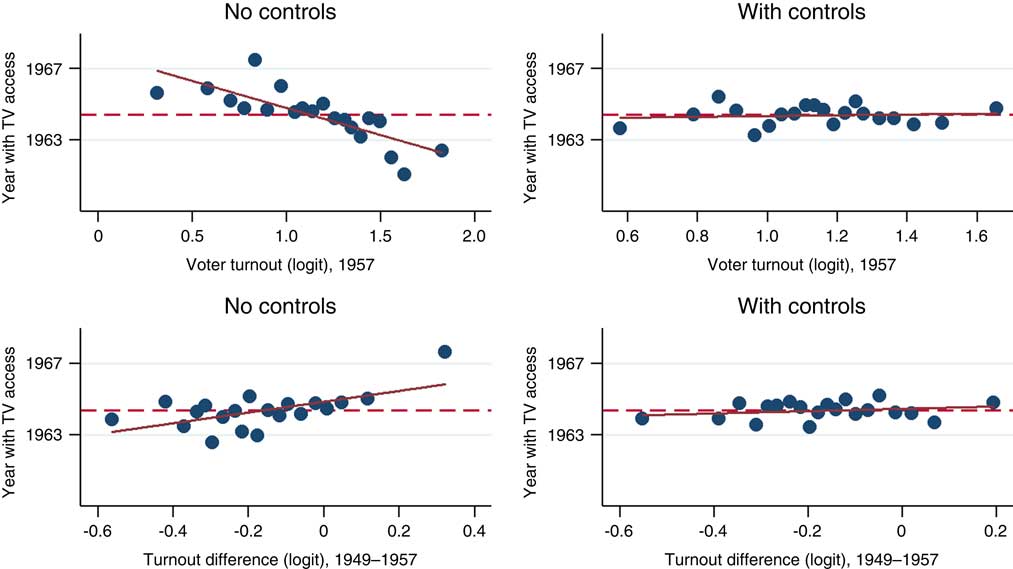
The counterfactual assumption can be examined by looking at partial correlations between the timing of TV access and conditions in the elections before television was introduced in 1960. In Figure 5, I display (binned) scatter plots showing the relationship between voter turnout before TV signals were available in 1960 and the year television signals became available. The upper-left diagram shows that latecomers had relatively low levels of turnout in the 1957 national elections (as in Figure 2). The upper-right diagram in Figure 5 is a partial plot employing the two controls described above, municipal population size (log) and county-fixed effects. The partial correlation is very close to zero, suggesting that levels of voter turnout in 1957 are unrelated to the first year of access to TV. In the lower part of Figure 5, I examine the relationship between pre-treatment trends in voter turnout and the year when television was first available. The lower-right diagram shows that the two controls eliminate the positive, bivariate correlation between pre-trends and the timing of TV access. Hence, the partial scatter plots are consistent with the assumption that the timing of TV access is as good as random (Figure 5).
Balancing tests for the timing of TV access Note: voter turnout (logit) referens to the national elections in 1957 and 1959, and to differences in the period 1949-1957. The controls include country fixed effects and municipal population size (log). The dashed lines mark the average year of TV access.

EMPIRICAL RESULTS
The current section displays the main effects of TV on levels of voter turnout in local and national elections. All regressions in this section are based on municipality-level data.
The Effect of TV on Voter Turnout
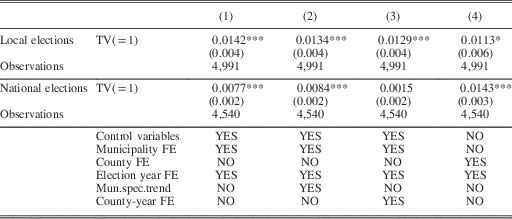
In Table 1, I present separate analyses for turnout in local and national elections. The tables display the marginal effects of TV – that is, the effect of television on levels of voter turnout given averages on the other exogenous variables.
Television and Voter Turnout

Note: the response variables are voter turnout in local and national elections. The models are fractional logistic regression models, and the estimates displayed are the (marginal) effects of the TV dummy on rates of voter turnout. The standard errors are robust standard errors clustered at the municipality level. The control variables are the size of the electorate relative to the population, share of women in the electorate, share of population living in sparsely populated areas and share of population with higher education. Significance levels: *** p<0.001, ** p<0.01, * p<0.05
All TV estimates are positive and significant for local voter turnout. Access to TV appears to increase voter turnout by 1.1–1.4 percentage points. The baseline estimate (1) is very similar to those using municipality-specific trends (2) and county-year fixed effects (3). The final model (4) speaks directly to the identifying assumption, and excludes all controls except county and year fixed effects.Footnote 34 Even this model specification yields a comparable TV estimate.
Television appears to have positive effects on voter turnout in national elections as well. The estimates suggest that TV increases voter turnout by 0.2–1.4 percentage points. The estimates are significant, except in the model with county-year fixed effects (3). Applying the parallel trends assumption only within counties appears to be too demanding, since the counties correspond to the election districts in the national elections. In Appendix B, I present corresponding estimates using a linear model.
The estimates in Table 1 run counter to the hypothesis that television generated a larger turnout increase in national elections. A formal test suggests that the difference in parameter estimates is not statistically significant.Footnote 35 Political interest is to some extent generic. If information on national politics triggers political interest and participation, it is likely to have spillover effects on turnout for the local elections. Additionally, local welfare services are subjected to central government regulations, and local governments rely on sizable central grants. Since local government is an integral part of the welfare state, many voters fail to distinguish between the responsibilities of the different levels of government. Though TV provided information mostly on national politics, it stimulated both national and local participation.
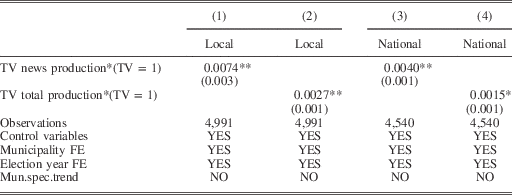
In Table 2, I estimate television effects using hours of television production given access to TV signals as an intervention variable. Using the baseline model specification, the estimates suggest that two hours of TV news production (corresponding to the level of TV production in the 1970s and 1980s, cf. Figure 2) generate an increase of 0.0148 in the local elections, and 0.0080 in the national elections. Similarly, seven hours of total TV production (that is, the peak level of TV production in the period) cause turnout increases of 0.0189 and 0.0105 in local and national elections, respectively. These estimates correspond quite closely to those presented in Table 1.
Television Production and Voter Turnout

Note: the response variables are voter turnout in local and national elections. The models are fractional logistic regression models, and the estimates displayed are the (marginal) effects of the hours of television production on rates of voter turnout. The standard errors are robust standard errors clustered at the municipality level. The control variables are the size of the electorate relative to the population, share of women in the electorate, share of population living in sparsely populated areas and share of population with higher education. ‘Local’ refers to estimates for voter turnout in local elections; ‘National’ refers to turnout in the national elections. Significance levels: *** p<0.001, ** p<0.01, * p<0.05
The persuasion effect
The persuasion rate shows ‘… the percentage of receivers that change the behavior among those that receive a message and are not already persuaded’.Footnote 36 In the current context, the rate adjusts the regression estimates in Table 1 for the share of non-participants and television owners in the electorate. Let Turnout TV −Turnout 0 represent the difference in voter turnout between the treatment and control groups. The relevant estimates are presented in Table 1. The share of the population receiving the television broadcasts can be measured by the share of households with at TV license (License TV ), assuming that people did not buy a license unless signals could be received (License 0=0). The non-voting share of the electorate if there was no exposure to TV (1−Turnout 0) is measured by voter turnout in the last elections before TV became available. We can write the persuasion rate (PR) as:Footnote 37
 $$PR{\equals}100{{Turnout_{{TV}} {\minus}Turnout_{0} } \over {License_{{TV}} {\minus}License_{0} }}{1 \over {1{\minus}Turnout_{0} }}$$
Figure 2 shows that television penetration increased rapidly, and reached 80 per cent in 1975 (License TV − License 0 =0.809). The share of non-participating voters (1-Turnout 0) is measured by turnout in the 1957 national election (76.3 per cent) and the 1959 local election (67.9 per cent). These numbers show that about 5.5 per cent of the abstainers were induced to cast their voters in the local elections, and 4.0 per cent in the national elections, indicating modest differences between the two types of elections. Gentzkow found that TV caused a drop in voter turnout of 2 percentage points per decade, corresponding to a PR of 4.3 per cent. Gentzkow and Shapiro estimated the impact of newspaper entry and exit on voter turnout at 0.8 percentage points, and a corresponding PR of 5.1 per cent.Footnote 38 These numbers are arguably comparable to those presented here, and suggest that media exposure has modest persuasion effects on voter turnout.Footnote 39
Robustness Tests
TV access, TV ownership and voter turnout
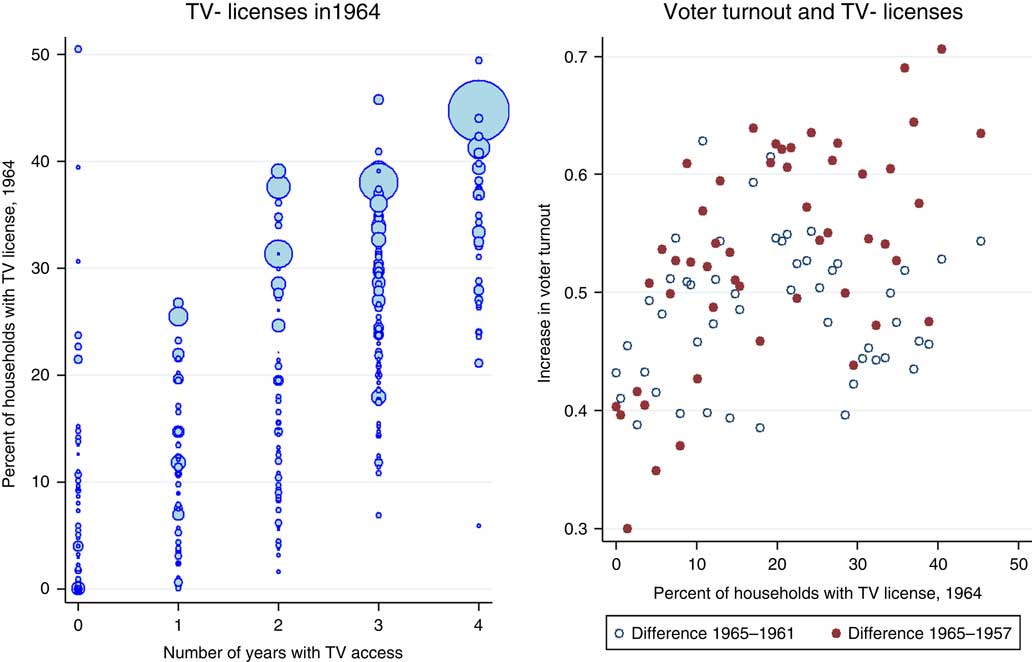
The analyses assume that television ownership spread rapidly once signals were available, and it proposes a causal mechanism in which exposure to television spurred additional citizens to cast their votes. In Figure 6, I exploit municipality-level data on the share of households with television licenses from 1964. The left-hand diagram displays the relationship between the number of years with access to TV signals in the municipality and television ownership. The plot indicates that television spread rapidly, even in the early years with relatively limited programming. Note that the more populous municipalities (indicated by the larger ‘bubbles’) saw higher levels of TV penetration. The right-hand diagram in Figure 6 plots TV penetration against increases in national voter participation. The plot indicates a positive correlation between increases in TV licenses and increases in voter participation. Appendix C provides additional evidence of the relationship between television ownership and voter turnout up to the 1965 national election (Figure 6).Footnote 40
Television licenses 1960–64 Notes: The bubble sizes are proportional to the municipality population sizes; The diagram shows bins using the differences of voter turnout measured on logit scale in 1965 and 1961/1957 respectively.

The assumption of conditional independence
A main argument is that the timing of television access was quasi-random, given controls for population size and county fixed effects. Appendix D displays supplementary tests related to this assumption (cf. Figure 6). The response variable is the number of years with access to TV signals, and I test whether levels and trends in voter turnout before 1960 are related to the timing of TV access. As in Figure 4, these pre-treatment trends are highly correlated with the timing of TV access when the controls are not included in the regressions (Models 1, 3 and 5). When I control for population size and county fixed effects (Models 2, 4 and 6), both the F-tests and tests on individual parameters indicate no significant effects.
The first year of TV access could be a year with a local election, a national election or no election. About 51.1 per cent of the 454 municipalities received their first access to TV in the year prior to a national election or in a national election year, and the others received theirs in a year before a local election or in the year with a local election. About 53.3 per cent gained TV access in election years, and the others in non-election years. These numbers are consistent with the assumption that television availability was as good as randomly assigned.Footnote 41
Estimating TV lead and lag effects
The causal interpretation assumes that TV intervention occurred before we observe a shift in voter turnout. In Appendix E, I estimate turnout regressions using ‘lead’ TV dummies in election years before TV signals were available, a dummy variable representing the first TV election and additional dummies capturing lagged TV effects. I present these pre- and post-treatment estimates for the baseline logit model and a corresponding linear model. The analysis includes data for both national and local elections, assuming that the potential effects are similar in the two types of elections. In the logistic specification, the pre-treatment effects do not differ significantly from zero (that is, there was no placebo effect); the contemporaneous effect is positive and significant, and the lagged TV effects are even larger and positive. The linear specification yields a less clear-cut case in favor of the causality interpretation. The analysis of lead and lag effects suggests that the logistic specification captures TV effects more appropriately.
Estimating models with first differences
Bertrand et al. show that the standard errors of estimates can be undervalued in situations with positive serial correlations.Footnote 42 Using Wooldridge’s suggested test for serial correlation in panel data, I reject the hypothesis of zero first-order autocorrelation.Footnote 43 This suggests that the models could alternatively be estimated with first differences. Importantly, the justification for the logistic model is that television has a relatively larger (positive) effect on turnout at low levels, and smaller effects when turnout levels are high. This assumption can be tested in a model based on first differences.
Let ΔTurnout
i.t
=Turnout
i.t
−Turnout
i.t−4, and define voter mobilization as
 $M_{{i,t}} {\equals}{{\Delta Turnout_{{i,t}} } \over {1{\minus}Turnout_{{i,t{\minus}4}} }}$
. The regression analyses presented in Appendix F indicate that the TV estimates are positive as in Table 1. The estimates are more precise when voter mobilization (M
i,t
) is used as the response variable than in models that use the first-difference (ΔTurnout
i,t
) as the response variable.
ANALYSES BASED ON NATIONAL ELECTION SURVEYS
The National Election Surveys cover three elections – 1965, 1969 and 1973. About half the municipalities had access to television signals by 1965 (cf. Figure 1). The surveys include municipality identification, which means that the data can be merged with data on the year of access to TV signals.Footnote 44 Importantly, all respondents in the 1965 sample were interviewed again in the 1969 and 1973 surveys, and we can test whether individuals changed their political behavior following the introduction of television. The survey data therefore offer a unique opportunity to test a set of related hypotheses. Note that data were collected during years of national elections, and that some of the results are less relevant for local elections. Appendix G presents descriptive statistics on the survey data.
Similar to the municipality-level analysis, TV i,t is a dummy variable indicating whether television signals were available in municipality i before the election campaign in year t (t=1965, 1969 and 1973). Let Q j,i,t be a relevant political outcome (media consumption, political interest, knowledge or participation) of person j in municipality i in election year t. The response variables are coded in the 0–1 interval. I estimate linear models using the following specification:
 $$Q_{{j,i,t}} {\equals}\beta TV_{{i,t}} {\plus}\gamma _{j} {\plus}\vartheta _{i} {\plus}\tau _{t} {\plus}{\epsilon}_{{j,i,t}}. $$
The regression model comprises fixed effects for respondents (γ j ), municipalities (ϑ i ) and election years (τ t ). Municipality fixed effects are included, as some respondents moved to a new municipality. As an alternative, I use individual-level controls (respondent’s age, gender, income and education level) instead of respondent fixed effects.
The Impact of TV on Media Consumption
In the US case, it appears that television induced people to take less interest in newspapers and radio.Footnote 45 The substitution away from media with more politically relevant information is one mechanism that relates television consumption to political participation. Since the estimates presented in Tables 1 and 2 indicate that TV did raise voter participation, we would not expect to see a similar shift in the Norwegian case. Stromberg’s study from 2004 suggested that the introduction of radio in the United States raised voter turnout, while the evidence regarding the impact of newspapers is more mixed.Footnote 46 The survey dataset used in the current paper includes information on three types of media usage:
∙ TV consumption. The election surveys included a question on the NRK’s coverage of election campaigns: ‘We would like to know how people gain information on the election. Did you have opportunity to follow election broadcasts in radio or television?’ Television was coded 1 if the respondent followed programs on TV, or on radio and TV, and 0 if he/she did not follow any election programs.
∙ Radio consumption. The same question was used to measure whether respondents listened to radio programs covering the election campaigns. Radio was coded 1 if the respondent stated radio, or radio and TV, and if he/she did not follow any election programs.
∙ Newspaper consumption. The election surveys included the following question: ‘Which newspapers do you subscribe to or read on a regular basis?’ They could name up to five newspapers.Footnote 47
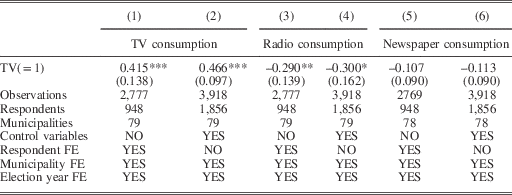
These TV estimates on media consumption are presented in Table 3. Access to television signals had a large, positive effect on the probability of following the election campaigns on television. When TV was available, nearly half the population followed the election campaign on television. Importantly, the regressions indicate that TV had a comparable negative effect on the probability of listening to radio coverage of the national elections.Footnote 48 This means that people switched from radio to television programs, and TV rapidly became the main source of information on national politics.Footnote 49 However, the estimates in Table 4 indicate that access to TV did not affect newspaper circulation significantly. The local press had (and still has) a strong position in Norway, and local newspapers were (and still are) the main source of information on local politics.Footnote 50 This might indicate that television did not crowd out information relevant to participation in local politics.Footnote 51
Television Access and Media Consumption

Note: the response variables are dummy variables for watching the election campaigns on TV, following the election campaigns on radio, and number of newspaper subscriptions. The models are linear probability models (1–4) and linear regression models (5–6). Models 1, 3 and 5 include respondent fixed effects, while Models 2, 4 and 6 include municipality fixed effects and a set of individual-level controls (gender, age, income and education level). The standard errors are robust standard errors clustered at the municipality level. Significance levels: *** p<0.01, ** p<0.05, * p<0.1
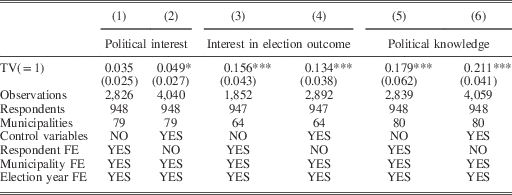
Television Access and Political Interest

Note: the response variables are indicators of political interest, interest in the election outcome and political knowledge. The models are linear regression models. Models 1, 3 and 5 include respondent fixed effects, while Models 2, 4 and 6 include municipality fixed effects and a set of individual-level controls (gender, age, income and education level). The standard errors are robust standard errors clustered at the municipality level. Significance levels: *** p<0.01, ** p<0.05, * p<0.1
The Impact of TV on Political Interest and Knowledge
It has also been argued that television dilutes social capital and reduces social interaction, possibly decreasing citizens’ involvement in political discussions with family and friends.Footnote 52 Since television appears to have increased voter turnout, one might wonder whether these mechanisms are absent in the current setting. The surveys can be used to explore how the arrival of television affected political interest, knowledge of political affairs and participation in face-to-face political discussions:
∙ Political interest. Political interest is measured using a standard survey question that read: ‘Would you say that you in general are very interested in politics, somewhat interested, modestly interested or not interested?’ The answers were coded on an ordinal scale from 1 (very interested), 0.67 (somewhat interested), 0.33 (modestly interested) and 0 (not interested). Identical formulations were applied in the 1965, 1969 and 1973 election surveys.
∙ Interest in election outcome. The respondents were asked: ‘Would you say that you personally care which parties win or lose the election this fall, or do you think that it does not matter?’ The respondents stated whether they were highly interested (=1), moderately interested (=0.5) or did not care (=0). This question was included in the 1965 and 1969 surveys.
∙ Political knowledge. Knowledge of political issues was also measured using similar questions in the three surveys. The respondents were shown a picture of the national party leaders and asked to provide their names and party affiliations. In 1965 and 1969, respondents were asked to provide the names of seven politicians, and in 1973 eleven politicians. For each respondent, knowledge was measured as the share of responses with the right names of the persons and parties.
The estimates presented in Table 4 show that television caused a modest (and marginally significant) increase in general political interest, and gave a major boost to voter interest in the election outcome. The analyses also indicate a substantial increase in political knowledge, as measured by knowing the names of party leaders. Given the visual nature of television, it is perhaps not surprising that respondents’ knowledge of party leaders improved substantially. The estimates using models with respondent-fixed effects are very similar to those using municipality-fixed effects. These results lend some confidence to the interpretation that television did mobilize new voters to the polls by providing relevant information and triggering political interest.Footnote 53
The Impact of TV on Political Behavior
The surveys facilitate further analysis of engagement in political discussions and voter turnout in the national elections.
∙ Political discussions. Respondents to the 1965 survey were asked about the frequency of political discussions in the family or at work. For each of the two questions, the responses were coded 1 (often), 0.5 (occasionally) or 0 (never), and the index averaged the two variables. A slightly different wording was used in the 1969 and 1973 surveys, in which respondents were asked how often they discussed politics in the family or with acquaintances outside the family. The responses were coded 1 (daily), 0.67 (twice a week), 0.33 (more rarely) or 0 (never).
∙ Voter turnout. Data on voter turnout are available for the 1961, 1965, 1969 and 1973 surveys. The individual responses were checked against the data in the population register, and corrected when necessary. Yet the survey data show a considerably higher rate of voter turnout than the official records.Footnote 54 One reason may be that mobile respondents are more likely to drop out of the survey; they also display lower rates of participation. Another reason is that data collection was initiated by an introductory letter sent to all respondents before the election telling them to expect a call from an interviewer after the election. The letter itself might have stimulated participation.Footnote 55 The dataset is therefore limited by relatively little variation in voter turnout.
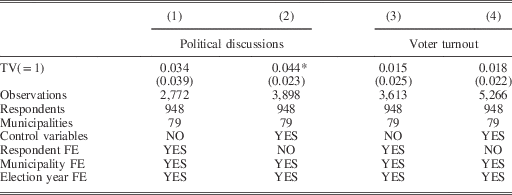
In Table 5, the estimates in Columns 1 and 2 are positive, suggesting that television had a positive, yet modest, impact on partaking in political discussions. The estimates for voter turnout are comparable to those presented in Table 1 for the national elections, yet the estimates are less precise. That notwithstanding, it seems fair to conclude that TV had a positive influence on political interest, politically relevant knowledge and political participation.
Television Access and Political Behavior

Note: the response variables are the indicator of partaking in political discussions and the dummy variable measuring participation in the national elections. The models are linear regression models (1–2) and linear probability models (3–4). Models 1, 3 and 5 include respondent fixed effects, while Models 2, 4 and 6 include municipality fixed effects and a set of individual-level controls (gender, age, income and education level). The standard errors are robust standard errors clustered at the municipality level. Significance levels: *** p<0.01, ** p<0.05, * p<0.1
CONCLUSIONS
The introduction of a state television service in 1960 caused a rapid increase in TV penetration in Norway. People switched from listening to the radio to watching television. Large segments of the electorate began to follow television coverage of the election campaigns, increasing citizen engagement in political life. The evidence indicates that television caused a moderate increase in political interest, and that people participated more in face-to-face political interaction. TV also led some voters to become better informed about national politicians. Television brought about a modest increase in voter turnout, suggesting that TV can be used to stimulate political participation. If for-profit television has a negative effect on voter turnout, the problem appears to be with content, not the medium as such.Footnote 56
It has been suggested that national television crowds out information on local politics.Footnote 57 As in other countries, Norwegian TV was a national broadcaster that put the national party leaders on show. News coverage and political debates addressed national issues during the local election campaigns. All the same, in the Norwegian case, TV caused an increase even in local voter turnout. Better media coverage of national politics might have had positive spillover effects on participation in local elections.
The TV effects are positive, yet relatively small. TV was the second broadcast medium, which might explain why its effects were weaker than that of radio.Footnote 58 The positive effects might have resulted from the state broadcaster’s monopoly. The population was to some extent force fed serious programs. The limited supply meant that those with a preference for sports and entertainment also received a dose of news and information. The trap effect meant that all viewers received a minimum helping of ‘hard news’.
The current media environment differs radically from the situation in the 1960s and 1970s. The internet has improved the availability of news, leading to a substantial shift from news provided by traditional mass media to information gleaned from the internet. Media surveysFootnote 59 show that Norwegians currently spend 2.2 hours per day watching TV and 1.7 hours a day listening to the radio, and spend about 3.7 hours on the home PC and the internet.Footnote 60
Importantly, while 84 per cent of Norwegians read at least one newspaper daily in the early 1990s, the current percentage is 49. Newspaper consumption accounted for 0.3 hours per day in 2014. Following global media trends, newspaper circulation has declined, and media companies have been cutting staff levels, including journalists. Several media have also pruned in-depth news coverage, instead offering more entertainment and ‘soft news’. Public service broadcasting could therefore play an important role in providing high-quality news coverage as a public good, possibly stimulating an interest in politics and a thirst for political knowledge, thereby exerting a positive influence on voter participation.