Introduction
There is a well-documented relationship between type 2 diabetes and depression. Meta-analyses suggest that individuals with type 2 diabetes have an increased risk of developing depression (Nouwen et al. Reference Nouwen, Winkley, Twisk, Lloyd, Peyrot, Ismail, Pouwer and Consoritum2010) and that individuals with depression have an increased risk of developing type 2 diabetes (Rotella & Mannucci, Reference Rotella and Mannucci2013). Another meta-analysis supported a bi-directional relationship between those two conditions (Mezuk et al. Reference Mezuk, Eaton, Albrecht and Golden2008). Four epidemiological studies have evaluated the bidirectional relationship in the same population: Golden et al. (Reference Golden, Lazo, Carnethon, Bertoni, Schreiner, Roux, Lee and Lyketsos2008), using data form the US Multi-Ethnic Study of Atherosclerosis, found a modest association between baseline depressive symptoms and incident type 2 diabetes as well as a positive association of treated type 2 diabetes with incident depressive symptoms. Pan et al. (Reference Pan, Lucas, Sun, van Dam, Franco, Manson, Willett, Ascherio and Hu2010) reported a bi-directional relationship between depression and diabetes in women aged ⩾50 years using 10 years follow-up data from the Nurses’ Health Study cohort study. Chen et al. (Reference Chen, Chan, Chen, Ko and Li2013) also found a bi-directional relationship between depression and diabetes using a random sample from the National Health Insurance claims in Taiwan. Demakakos et al. (Reference Demakakos, Zaninotto and Nouwen2014) reported a bi-directional association between depressive symptoms and diabetes (6-year interval) in people aged 52–64 years from the English Longitudinal Study of Ageing (ELSA).
However, the exact nature of this relationship is not clear. It is likely that psychological, behavioral and biological factors play an important role in this association. For example, depression can lead to poor lifestyle-related behaviors, such as smoking, physical inactivity and poor diet, that can ultimately lead to prediabetes and type 2 diabetes (Renn et al. Reference Renn, Feliciano and Segal2011). These lifestyle-related behaviors can also lead to depression in people with prediabetes and type 2 diabetes (Renn et al. Reference Renn, Feliciano and Segal2011). Depression and diabetes might also be linked through metabolic, inflammatory, autonomic, and hypothalamic-pituitary-adrenal (HPA) axis dysregulations (Kivimaki et al. Reference Kivimaki, Tabak, Batty, Singh-Manoux, Jokela, Akbaraly, Witte, Brunner, Marmot and Lawlor2009). For example, depression has a small but significant association with a systemic chronic inflammatory state. Type 2 diabetes is also associated with a chronic low-grade inflammatory response (Laake et al. Reference Laake, Stahl, Amiel, Petrak, Sherwood, Pickup and Ismail2014). A meta-analysis suggested a bi-directional relationship between depression and the metabolic syndrome, which is defined as a cluster of several cardiovascular risk factors, including central obesity, elevated blood pressure, hyperglycemia, hypertriglyceridemia, and decreased high-density lipoprotein (HDL) cholesterol (Pan et al. Reference Pan, Keum, Okereke, Sun, Kivimaki, Rubin and Hu2012a ). Therefore, it is likely that both lifestyle-related behaviors and cardiometabolic factors mediate the association between depressive symptoms and HbA1c levels.
The objective of the present study was to expand on these results by examining potential mechanisms through which depression and type 2 diabetes are associated with each other. Rather than using (self-reported) diabetes as a diagnostic category (e.g. present or absent) we have taken a more general approach: we have used glycated hemoglobin A1c (HbA1c) levels as a biomarker of prediabetes and type 2 diabetes since the risk of diabetes increases along a glycemic continuum (Inzucchi, Reference Inzucchi2012). The International Expert Committee (IEC) recommended the use of HbA1c for the diagnosis of diabetes [threshold level of 6.5% (48 mmol/mol)] (Nathan et al. Reference Nathan, Nathan, Balkau, Bonora, Borch-Johnsen, Buse, Colagiuri, Davidson, DeFronzo, Genuth, Holman, Ji, Kirkman, Knowler, Schatz, Shaw, Sobngwi, Steffes, Vaccaro, Wareham, Zinman, Kahn and Int Expert2009), while the American Diabetes Association has defined a HbA1c range of 5.7–6.4% (39–46 mmol/mol) as prediabetes (Inzucchi et al. Reference Inzucchi, Bergenstal, Fonseca, Gregg, Mayer-Davis, Spollett, Wender and Amer Diabet2010).
Using longitudinal data from the ELSA study with repeated assessments of depressive symptoms and HbA1c, our specific aims were (a) to evaluate the dynamic interaction between depressive symptoms and HbA1c levels over time and (b) to determine if lifestyle-related behaviors (physical activity, smoking and diet) and cardiometabolic factors (blood pressure, HDL cholesterol, triglyceride, systemic inflammation and body mass index) mediate the longitudinal associations between depressive symptoms and HbA1c levels. We hypothesized a reciprocal relationship between depressive symptoms and HbA1c levels such that depressive symptoms affect HbA1c levels, which, in turn, influence depressive symptoms. In addition we hypothesized that both lifestyle-related behaviors and cardiometabolic factors would mediate the reciprocal associations between depressive symptoms and HbA1c.
Method
Design/setting and participants
Data come from ELSA, an ongoing national longitudinal study of community-dwelling adults aged ⩾50 years in England that began in 2002 (Demakakos et al. Reference Demakakos, Pierce and Hardy2010). The baseline ELSA sample was drawn from the Health Survey for England, which is representative of the English population living in private households, and included 12 100 participants. Interviews were conducted in-home and data are obtained by face-to-face interviews. Participants were re-assessed every 2 years. For the present analyses, data from wave 2 (2004–2005) was used as baseline because this was the first occasion that clinical assessments including blood samples were collected by a nurse in addition to the interviews. A total of 7666 people underwent a clinical assessment as part of wave 2; nurses collected anthropometric data, measured blood pressure and took blood samples. Blood samples were analyzed for biomarkers. Additional clinical assessments were conducted at wave 4 (2008–2009) and wave 6 (2012–2013). Participants completed demographic, depression and health-related measures at all waves. Most participants of the ELSA baseline cohort were of white ethnicity (97%). All participants provided full informed written consent to participate in the study and ethical approval was granted by the London Multi-centre Research Ethics Committee. For the present study we included those participants who were between 50 and 80 years of age, participated in all three clinical assessments and had at least two valid HbA1c measures and two valid depression assessments.
Measurements
The 8-item Center for Epidemiologic Studies Depression Scale (CES-D) scale was used to assess symptoms of depression. Participants were asked about feelings over the last week (e.g. felt depressed, felt sad, sleep was restless, felt lonely, everything was an effort, was happy, enjoyed life and could not get going), with binary response options (yes/no). Good psychometric properties have been reported for this scale in older adults (Turvey et al. Reference Turvey, Wallace and Herzog1999).
During the clinical assessments at waves 2, 4 and 6, weight, height and blood pressure were measured by a nurse and blood samples were taken from participants excluding those who were not willing to give written consent, those with bleeding disorders and those taking anticoagulant drugs. Blood samples were analyzed for HbA1c and other biomarkers (HDL cholesterol, triglyceride, C-reactive protein). Body mass index (BMI) was derived from the standard formula (kg/m2). Mean arterial blood pressure was defined as one-third of systolic blood pressure plus two-thirds of diastolic blood pressure. The analysis of the blood data was carried out in the Royal Victoria Infirmary (Newcastle-upon-Tyne, UK). Detailed information on the technicalities of the blood analysis have been described elsewhere (Becker et al. Reference Becker, Boreham, Chaudhury, Craig, Deverill, Doyle, Erens, Falaschetti, Fuller, Hills, Hirani, Jotangia, Mindell, Natarajan, Stamatakis, Wardle, Zaninotto, Sproston and Mindell2006).
Sociodemographic variables included age, sex, and education (highest education attainment: university degree or equivalent, less than university degree, or no qualification). Lifestyle variables included smoking status (current smoker or non-smoker), diet (portions of vegetables and fruits, classified into <5 portions, 5–10 portions, and >10 portions) and level of physical activity (sedentary, low, moderate, or high). Physical activity was a derived variable based on the combination of occupational and leisure activities that was classified using the Allied Dunbar National Fitness Survey (Health Education Authority and Sports Council, 1992).
Clinical variables included data on existence of any self-reported physician-diagnosis of cardiovascular conditions (angina, congestive heart failure, abnormal heart rhythm, heart murmur, heart attack, and stroke) and diabetes.
Analyses
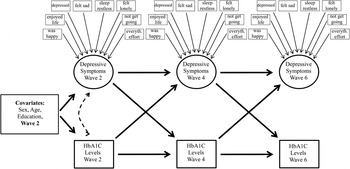
The relationship between depressive symptoms and HbA1c levels was estimated using structural equation models (SEM). An autoregressive cross-lagged panel approach was used to simultaneously test reciprocal associations. Structural equation modeling is an extension of regression analysis that allows both the modeling of latent variables and the simultaneous estimation of reciprocal relationships between two or more variables related to the outcome within one model, whereas simple regression models can only specify one response variable at a time. For example, depressive symptoms at wave 2 might predict HbA1c levels at wave 4, which in turn might predict depressive symptoms at wave 6. Depression at each time point was modeled as a latent variable with eight binary indicators (depressive symptoms). The use of latent variable technique for depression has the potential to reduce the impact of measurement error. Cross-lagged regression coefficients were used to examine the temporal relationship between depressive symptoms and HbA1c levels. Our theoretical model is presented in Fig. 1.
Cross-lagged theoretical regression models for the temporal relationship between depressive symptoms and HbA1c levels Rectangles represent measured variables, and circles represent latent constructs. Error terms are not included in the figure.

We first specified a stability model without interaction between depressive symptoms and HbA1c levels (without cross-lagged structural paths, i.e. model 1). This is a first-order autoregressive model in which depressive symptoms/HbA1c levels are represented as ‘causes’ of themselves over the two time points. Three more complex models with cross-lagged structural paths were generated to evaluate if a cross-lagged relationship between depressive symptoms and HbA1c levels results in a better model fit:
Model 2: a first-order autoregressive models for depressive symptoms/HbA1c levels and paths from depressive symptoms at time point t to HbA1c levels at time point t + 1 but no paths from HbA1c levels to depressive symptoms.
Model 3: a first-order autoregressive models for depressive symptoms/HbA1c levels and paths from HbA1c levels at time point t to depressive symptoms at time point t + 1 but no paths from HbA1c levels to depressive symptoms.
Model 4: a first-order autoregressive models for depressive symptoms/HbA1c levels and paths from HbA1c levels at time point t to depressive symptoms at time point t + 1 and paths from depressive symptoms at time point t to HbA1c levels at time point t + 1. (More details are presented in Supplementary Fig. S1.)
Models were compared for fit and a Wald test was used for model comparison. The best fitting model was retained for further examination.
Our model assumes that prospective relationships between depressive symptoms and HbA1c levels are stable over time. We modeled these assumptions by applying equality constraints to the autoregressive and cross-lagged paths. We controlled for age, sex and education at baseline in the four models by including those variables as predictors for depressive symptoms and HbA1c in our structural equation model. Regression pathways coefficients are presented and these coefficients can be interpreted as linear regression coefficients.
All analyses were conducted with MPlus (version 7.3) (Muthén & Muthén, Reference Muthén and Muthén2012). Because observed depression variables were dichotomous, the weighted least squares estimator with a diagonal weight matrix and robust standard errors and a mean- and variance-adjusted χ 2 test statistic (WLSMV) and theta parameterization (Muthén & Muthén, Reference Muthén and Muthén2012) were used for parameter estimation. A bootstrap approach was used for the estimation of the confidence intervals.
In a second step we evaluated the potential mediating role of lifestyle-related behaviors and cardiometabolic variables at wave 4 in the depression-HbA1c associations at waves 2 and 6 (Preacher & Hayes, Reference Preacher and Hayes2008). Lifestyle-related behavior was modeled as a latent variable with the indicator variables physical activity, smoking and diet. Cardiometabolic status was modeled as a latent variable with the indicator variables mean blood pressure, inflammation, HDL cholesterol, triglycerides and BMI. A SEM was fitted to estimate individual path coefficients simultaneously and to estimate the direct association between depressive symptoms at wave 2 and HbA1c at wave 6 and indirect associations through lifestyle-related behaviors and cardiometabolic variables at wave 4 (e.g. depression predicts lifestyle-related behaviors/cardiometabolic variables at wave 4, which in turn predict HbA1c at wave 6). Indirect associations coefficients were calculated by multiplying the standardized coefficients for the paths from the predictor to the mediator (e.g. depression to lifestyle-related behaviors/cardiometabolic variables) and from the mediators to the outcome (Preacher & Hayes, Reference Preacher and Hayes2008). We used the same approach to study mediation of the association between HbA1c at wave 2 and depressive symptoms at wave 6. Age, sex, education and depressive symptoms/HbA1c levels at wave 2 were included as additional predictors for the outcome at wave 6.
We did not model the reciprocal relationship between depressive symptoms and HbA1c levels in our mediation analysis in order to reduce the complexity of the models. We had no hypothesis regarding the reciprocal associations and associated mediating effects.
The general goodness of fit of each model was evaluated using the Comparative Fit Index (CFI) and the Root Mean Square Error of Approximation (RMSEA). Conventional rule of thumb suggest that a CFI of ⩾0.90 indicates adequate fit and ⩾0.95 indicates excellent fit and RMSEA of ⩽0.08 indicates adequate fit (⩽0.05 indicates excellent fit) (Marsh, Reference Marsh2004).
Sensitivity analyses
We refit our models using persons with incomplete data at one of the follow-ups to assess the impact on our results of those lost to follow-up. We also refit models with imputed values for missing covariates by generating multiple imputed values for the missing data from the variables used in the analysis (Asparouhov & Muthen, Reference Asparouhov and Muthén2010).
In additional analyses we evaluated if prevalent diabetes or cardiovascular conditions moderated the reciprocal relationship between depressive symptoms and HbA1c levels. We compared the fit of a model where the regression pathways were constrained to equality between those with diabetes or cardiovascular conditions and those without diabetes or cardiovascular conditions to an unconstrained model where all regression pathways were estimated freely for those with and without diabetes/cardiovascular conditions. Those two nested models were compared using the chi-square difference test (implemented using the DIFFTEST option in Mplus). A significant chi-square difference test would indicate a moderating effect of diabetes/cardiovascular conditions (MacKinnon et al. Reference MacKinnon, Lockwood, Hoffman, West and Sheets2002).
Results
A total of 9432 individuals participated in the wave 2 assessment and 6872 individuals were between 50 and 80 years of age and participated in the wave 2 clinical assessment (5293 individuals with valid HbA1c measures). The number of individuals who participated in all three clinical assessments, had at least two valid HbA1c measures, two valid depression assessments and were between 50 and 80 years of age at baseline was 2886. Approximately one-fifth (21%) of those participants had prediabetes (HbA1c levels between 5.7% and 6.4%) and 7% had diabetes (diagnosed diabetes or HbA1c levels of ⩾6.5) at baseline.
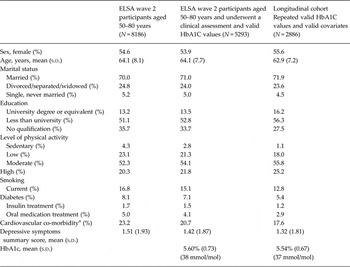
Table 1 presents sociodemographic and clinical baseline characteristics of participants who participated (a) at wave 2; (b) at the clinical assessment at wave 2; and (c) at the clinical assessments at waves 2, 4 and 6. Those individuals who participated at all three clinical assessments were more likely to be better educated, were more likely to have better lifestyle-related behaviors and less likely to have high depressive symptoms, diabetes and cardiovascular conditions than those who did not participate at all three clinical assessments.
Baseline demographic and clinical characteristics

a Cardiovascular co-morbidities included angina, congestive heart failure, abnormal heart rhythm, heart murmur, heart attack, and stroke.
Depression symptoms were stable over the follow-ups. HbA1c levels increased over time, the mean (s.d.) HbA1c levels at waves 2, 4 and 6 were 5.54 (0.67), 5.87 (0.64) and 5.93 (0.74), respectively.
The best model fit was obtained for the fourth model, which contained reciprocal relationships between depressive symptoms and HbA1c levels [CFI = 0.938; RMSEA = 0.044, 90% confidence interval (CI) 0.043–0.046]. The Wald tests also indicated the best fit for the fourth model presented in Fig. 1 (p < 0.001).
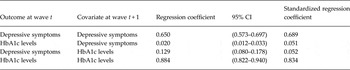
Cross-lagged regression coefficients and confidence intervals from the structural equation model are presented in Table 2. HbA1c level at one wave was a very strong predictor of HbA1c level at the next wave 2 years later, as suggested by the autoregressive coefficient: a standardized regression coefficient of 0.834 suggests that for a 1 standard deviation (s.d.) increase in HbA1c levels at wave t, subsequent HbA1c levels at wave t + 1 increased by 0.834 s.d. A similar association was observed for depressive symptoms (standardized regression coefficient of 0.689). A much weaker but significant association was observed between depressive symptoms and HbA1c levels: a 1 s.d. increase in the latent variable depressive symptoms at wave t was associated with a 0.052 s.d. increase in HbA1c levels at wave t + 1 while controlling for HbA1c levels at wave t and sociodemographic and clinical characteristics at wave 2.
Cross-lagged associations between depressive symptoms and HbA1c
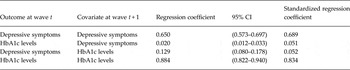
CI, Confidence interval.
All parameters were estimated simultaneously and all parameters were adjusted for age, sex and education. Equality constraints were used for the autoregressive and cross-lagged paths. The standardized coefficients were averaged across time intervals. The constraints were imposed on unstandardized coefficients, which led to slight variation in the resulting standardized coefficients.
A 1 s.d. increase in HbA1c levels at wave t was associated with a 0.051 s.d. increase in the latent variable depressive symptoms at wave t + 1 while controlling for depressive symptoms at wave t and sociodemographic and clinical characteristics at wave 2.
The temporal associations between depressive symptoms and HbA1c levels indicate a reciprocal relationship between these two variables. Our sensitivity analysis suggested that this association was not moderated by prevalent diabetes or cardiovascular conditions at wave 2 (χ 2 test for difference testing, p = 0.167).
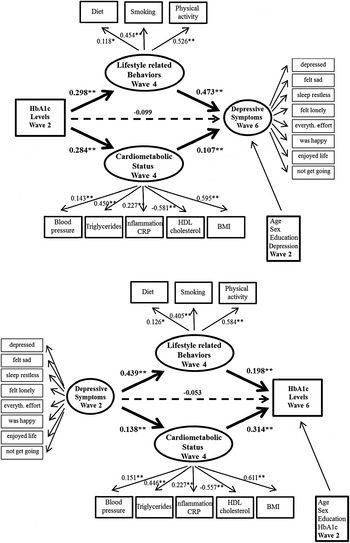
Results of the mediation analyses are presented in Fig. 2. In a first step we analyzed models without mediation: results suggested that depressive symptoms at wave 2 predicted HbA1c levels at wave 6 (standardized regression coefficient of 0.077, p < 0.01) even after controlling for age, sex, education, and HbA1c levels at wave 2. A similar association was observed for the other direction: HbA1c levels at wave 2 predicted depressive symptoms at wave 6 (standardized regression coefficient of 0.071, p < 0.01) even after controlling for age, sex, education, and depressive symptoms at wave 2. In a second step we included two latent variables at wave 4 as potential mediators. Results suggested that the association between depressive symptoms at wave 2 and HbA1c levels at wave 6 was mediated by both lifestyle-related behaviors and cardiometabolic status at wave 4 (model fit: CFI = 0.910; RMSEA = 0.058, 90% CI 0.056–0.060). The direct association between depressive symptoms and HbA1c levels was no longer significant, but depressive symptoms were a significant predictor for the two latent variables lifestyle-related behaviors and cardiometabolic status, which, in turn, predicted HbA1c levels. The standardized regression coefficients are presented in Fig. 2. The indirect association coefficients were small but significant: 0.087 (95% CI 0.003–0.171) for the indirect association through lifestyle-related behaviors and 0.043 (95% CI 0.019–0.067) for the indirect association through cardiometabolic status.
Lifestyle-related behaviors and cardiometabolic factors as potential mediators between depressive symptoms at wave 2 and HbA1c levels at wave 6 and between HbA1c levels at wave 2 and depressive symptoms at wave 6. Standardized regression coefficients are presented. Depressive symptoms, lifestyle-related behaviors and cardiometabolic status are modeled as latent variables, indicated by a circle. Error terms were modeled but were not included in the Figure. The direct association from depressive symptoms at wave 2 to HbA1c levels at wave 6 was not significant. The direct association from HbA1c levels at wave 2 to depressive symptoms at wave 6 was not significant. All parameters were estimated simultaneously with a structural equation model. **p < 0.001, *p < 0.05.

There was also evidence of mediation for the other direction: lifestyle-related behaviors and cardiometabolic status at wave 4 mediated the association between HbA1c levels at wave 2 and depressive symptoms at wave 6. The standardized regression coefficients are presented in Fig. 2. Coefficients were 0.141 (95% CI 0.028–0.254) for the indirect association through lifestyle-related behaviors and 0.030 (95% CI 0.010–0.051) for the indirect association through cardiometabolic status.
In our sensitivity analyses we found that the results were similar when including persons with missing covariates or with one missing depression HbA1c assessment (data not shown).
Discussion
In this longitudinal study of older people in the UK who were followed for 8 years, we have evaluated the temporal association between depressive symptom and glycated hemoglobin A1c levels. We found evidence for a reciprocal association between these two factors: depressive symptoms at baseline (wave 2) were associated with HbA1c levels at follow-up (wave 4) which in turn was associated with depressive symptoms at the next follow up (wave 6). HbA1c levels at baseline (wave 2) were associated with depressive symptoms at follow-up (wave 4) which in turn were associated with HbA1c levels at the next follow up baseline (wave 6). Furthermore, we found that both cardiometabolic factors and lifestyle-related behaviors might mediate the reciprocal association between depressive symptoms and HbA1c levels. To our knowledge, this is the first study to simultaneously estimate the longitudinal reciprocal associations between depressive symptoms and HbA1c levels and to evaluate mediators of these associations in a community based sample.
Methodological considerations
The main study strength is the repeated measurement of depressive symptoms and HbA1c levels as well as the availability of cardiometabolic variables in a large population-based sample of elderly people. Strengths of our analysis include a structural equation modeling approach that allowed us to model the dynamic relationship between depressive symptoms and HbA1c levels by estimating regression parameters simultaneously and to study mediation effects. Another advantage of this approach is to account for measurement error by including latent variables for depression, lifestyle-related behaviors and cardiometabolic factors rather than the using simple summary scores.
It is important to mention that the phrase ‘mediating effect’ is a convention in path and structural equation modeling and does not imply a claim of causality. For example, a direct association might not be causal but might be mediated by unidentified factors.
We acknowledge several study limitations. An important limitation is that depressive symptoms were assessed using a brief self-report scale, and not a diagnostic interview. The CES-D scale measures depressive symptoms experienced in the past week and does not account for history and treatment of depression. The short CES-D scale should therefore be considered as a global screening tool rather than a diagnostic tool. There was no information available regarding the use of antidepressant medication. In addition, lifestyle-related behaviors were also assessed by self-report, and so may be subject to some bias.
Attrition is always an issue in large elderly population cohorts such as ELSA. It is possible that participants with depression and/or somatic problems are more likely to leave the study, which might result in an underestimation of the underlying associations. A further issue with generalizability of the sample is that those people who took part in the clinical studies were likely healthier than the overall cohort due to restrictions placed upon eligibility for blood assessments.
The relatively long time interval (4 years) between predictor and outcome in the mediation analysis and the global assessment of lifestyle-related behaviors are also limitations. In addition, as in all observational studies, there could be unmeasured confounding by unknown or unmeasured predictors. For example, family history of depression or diabetes might be additional potential confounders. Diabetes specific complications such as neuropathy and nephropathy might mediate or moderate the depression-HbA1c relationship but these complications were not assessed. Finally, the applicability to other ethnic groups may be limited since the majority of the participants in the present study were white.
Depressive symptoms and HbA1c levels: autoregressive associations
The estimated autoregressive associations for depressive symptoms and HbA1c levels were positive and larger in magnitude than cross-lagged associations. Depression is often a recurrent condition. The strong autoregressive paths for depression are consistent with clinical evidence that a history of depression is a risk factor for future depressive episodes (Colman et al. Reference Colman, Naicker, Zeng, Ataullahjan, Senthilselvan and Patten2011). The strong autoregressive paths for HbA1c levels suggest a strong association between individual HbA1c levels over time. Specifically, HbA1c levels progressively increased over time, which was expected in an aging population and has been reported in other population based studies (Motta et al. Reference Motta, Bennati, Cardillo, Ferlito and Malaguarnera2010).
Reciprocal associations between depressive symptoms and HbA1c
Previous studies tend to examine depression and diabetes as either a predictor or an outcome to evaluate bidirectional relationships and those studies have used diagnostic categories for diabetes and depression (Mezuk et al. Reference Mezuk, Eaton, Albrecht and Golden2008; Nouwen et al. Reference Nouwen, Nefs, Caramlau, Connock, Winkley, Lloyd, Peyrot and Pouwer2011). Our results suggest a dynamic interaction between these two conditions: depressive symptoms might be a risk factor for elevated HbA1c levels, which in turn might be a risk factor for elevated depressive symptoms. The interaction coefficient was weak but significant. It is possible that only some forms of depression are associated with HbA1c levels. For example, chronic or recurrent depressive symptoms may produce an allostatic load, which might results in elevated HbA1c levels (McEwen, Reference McEwen2003). It is also not clear if the participant's knowledge of elevated HbA1c levels mediates the association between depressive symptoms and HbA1c level, since there is evidence that the depression-diabetes relationship might be different for people with diagnosed diabetes compared to those with undiagnosed diabetes (Nouwen et al. Reference Nouwen, Nefs, Caramlau, Connock, Winkley, Lloyd, Peyrot and Pouwer2011).
Depressive symptoms to HbA1c pathway
Our results suggest a weak but significant temporal relationship between depressive symptoms and HbA1c levels even after controlling for previous HbA1c levels and sociodemographic and clinical characteristics. The mediation analysis suggests that both lifestyle-related behaviors and cardiometabolic factors might play an important role in this association. Lifestyle behaviors such as physical activity, diet and smoking have been associated with HbA1c levels in population based surveys (Jansen et al. Reference Jansen, Stolk, Nolte, Kema, Wolffenbuttel and Snieder2013; O'Donovan et al. Reference O'Donovan, Hillsdon, Ukoumunne, Stamatakis and Hamer2013). There is also a large body of evidence demonstrating that people with depression are more likely to be physically inactive (Da Silva et al. Reference Da Silva, Singh-Manoux, Brunner, Kaffashian, Shipley, Kivimaki and Nabi2012), are less likely to comply with dietary and weight loss recommendations (Somerset et al. Reference Somerset, Graham and Markwell2011), have higher caloric intake (Markowitz et al. Reference Markowitz, Friedman and Arent2008), and are more likely to be smokers (Morrell & Cohen, Reference Morrell and Cohen2006). A possible mediating effect of lifestyle-related behaviors on the association between depression and diabetes has been suggested in other studies (Vimalananda et al. Reference Vimalananda, Palmer, Gerlovin, Wise, Rosenzweig, Rosenberg and Ruiz-Narvaez2014). Examining the potential mediating effects of cardiometabolic factors is a major contribution of our study. Cardiometabolic abnormalities such as hypertension, impaired glycemic control, systemic inflammation, adverse HDL cholesterol, adverse triglycerides, and obesity are well-recognized risk factors for elevated HbA1c levels, cardiovascular diseases and diabetes (Pearson et al. Reference Pearson, Mensah, Alexander, Anderson, Cannon, Criqui, Fadl, Fortmann, Hong, Myers, Rifai, Smith, Taubert, Tracy and Vinicor2003; Alberti et al. Reference Alberti, Eckel, Grundy, Zimmet, Cleeman, Donato, Fruchart, James, Loria and Smith2009; Nathan et al. Reference Nathan, Nathan, Balkau, Bonora, Borch-Johnsen, Buse, Colagiuri, Davidson, DeFronzo, Genuth, Holman, Ji, Kirkman, Knowler, Schatz, Shaw, Sobngwi, Steffes, Vaccaro, Wareham, Zinman, Kahn and Int Expert2009). Depression might be associated with these cardiometabolic abnormalities through several biological pathways (Tabak et al. Reference Tabak, Akbaraly, Batty and Kivimaeki2014). For example, depression has been associated with a dysregulation of the HPA axis and high cortisol levels, which have been related to obesity and glucose intolerance (Vogelzangs et al. Reference Vogelzangs, Suthers, Ferrucci, Simonsick, Ble, Schrager, Bandinelli, Lauretani, Giannelli and Penninx2007). Depression has also been associated with increased sympathetic nervous system activity and inflammatory markers, which are associated with cardiometabolic disturbances (Krishnan & Nestler, Reference Krishnan and Nestler2008; Dowlati et al. Reference Dowlati, Herrmann, Swardfager, Liu, Sham, Reim and Lanctot2010).
HbA1c to depressive symptoms pathway
A similar weak but significant temporal relationship was observed between HbA1c levels and depressive symptoms. Results suggest that both lifestyle-related behaviors and cardiometabolic factors might mediate this association. Population based studies have shown that individuals with elevated HbA1c levels (e.g. prediabetes and diabetes) have poorer lifestyle-related behaviors (Mezuk et al. Reference Mezuk, Johnson-Lawrence, Lee, Rafferty, Abdou, Uzogara and Jackson2013), which might increase the risk of developing depressive symptoms (Lopresti et al. Reference Lopresti, Hood and Drummond2013). There is also evidence that elevated HbA1c levels are associated with cardiovascular risk factors, including obesity, hypertension and low HDL cholesterol levels (Diaz-Redondo et al. Reference Diaz-Redondo, Giraldez-Garcia, Carrillo, Serrano, Javier Garcia-Soidan, Artola, Franch, Diez, Ezkurra, Manuel Millaruelo, Segui, Sangros, Martinez-Candela, Munoz, Goday and Regidor2015), which might increase the risk of developing depressive symptoms (Pan et al. Reference Pan, Sun, Okereke, Rexrode, Rubin, Lucas, Willett, Manson and Hu2012b ).
Our findings suggest a dynamic relationship between depressive symptoms and hemoglobin A1c levels and potential mediating effects of lifestyle-related behaviors and cardiovascular risk factors. This has important implications for investigating the pathways which could link depressive symptoms and increased risk of diabetes. Focusing on depressive symptoms alone might not be an appropriate prevention strategy for type 2 diabetes. Lifestyle-related behaviors and cardiometabolic factors should be considered at the same time. Collaborative care for people with depressive symptoms, poor lifestyle-related behaviors and cardiometabolic risk factors might be an appropriate prevention strategy and might also improve health outcomes in people with diabetes (Katon et al. Reference Katon, Lin, Von Korff, Ciechanowski, Ludman, Young, Peterson, Rutter, McGregor and McCulloch2010; Van der Feltz-Cornelis et al. Reference Van der Feltz-Cornelis, Nuyen, Stoop, Chan, Jacobson, Katon, Snoek and Sartorius2010). For example, a recent meta-analysis found that collaborative care for depression improved both glycaemia outcomes and depression in people with co-morbid depression and diabetes (Atlantis et al. Reference Atlantis, Fahey and Foster2014).
Supplementary material
For supplementary material accompanying this paper visit http://dx.doi.org/10.1017/S0033291715002445.
Acknowledgements
We gratefully acknowledge the UK Data Archive for supplying the ELSA data. ELSA was developed by a team of researchers based at University College London, the Institute of Fiscal Studies and the National Centre for Social Research. The data creators or the funders of the data collections and the UK Data Archive do not bear any responsibility for the analyses or interpretations presented here.
ELSA is funded by the US National Institute on Aging (NIA) and a consortium of UK Government departments. N.S. was supported by grants from the Canadian Institutes of Health Research (MOP-84574 and MOP-130552). S.D. is supported by a fellowship from the Fonds de recherche du Québec – Santé, Canada and R.B. is supported by a fellowship from the Canadian Institutes of Health Research. The funding agencies had no role in the design or conduct of the study, in the collection, management, analysis, or interpretation of the data, or in the preparation, review, or approval of the manuscript.
Declaration of Interest
None.