1. Introduction
The most famous biogenic reefs of Baltoscandia are situated on the Baltic islands of Gotland, Sweden and Saaremaa, Estonia. These highly diverse reefs grew during the Silurian Period. Since at least the mid-twentieth century they have been known to form a barrier-like belt across the Baltic Basin (see reviews in e.g. Manten, Reference Manten1971; Flodén et al. Reference Flodén, Bjerkéus, Tuuling and Eriksson2001). Today, the Silurian reefs are considered to be an integral part of an extensive carbonate platform that evolved along the shelf areas at the southwestern margin of the Baltic Shield and the East European Platform (e.g. Calner, Jeppsson & Munnecke, Reference Calner, Jeppsson and Munnecke2004; Kaminskas, Michelevičius & Blažauskas, Reference Kaminskas, Michelevičius and Blažauskas2015). In contrast, the Ordovician reefs of the Baltoscandian region are less well known and are generally considered to have a more or less sporadic distribution in time and space (e.g. Webby, Reference Webby and Bruton1984, Reference Webby, Kiessling, Flügel and Golonka2002; Cocks & Torsvik, Reference Cocks and Torsvik2005). Ordovician reef growth across Baltoscandia has often been linked to specific events and/or the general palaeolatidunal shift of Baltica towards the equator (e.g. Jaanusson, Reference Jaanusson1973; Webby, Reference Webby and Bruton1984, Reference Webby, Kiessling, Flügel and Golonka2002; Cocks & Torsvik, Reference Cocks and Torsvik2005).
The Ordovician Baltoscandian reefs are part of the larger story of the evolution of Baltica, which gained its identity as a distinctive palaeocontinent during Precambrian time and merged with Laurentia during the Silurian Caledonian orogeny. The palaecontinent consisted of two main cratonic areas: the Baltoscandian or Fennoscandian; and the East European craton (Cocks & Torsvik, Reference Cocks and Torsvik2005). Between the two cratons, the large peri-cratonic Baltic Basin extended with thick sedimentary successions preserved across the southern and central part of the Baltic Sea and from the St Petersburg area towards Poland (Poprawa et al. Reference Poprawa, Sliaupa, Stephenson and Lazauskiene1999; Fig. 1). Other important peri-cratonic basins developed on Baltica along todays’ eastern margin of the palaeocontinent in the Timan–Pechora area and at the western slope of the Urals (Klimenko, Anischenko & Antoshkina, Reference Klimenko, Anischenko and Antoshkina2011). During Ordovician time, Baltica's eastern margin faced north and was generally closer to the equator (Cocks & Torsvik, Reference Cocks and Torsvik2005). Extensive barrier-reef complexes developed during late Katian time along these palaeo-northern shelf edges (Antoshkina, Reference Antoshkina1996, Reference Antoshkina1998). In earlier compilations such reef complexes were not mentioned from the palaeo-SW epicratonic areas of Baltoscandia. But was this really the case? Ordovician barrier-reef-type complexes were described from seismic profiles from areas in the central Baltic Sea (Tuuling & Flodén, Reference Tuuling and Flodén2000). What kind of spatio-temporal pattern would emerge by mapping all the Ordovician reefs and mounds described in the literature?
Palaeogeographic reconstruction of the Baltica palaeocontinent during Late Ordovician time (modified from Cock & Torsvik, Reference Cocks and Torsvik2005).

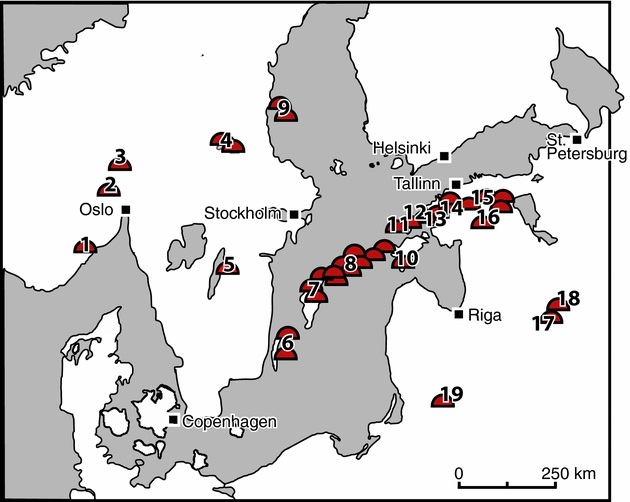
Here we review the complete record of reefs and mounds described from the Ordovician successions of Baltoscandia (Fig. 2). With our review we are able to demonstrate that widespread reef and mound growth was part of the regional Ordovician story, and that reefs and mounds shaped the formation of the carbonate platform in the Baltic Basin.
Map of Baltoscandia with Ordovician reef and mound locations discussed in text. 1. Steinvika Formation, Skien-Langesund area; 2. Ullerntangen, Tyrifjorden; 3. Mjøsa Formation, Nes-Hamar; 4. Kullsberg and Boda formations, Lake Siljan district; 5. subsurface Östergotland; 6. subsurface east Öland; 7. subsurface Gotland; 8. subsurface central Baltic; 9. subsurface Bothnian Sea; 10. subsurface Saaremaa Island; 11. subsurface Vormsi Island; 12. Hoitberg and Niibi, Moe Formation; 13. Ruunavere, Moe Formation; 14. Vasalemma Formation; 15. Ärina Formation; 16. Võhma and Jõgeva, Pirgu Stage; 17. Ludze, Adila Formation; 18. Malta, Adila Formation; 19. Pamituvys, Pirgu and Porkuni stages.

The references compiled for this review range from detailed published descriptions of complete depositional settings in surface exposures and drill cores, to reports of reflection profiles and to notes in unpublished field books of Estonian geologists. Additionally, we have complemented some listings in the literature with new detailed sedimentological and stratigraphical investigations. The resulting spatio-temporal occurrence pattern is highly uneven, not because of local differences in research effort – the entire region is well mapped by surface and subsurface data – but because of primary sedimentary differences and the present-day extent of Ordovician strata.
The results of this review also demonstrate that no direct inferences can be drawn from a simple diagram that would sum up the expansion and abundance of reefs in the Ordovician sediments of Baltoscandia. Today the original reef distribution is heavily biased and selectively degraded by large-scale erosion of the more proximal and coastal areas of the epicontinental basin. The recent northern limit of Palaeozoic sediments on the crystalline basement of the Fennoscandian shield is represented by a more than 1200 km long Cenozoic erosional escarpment, the Baltic Klint (e.g. Tuuling & Flodén, Reference Tuuling and Flodén2010). Only a few locally restricted occurrences preserve and expose Ordovician deposits on the Swedish mainland, in the Bothnian Sea, and at the Åland Islands in the central Baltic Sea. The mounds and reefs are often concentrated in the regions close to the Baltic Klint and in isolated areas on the Fennoscandian shield north and west of the Baltic Klint. These areas were more proximally positioned during Ordovician time than most of the regions south of it.
We reconstruct the actual spatial and stratigraphic distribution of Baltoscandian reefs from an original pattern that was subsequently eroded in a non-random way. Our reconstructions may encourage palaeobiologists to test hypotheses about the controlling factors of the reef formation in Baltica such as climate, tectonics, oceanography and ecosystem stability.
2. Methods
Most of the data included here were compiled from peer-reviewed journal articles, published reports, PhD theses and archived field notes (online Supplementary Table S1, available at http://journals.cambridge.org/geo). The resulting data compilation represents the complete publicly available knowledge of reefs in Ordovician strata of the Baltoscandian region.
New information and data were collected from the Võhma drill core section (58.612260°N, 58.612260°E), Viljandi County, central Estonia (Fig. 2). The core section is preserved in 90 core boxes at Tallinn Technical University Särghaua field station. For this review the Võhma drill core section was logged based on core, polished slabs where produced at Tallinn Technical University and thin-sections generated at the GeoCenter of Northern Bavaria in Erlangen (Germany). Detailed sedimentological and palaeontological descriptions will be published elsewhere.
We present a new carbon isotope dataset for the Võhma drill core. A total of 128 samples were drilled and analysed to develop a detailed middle Katian through early Hirnantian δ13Ccarb curve (Nabala through Porkuni stages) across the mound-bearing interval (online Supplementary Table S2, available at http://journals.cambridge.org/geo). The carbonate powders were reacted with 100% phosphoric acid at 70°C using a Gasbench II connected to a ThermoFinnigan Five Plus mass spectrometer. The analyses were carried out at the Laboratory of M. Joachimski at the Geocenter of Northern Bavaria in Erlangen (Germany), and all values are reported in per mil relative to V-PDB (Vienna Pee Dee Belemnite) by assigning a δ13C value of +1.95‰. Accuracy and precision were controlled by replicate measurements of laboratory standards and were better than ±0.2‰ for the carbon isotope data (0.13‰ in an average).
δ13C chemostratigraphy is generally accepted as a powerful tool for the correlation of Baltoscandian Middle and Late Ordovician carbonate successions (e.g. Ainsaar, Meidla & Martma, Reference Ainsaar, Meidla and Martma2004; Kaljo, Martma & Saadre, Reference Kaljo, Martma and Saadre2007; Ainsaar et al. Reference Ainsaar, Kaljo, Martma, Meidla, Männik, Nõlvak and Tinn2010; Bergström et al. Reference Bergström, Saltzman, Leslie, Ferretti and Young2015). Based on lithostratigraphy and the δ13C data, we can confidently correlate the Võhma drill core section with other sections in the eastern Baltic area and across Balticoscandia.
The diversity estimates are based on queries from the Palaeobiology Database (https://paleobiodb.org/) from 03/2015 (for occurrences of Boda Limestone and Kullsberg Limestone Formations), and from the Estonian geocollections database SARV (http://geokogud.info/) from 04/2015 (for occurrences in Estonia). The records of the Palaeobiology Database represent the complete set of published palaeontological literature about the target interval and region, and were largely entered by one of the authors of this review (BK). The SARV database comprises the complete set of taxonomically determined specimens in the geocollections of Estonia (see http://geokogud.info/).
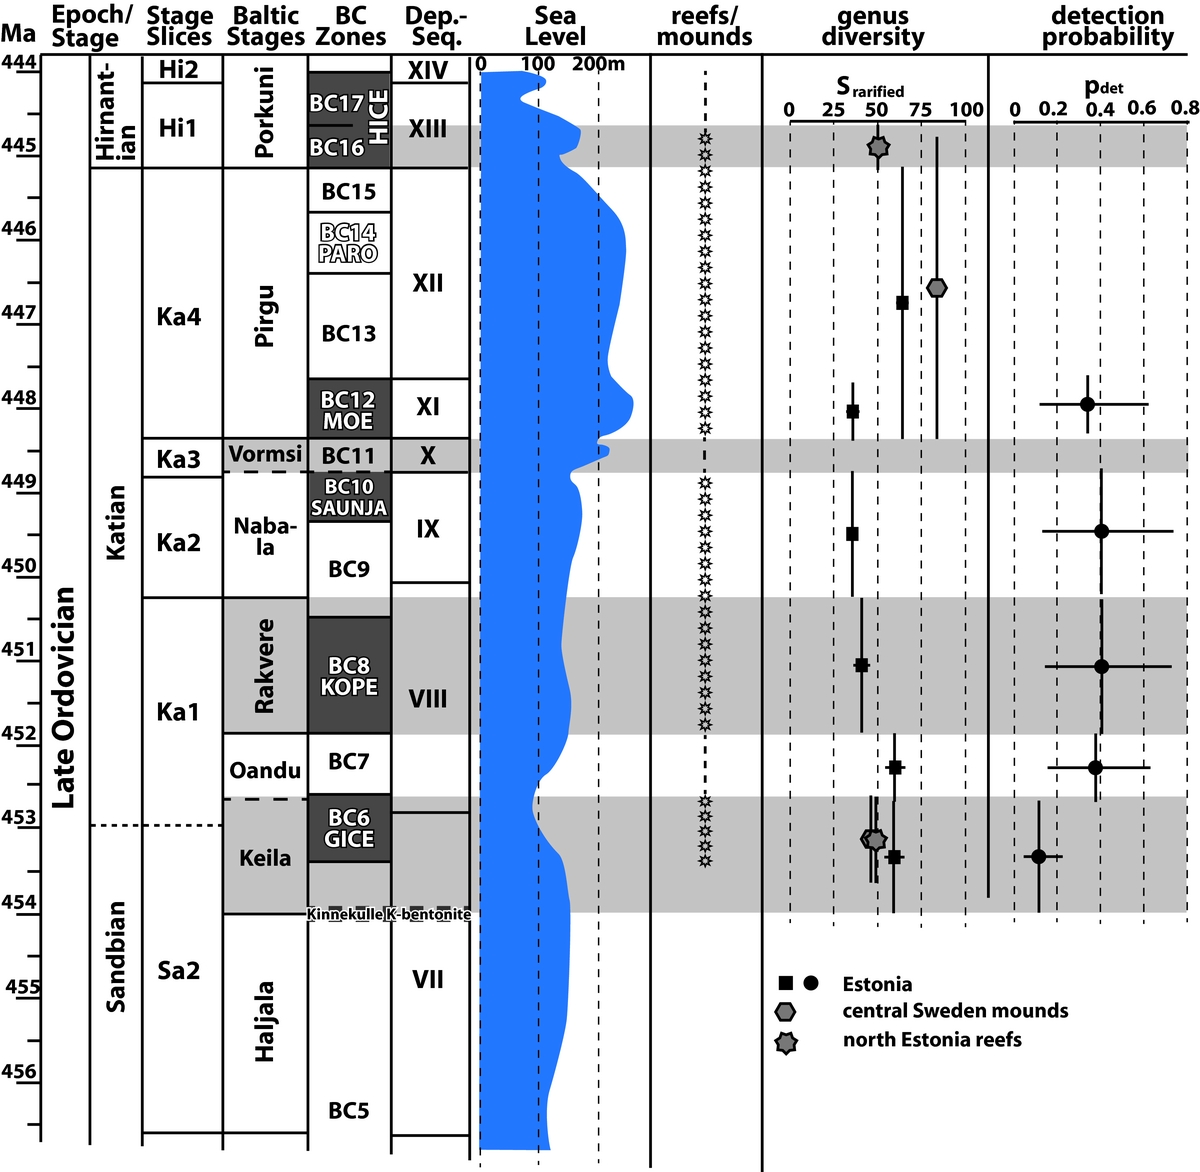
The diversity estimates were calculated by rarefaction with the R-package Vegan (J. Oksanen et al., http://CRAN.R-project.org/package=vegan, 2013). Additionally, detection probabilities of genera were calculated based on occupancy modelling (MacKenzie et al. Reference Mackenzie, Nichols, Hines, Knutson and Franklin2003; MacKenzie, Bailey & Nichols, Reference Mackenzie, Bailey and Nichols2004), a Capture-mark-recapture (CMR) method with the R-package unmarked 0.10-5 (Fiske & Chandler, Reference Fiske and Chandler2011). For a general introduction to CMR approaches in palaeontology see Liow & Nichols (Reference Liow, Nichols, Alroy and Hunt2010). Here we compiled the Estonian occurrences of genera downloaded from the SARV database within selected time slices (Keila, Oandu, Rakvere and Nabala stages and Moe Formation). We grouped the collections in ‘sites’ (groups of localities which are nearby, Vasalemma settlement, Rakvere city, Ristna, etc). The individual collections, such as Vasalemma Nordkalk quarry, Vasalemma rallye quarry, Vaselemma drill core 1044, etc., then represented ‘replicates’ of one site. The database was not sufficient in order to calculate reliable occupancy estimates as the resulting confidence intervals were too large, but the detection estimates provide important information (Table 1). We assume no significant differences in sampling effort between the samples of the different time slices and, as a consequence, interpret the detection probability as a proxy for the relative taxon abundance within the sites. High detection probabilities are interpreted as indicating higher average abundances of taxa in the respective time slice.
Genus diversity estimates and results of occupancy modelling of genera. n occs, number of occurrences; r obs, observed richness; S rare, rarified diversity; S SQS, subsampled diversity after Shareholder Quorum Subsampling (Alroy 2010); n sites/n collections, number of sites and collections (‘replicates’) used for occupancy modelling (see Section 2 on Methods). Mean naïve occupancy is the mean proportion of number of genera per sample/total number of genera; p det, detection probability.

The stratigraphic correlation is based on published reports on bio-, litho- and chemostratigraphy of the target intervals (e.g. Ainsaar et al. Reference Ainsaar, Kaljo, Martma, Meidla, Männik, Nõlvak and Tinn2010; Bergström et al. Reference Bergström, Schmitz, Saltzman and Huff2010a ; Bauert et al. Reference Bauert, Isozaki, Holmer, Aoki, Sakata and Hirata2014; Ebbestad et al. Reference Ebbestad, Högström, Frisk, Martma, Kaljo, Kröger and Pärnaste2015). Additionally, stratigraphical gaps were identified in individual sections. In most of the sections non-deposition and erosion prevailed and only parts of the transgressive and highstands intervals of the third- and fourth-order depositional sequences are recorded (e.g. Dronov et al. Reference Dronov, Ainsaar, Kaljo, Meidla, Saadre and Einasto2011; Nielsen, Reference Nielsen2011). In our correlation schemes the identifiable gaps within the individual sections have been incorporated as empty intervals in the graphical depiction. The absolute lengths of the gaps, however, are unknown. The depictions therefore give only a rough estimate of the pattern of deposition and non-deposition. This method was inspired by Ernst et al.’s (Reference Ernst, Niebuhr, Wiese, Wilmsen, Reitner, Neuweiler and Gunkel1996) ‘Lückenstratigraphie’ of the Late Cretaceous sediments across Europe (see also Wilmsen, Reference Wilmsen2012).
3. An account of Baltoscandian reef and mud mound occurrences
3.a. Pre-Katian reefs and mud mounds
3.a.1. Lower Ordovician Hecker-type mud mounds of the St Petersburg region
Almost all bioherms known from Baltoscandia and its vicinity are Late Ordovician in age (Fig. 3). There is only one exception: the mud mounds in the glauconitic limestone of the Billingen–Volkhov stages (late Floian–Dapingian) in the St Petersburg region (Federov, Reference Fedorov2003). A number of c. 15 individual mounds were listed by Tolmacheva, Fedorov & Egerquist (Reference Tolmacheva, Fedorov and Egerquist2003). The mounds form flat structures with diameters of up to more than 100 m and maximum thicknesses of no more than 5 m. These specific morphologies are considered to be caused by in situ concentrations of siliceous sponges, their microbial decay and formation of automicrite, and are termed Hecker-type mounds (Fedorov, Reference Fedorov2003). Currently no evidence exists that these types of mounds were more widespread across the Baltic Basin or adjacent epicratonic areas.
Overview of characters of main Ordovician reef and mound occurrences. Note the widespread role of microbial binders in all better-known localities. See also Figure 4.

3.a.2. An isolated ‘atoll-reef’ south of Stockholm, Sweden
Flodén et al. (Reference Flodén, Bjerkéus, Tuuling and Eriksson2001) mentioned an ‘atoll-reef’ along the syndepositional rim of the Tvären meteorite crater south of Stockholm, Sweden. The existence of this reef is highly questionable. Flodén et al. (Reference Flodén, Bjerkéus, Tuuling and Eriksson2001) refer to a paper by Lindström et al. (Reference Lindström, Flodén, Grahn and Kathol1994), where biohermal deposits are not mentioned but instead a faunal list of the upper third of the crater infill is given with a ‘diversified biota include abundant pelmatozoan echinoderms, bryozoans, major brachiopods, trilobites, and ostracodes, as well as calcareous algae, collectively suggesting that living conditions on the upper part of the rim wall may have been reef-like’ (Lindström et al. Reference Lindström, Flodén, Grahn and Kathol1994, p. 101). The infill is time equivalent to the Sandbian Dalby Limestone (Kukruse Stage), and evidence for biohermal sediments do not exist. Instead a detailed analysis of the infill by Frisk & Harper (Reference Frisk and Harper2013) suggests that faunal elements existed that lived on a hard substrate at the crater ring during the time of deposition of the crater infill. Details about the specific crater rim are not known.
3.b. Late Sandbian – early Katian reefs and mud mounds
The late Keila – early Oandu Regional Stage interval records the first widespread occurrences of reefs and mounds in Baltoscandia (time-equivalent to the Chatfieldian Regional Stage in North America, and Sa2/Ka1 Stage Slice of Bergström et al. Reference Bergström, Chen, Gutiérrez-Marco and Dronov2009). Framework reefs of this time interval are exposed in several places in Norway and Estonia, and mud mounds are exposed in the Siljan area, central Sweden (Figs 2, 3). Subsurface occurrences of mud mounds were reported from Östergötland, Sweden and the Bothnian Sea.
3.b.1. Reefs of the Steinvika and Mjøsa Limestones, Norway
Late Sandbian – early Katian reefs occur in two distinct areas in the Ordovician of the Oslo region: in the Steinvika Limestone of the Skien-Langesund district; and in the Mjøsa Limestone of the Toten and Nes-Hamar districts (Fig. 2). In both areas the reefs developed in a nearly contemporaneous interval during earliest Katian time (Harland, Reference Harland1981; Owen et al. Reference Owen, Bruton, Bockelie and Bockelie1990; Bergström et al. Reference Bergström, Schmitz, Young and Bruton2010b , Reference Bergström, Schmitz, Young and Bruton2011 b; see Section 4.b below).
Three types of patch reefs and an additional larger reef complex can be distinguished. (1) In the Furnesfjorden Member of the Mjøsa Limestone up to 15 m thick reefs occur, which are formed by loose clusters of large nodular colonies of the chaetetid sponge Solenopora with occasional occurrences of the tabulate Eofletcheria irregularis (Opalinski & Harland, Reference Opalinski and Harland1981). (2) In the Eina and Bergevika Member of the Mjøsa Limestone patch reefs with thicknesses of c. 5 m and diameters of up to 20 m occur which, in their lower parts, are built by E. irregularis, clusters of Solenopora and the green algae Vermiporella. In the upper parts the reefs are mainly built by domal labechiid stromatoporoids (Labechia, Pachystylostroma, Radiostroma; see Webby, Reference Webby1979) and massive tabulates (Lyopora) (Harland, Reference Harland1981; Opalinski & Harland, Reference Opalinski and Harland1981). (3) In the Bunes Member of the Steinvika Limestone up to 35 m wide patch reefs occur, which are characterized by abundant echinoderm holdfasts. In the lower parts these reefs were formed mainly by echinoderm holdfasts and microbial limestone; in the middle part E. irregularis is more common; and in the upper parts domal stromatoporoids and large massive closely packed tabulates (Tryplasma, Lyopora) dominate. (4) A more than 50 m wide massive reef complex occurs in the Bergevika Member of the Mjøsa Limestone. The reef is in central and upper parts built by massive domal labechiid stromatoporoids. In more marginal areas algae such as Dimorphosiphon, Vermiporella and the problematic Girvanella, and tabulates such as Eofletcheria and Catenipora, are locally common components.
All four reef types formed on local shoals and banks of pelmatozoan grainstone, and this grainstone partly also occurs in the direct flanks of the reef bodies. Another aspect the four reef types have in common is the relatively high percentage of frame builders. The percentage of matrix, such as microbialites, wackestone and biodetritic limestone, is on average c. 40% (P. R. Opalinski, unpubl. PhD thesis, University of Liverpool, 1977, fig. 5.16; see online Supplementary Table S1, available at http://journals.cambridge.org/geo). The reefs represent cluster-frame reefs in the terminology of Riding (Reference Riding2002). Harland (Reference Harland1981) interpreted the depositional setting of the patch reefs as ‘within inshore shelf’ and the larger massive reef complex in the Bergevika Member as deposited at the outer edge of an inshore shelf. The reefs were probably part of the local carbonate platform in the present SW of the hypothetical Telemark Land.
3.b.2. Reefs of the Vasalemma Formation, Estonia
The Vasalemma Formation is distributed and exposed exclusively in an area SW of Tallinn in the vicinity of the settlements Vasalemma and Saku. There, in a narrow 30 km WSW–ENE-striking and 5 km N–S-aligned belt, the pelmatozoan grainstone facies of the Vasalemma Formation was deposited (Fig. 2). The belt is delimited towards the north by the northern boundary of the outcrop area and towards the south by a depositional gap of time-equivalent deposits. Within the massive, up to 15 m thick Vasalemma Formation, patch reefs were formed locally with diameters of up to 50 m and thicknesses of up to 15 m (see Kröger, Hints & Lehnert, Reference Kröger, Hints and Lehnert2014 for review). The reefs are generally composed of a bryozoan and echinoderm framestone to bindstone, with Hemiscosmites holdfasts and encrusting bryozoans as main metazoan constructors; locally, receptaculitids were important additional bafflers (Kröger, Hints & Lehnert, Reference Kröger, Hints and Lehnert2014, Fig. 4a). At the top of the reefs large colonies of Eofletcheria orvikui are common. The reefs are relatively matrix rich with matrix contents of 50–70%. The matrix of the reefs is generally composed of a mottled microbialite, and microbially controlled early lithification played a major role for the formation of the Vasalemma reefs (Kröger, Hints & Lehnert, Reference Kröger, Hints and Lehnert2014). New palaeogeographical reconstructions assumed that the reefs formed in the central parts of the shallow Estonian shelf which was highly differentiated into local shallow basins and shoals, and which probably extended further to the NW in areas in where Late Ordovician deposits are eroded today (Kröger, Hints & Lehnert, Reference Kröger, Hints and Lehnert2014).
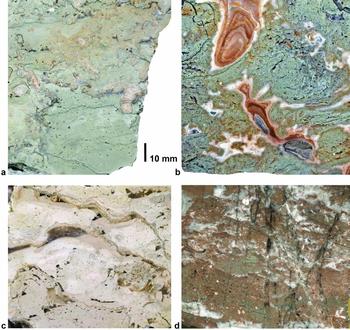
Examples of core limestones of selected Ordovician mud mounds and reefs. All samples are mainly composed of a mosaic of fenestral microbial wackestone to mudstone and patches of allochthonous wackestone. The reefs differ in containing a substantial amount of bryozoans and/or echinoderms, which functioned as sediment binders. (a) Vasalemma Formation, late Sandbian – early Katian, Nordkalk Quarry, Vasalemma, Estonia with synsedimentary cave filling (spicule-rich mudstone) with ramose and encrusting bryozoans. (b) Võhma mud mound, late Katian, Võhma drillcore, Estonia with large stromatactis cavities filled with multiple generations of cement. (c) Siuge Member, Ärina Formation, Hirnantian, Porkuni, Estonia with encrusting bryozoans.

3.b.3. Mud mounds of the Kullsberg Limestone Formation, Lake Siljan area, central Sweden
A number of c. 35 individual Late Ordovician mud mound structures (Jaanusson, Reference Jaanusson1982) are preserved in the sedimentary fill of the ring-like graben system around the central uplift of the Late Devonian Siljan impact crater in central Sweden (Juhlin & Pedersen, Reference Juhlin and Pedersen1987; Jourdan, Reimold & Deutsch, Reference Jourdan, Reimold and Deutsch2012; Fig. 2). The outer diameter of this ring graben is c. 52 km wide and represents the only Early Palaeozoic sediments preserved in an extensive area in central Sweden where only crystalline basement is exposed. The mounds formed during two distinctive periods during the earliest Katian (Kullsberg Limestone mounds, referred to here as simply Kullsberg mounds) and latest Katian – earliest Hirnantian (Boda Limestone mounds or Boda mounds).
The two generations of mounds have several features in common; both are composed of massive stromatactis limestone (Ross, Jaanusson & Friedman, Reference Ross, Jaanusson and Friedman1975; Jaanusson, Reference Jaanusson1978; Bathurst, Reference Bathurst1982; Riding, Reference Riding2002; Tobin, Bergström & De La Garza, Reference Tobin, Bergström and De La Garza2005; Kröger, Ebbestad & Lehnert, Reference Kröger, Ebbestad and Lehnert2016) and a flank region composed of coarse-grained pelmatozoan wacke-, pack- and grainstone (Paul & Bockelie, Reference Paul and Bockelie1983; Calner, Lehnert & Joachimski, Reference Calner, Lehnert and Joachimski2010; Kröger Ebbestad & Lehnert, Reference Kröger, Ebbestad and Lehnert2016). The Kullsberg mounds are smaller in dimensions (c. 40–50 m thick and up to 350 m wide; Jaanusson, Reference Jaanusson1982) and are less abundant (11 mounds are listed in Jaanusson, Reference Jaanusson1982; Ebbestad & Högström, Reference Ebbestad and Högström2007), and the facies and fauna of the Kullsberg mounds is little studied (Jaanusson, Reference Jaanusson1982; Calner, Lehnert & Joachimski, Reference Calner, Lehnert and Joachimski2010). The occurrence of dasycladacean green algae, Solenopora and fragments of Girvanella, as well as the presence of cross-bedded pelmatozoan grainstone lithologies and disarticulated ostracods indicate relatively high-water current energies and depths of <50 m for the deposition of the Kullsberg mounds (Tobin, Bergström & De La Garza, Reference Tobin, Bergström and De La Garza2005).
3.b.4. Poorly known mud mounds in the Bothnian Sea, east of Öland and in Östergötland, Sweden
Occurrences of mud mound complexes, probably of the same age as those in the Kullsberg Limestone (earliest Katian), were reported from the southern Bothnian Sea (Winterhalter, Reference Winterhalter1972; Söderberg & Hagenfeldt, Reference Söderberg and Hagenfeldt1995) and from the subsurface of Östergötland (Jaanusson, Reference Jaanusson1979; Fig. 2). The short reports are based on seismic profiles and no details about sizes, specific ages and composition of the structures are given. Several isolated mud mound structures were also identified in a subsurface area offshore east of Öland (Flodén, Reference Flodén1980). The structural position of these mounds suggests an earliest Katian age, probably time equivalent to the Kullsberg Limestone in central Sweden.
3.c. Middle Katian mud mounds
Few reports of middle Katian Baltoscandian mud mounds and no reports of middle Katian framework reef exist, but indirect evidence suggests that algal-rich mud mounds of a Nabala–Rakvere Stage age (time quivalent to Ka2 and Ka3 Stage Slices of Bergström et al. Reference Bergström, Chen, Gutiérrez-Marco and Dronov2009) are or were widespread in the Central Baltic and Bothnian Sea.
In the subsurface of Gotland a horizon with mud mounds with a thickness of tens of metres occurs in drill cores, which is called the Liste mound horizon (Liste Member of the Östersjö Formation; Bergström, Löfgren & Grahn, Reference Bergström, Löfgren and Grahn2004). Chitinozoans and conodonts indicate the Fungochitina spinifera and Amorphognathus superbus biozones for the Liste mounds (Bergström, Löfgren & Grahn, Reference Bergström, Löfgren and Grahn2004; Sivhed et al. Reference Sivhed, Erlström, Bojesen-Koefoed and Löfgren2004). This is time equivalent to the upper part of the Slandrom Limestone, Nabala Stage (Bergström, Löfgren & Grahn, Reference Bergström, Löfgren and Grahn2004). The Liste mounds are stromatolitic mud mounds, partly rich in bryopsidalean green algae similar in lithology to the mud mounds of the Pirgu Regional Stage in the same region (Sivhed et al. Reference Sivhed, Erlström, Bojesen-Koefoed and Löfgren2004; see Section 3.d.2).
Additionally, in the central Baltic area seismic profiles indicate the presence of few reefs or mounds in a horizon below the prominent reflector O4–5 (below Vormsi Stage, Tuuling & Flodén, Reference Tuuling and Flodén2000) and it was speculated that these are time equivalent to the Kullsberg mounds (Tuuling & Flodén, Reference Tuuling and Flodén2010). However, the exact stratigraphic age of these structures is not known and the possibility exists that some of them are of Rakvere–Nabala age.
Limestone boulders with bryopsidalean green algae (e.g. Vermiporella, Palaeoporella) framestone to bafflestone lithologies are known from within Pleistocene sediments across the southern Baltic and central Sweden (Wiman, Reference Wiman1908; Hucke & Voigt, Reference Hucke and Voigt1967; Kozlowski & Kazmierczak, Reference Kozlowski and Kazmierczak1968). The algal limestone boulders belong to the so-called Baltic Limestone, Ostseekalk of the older literature, and the Östersjö and File formations of the Central Baltic and Bothnian Sea (Bergström, Löfgren & Grahn, Reference Bergström, Löfgren and Grahn2004). Biostratigraphic data indicate that a significant amount of this limestone is time equivalent to Rakvere–Nabala Regional Stage (Wiman, Reference Wiman1908; Hucke & Voigt, Reference Hucke and Voigt1967; Bergström, Löfgren & Grahn, Reference Bergström, Löfgren and Grahn2004). The only in situ occurrences of similar algal framestone–bafflestone lithologies are known from Pirgu Stage mud mounds across the Baltoscandian region. It can be concluded that similar, but older, Rakveran–Nabalan age, algal-rich mud mounds occur and occurred in the central Baltic – Bothnian Sea area.
3.d. Late Katian reefs and mud mounds
Late Katian, Pirgu Stage (time equivalent to Ka4 of Bergström et al. Reference Bergström, Chen, Gutiérrez-Marco and Dronov2009) reefs and mud mounds are most widespread across Baltoscandia and a variety of reports exist from outcrops, drill cores and seismic data that provide a detailed picture of that time interval.
3.d.1. Mud mounds of the Boda Limestone Formation, Lake Siljan area, Sweden
More than 20 individual mud mound structures exist in the ring-like graben system of the Siljan impact crater that belong to the late Katian – early Hirnantian Boda Limestone Formation (Jaanusson, Reference Jaanusson1982; see also Section 3.b.3 and Fig. 2). The mounds are composed of massive stromatactis limestone (Ross, Jaanusson & Friedman, Reference Ross, Jaanusson and Friedman1975; Jaanusson, Reference Jaanusson1978; Bathurst, Reference Bathurst1982; Riding, Reference Riding2002; Tobin, Bergström & De La Garza, Reference Tobin, Bergström and De La Garza2005; Kröger, Ebbestad & Lehnert, Reference Kröger, Ebbestad and Lehnert2016), and a flank region composed of coarse-grained pelmatozoan wacke-, pack- and grainstone (Paul & Bockelie, Reference Paul and Bockelie1983; Kröger, Ebbestad & Lehnert, Reference Kröger, Ebbestad and Lehnert2016). The mounds in the Boda Limestone reach dimensions of up to 1000 m in diameter with a thickness of more than 100 m. In a recent review, Kröger, Ebbestad & Lehnert (Reference Kröger, Ebbestad and Lehnert2016) noted that the stromatactis-bearing core limestone of the Boda mounds is generally very rich in sponge spicules and assumed that sponge decay and microbial activity was probably a key factor in mound formation. Beneath typical stromatactis limestone (Fig. 4d), the Boda mounds contain a substantial amount of massive limestone with a mosaic-like pattern of diffuse cryptocrystalline patches, which are unlike stromatactis filled with compact masses of bladed-blocky spar. Additionally, the Boda mounds have a significant portion of Palaeoporella framestone–bafflestone in their core regions (Stolley, Reference Stolley1898; Thorslund, Reference Thorslund1936; Jux, Reference Jux1966; Kröger, Ebbestad & Lehnert, Reference Kröger, Ebbestad and Lehnert2016). The algal limestone is interpreted as evidence of the active, constructing role of brypsidalean green algae in the mound formation and as main (originally aragonite) carbonate producers of the mounds. The formation of the Boda mounds is assumed to be a result of a combined mechanism of early aragonite recrystallization and organomineralization with green algae and sponges as main mound constructors.
The general faunal composition of the mounds and their flanks, and a low-energy depositional environment, are interpreted as evidence for the position of the mounds low in the photic zone at water depths of 50–100 m (see Kröger & Ebbestad, Reference Kröger and Ebbestad2014).
3.d.2. Reef and mud mound complexes of the Central Baltic area
The distance from Gotland in the SW to the Island Hiiumaa in Estonia in the NE is almost 300 km long, and there exists an up to 40 km wide belt across the Central Baltic in which more Ordovician reefs and mounds are known to have existed than elsewhere in Baltoscandia (Fig. 2). This extensive belt is known from seismic reflection profiles (Flodén, Reference Flodén1980; Tuuling & Flodén, Reference Tuuling and Flodén2000, Reference Tuuling and Flodén2010). Based on seismic reflectors and biostratigraphical data from drill cores, the age of these reefs and mounds can be constrained to Pirgu–Hirnantian Stage (Bergström, Löfgren & Grahn, Reference Bergström, Löfgren and Grahn2004; Tuuling & Flodén, Reference Tuuling and Flodén2000, Reference Tuuling and Flodén2010). The northwards extension boundary of the belt roughly coincides with the submarine exposure and northwards extension boundary of the Pirgu–Hirnantian beds and with the Baltic Klint.
Two main areas with reef/mound concentrations can be distinguished: a larger western area with a centre closely NE offshore Gotland; and a minor SW offshore Hiiumaa. In the Gotland area, seismic reflection patterns reveal a general zonation of the belt with: (1) a 1–4 km wide ‘main zone’ or ‘barrier zone’ with up to 2 km in diameter closely spaced build-ups in the north; followed by (2) an up to 12 km wide zone with clusters of solitary build-ups, each 500–800 m in diameter and with distances of several hundred metres; and (3) in the south a more than 20 km wide zone with generally smaller solitary structures (Tuuling & Flodén, Reference Tuuling and Flodén2000). In the area SE of Hiiumaa, the build-ups are generally of smaller sizes (100–200 m in diameter) and are distributed in more widely dispersed clusters (Tuuling & Flodén, Reference Tuuling and Flodén2000).
In the main zone, the build-ups are locally tightly spaced and form ‘a single monolithic body’, in places where they are spatially more separated. The shapes of individual structures are flat and symmetrically lenticular with a thickness of generally considerably less than 100 m (Tuuling & Flodén, Reference Tuuling and Flodén2000; see also Sivhed et al. Reference Sivhed, Erlström, Bojesen-Koefoed and Löfgren2004). Basinwards from the main zone the build-ups are smaller in lateral dimensions but similar or greater in thickness (40–50 m), resulting in dome-cone-shaped structures (Tuuling & Flodén, Reference Tuuling and Flodén2000). Hypotheses regarding details of the bioherm architecture, its constructors and differences among specific regions remain largely speculative because only a few drill core studies are available (Bergström, Löfgren & Grahn, Reference Bergström, Löfgren and Grahn2004; Sivhed et al. Reference Sivhed, Erlström, Bojesen-Koefoed and Löfgren2004; Eriksson & Hints, Reference Eriksson and Hints2009).
Sivhed et al. (Reference Sivhed, Erlström, Bojesen-Koefoed and Löfgren2004) demonstrated that several bioherms in the subsurface of Gotland are composed of a regular pattern of a sub-mound and flank facies that consists mainly of pelmatozoan pack-wackestone, and massive Palaeoporella and stromatactis-rich core regions. Sivhed et al. (Reference Sivhed, Erlström, Bojesen-Koefoed and Löfgren2004) also mentioned ‘stromatolitic limestone’, but all his figured samples only show typical stromatactis cavities which were mistaken as stromatolites. Based on a comparison of the figures of Sivhed et al. (Reference Sivhed, Erlström, Bojesen-Koefoed and Löfgren2004), the Gotland mounds were very similar to the mud mounds of the Boda Limestone and of central Estonia (see Section 3.c.1) and were probably formed in a very similar manner.
3.d.3. Reefs and mud mounds of the Pirgu Stage of Estonia
Reefs and mud mounds of the Pirgu Stage are preserved at several places along the Estonian shelf. Generally more shallow depositional settings can be distinguished with small patch reefs within the aphanitic limestone of the Moe Formation and deeper settings with massive mud mounds within the argillaceous limestone and marls of the Jonstorp Formation. The patch reefs are exposed at Vormsi Island (Hoitberg: 59.004444°N, 23.182778°E) and slightly eastwards in NW Estonia (Ruunavere: 59.090533°N, 24.459025°E; and Niibi: 59.040833°N, 23.656389°E); little information is available from Kaljo (Reference Kaljo1957), Klaamann (Reference Klaamann1966) and unpublished field notes of L. Põlma and H. Nestor (available at the database of the Geocollections of Estonia, http://geokogud.info/). The Hoitberg reef is more than 3 m thick and 45–65 m in diameter, and the Ruunavere and Niibi reefs are less than 1 m thick and only a few metres in diameter. The reported common occurrence of tabulates such as Catenipora, Cryptolichenaria, Eocatenipora and Sarcinula and heliolitids in the reefs indicate a significant role of corals for the reef construction. Additionally, stromatoporoids such as Clathrodictyon and Plumatilinia and green algae such as Palaeoporella and Vermiporella played a major role for the reef formation.
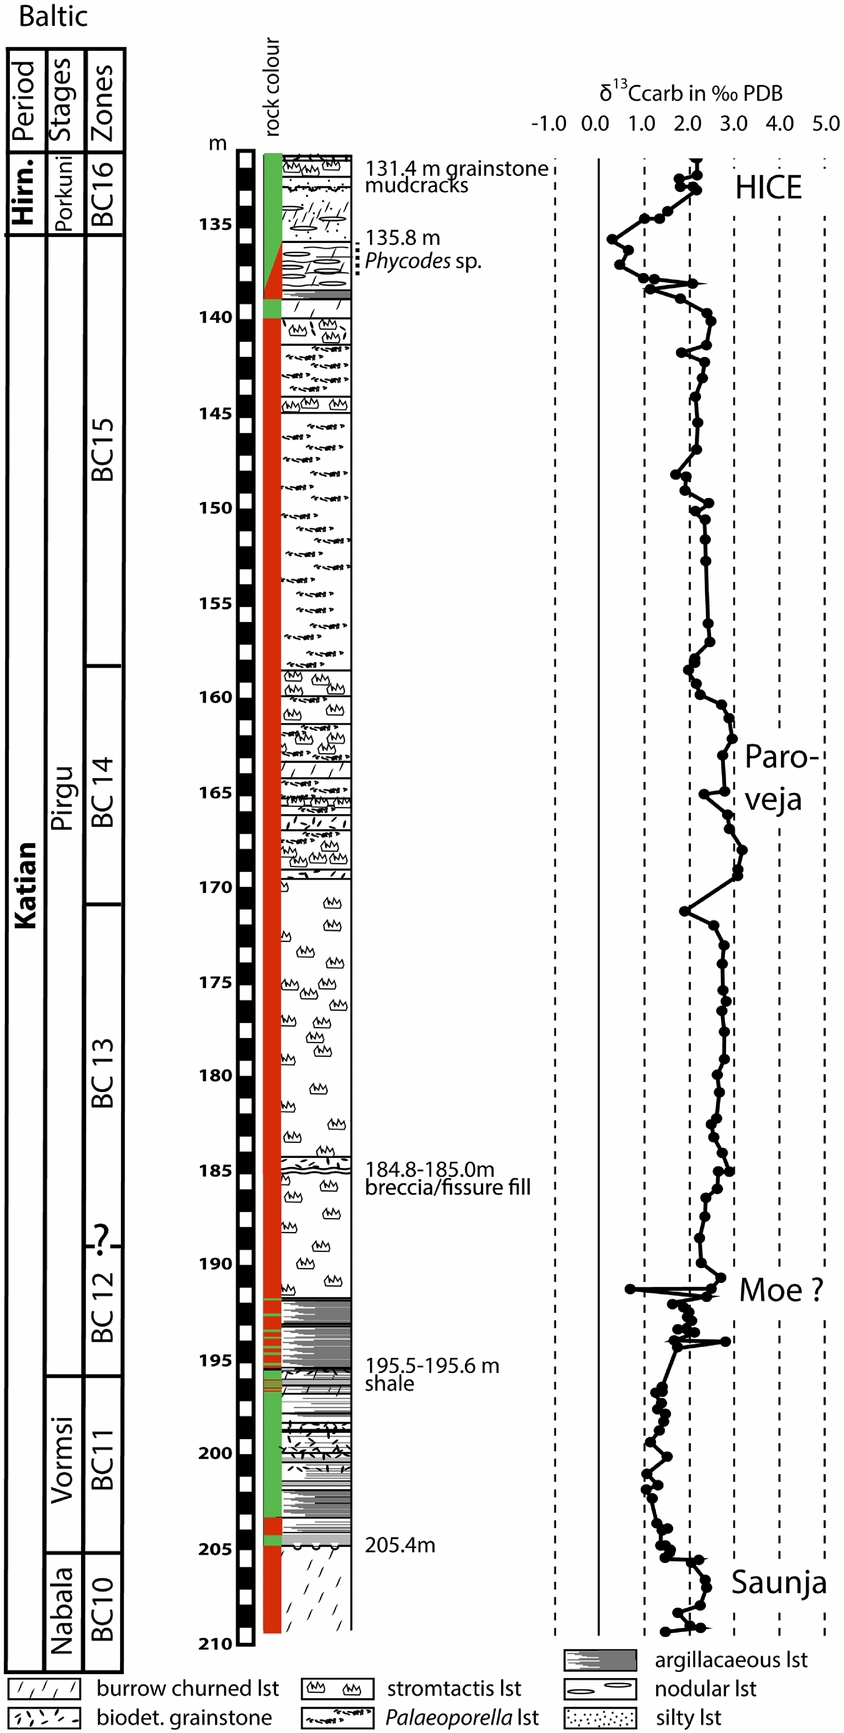
Large mud mounds formed in deeper depositional environments during the Pirgu Stage (Perens, Reference Perens, Meidla, Jõeleht and Kirs1995; Hints, Oraspõld & Nõlvak, Reference Hints, Oraspõld and Nõlvak2005). The only well-documented mound is known from the Võhma drill core of central Estonia (58.612260°N, 25.559460°E) (Alikhova, Reference Alikhova1953; Oraspõld, Reference Oraspõld1982; Raukas & Teedumäe, Reference Raukas and Teedumäe1997; Figs 2, 5). The recorded thickness of the mound is c. 53 m; its base is within the Jonstorp Formation and the top within the Adila Formation. The mound facies is generally very similar to the mounds of the Boda Limestone Formation in central Sweden and to the mounds in subsurface Gotland (see Section 3.d.2 above); it consists of massive stromatactis and Palaeoporella limestone (Fig. 4b). An interesting detail of the mound's faunal composition is the increased abundance of isolated halysitid colonies such as Catenularia in the uppermost parts of the mound. This is similar to the Boda limestone mounds and probably indicates a relative shallowing at the final mound growth during the terminal Pirgu Stage (see Kröger, Ebbestad & Lehnert, Reference Kröger, Ebbestad and Lehnert2016).
Part of the Võhma drill core section, central Estonia (58.612260°N, 25.559460°E), depicting the lithology and chemostratigraphy of a more than 50 m thick Palaeoporella reef/mud mound nearly time equivalent to the Boda Limestone mounds in Central Sweden. Abbrevations: BC – Baltic Carbon Isotope zones of Ainsaar et al. (Reference Ainsaar, Kaljo, Martma, Meidla, Männik, Nõlvak and Tinn2010); biodet. – biodetritical; Hirn. – Hirnantian; lst – limestone.

A less than 2 m thick section of stromatactis limestone in the Võhma drill core within the rising limb of the Hirnantian Isotopic Carbon Excursion (HICE) (Fig. 5) represents either a distinct younger smaller mound or a wedge of a continuous mound-forming process. The mound growth also continued during Hirnantian time with a reduced intensity in the Siljan district, Sweden (Kröger, Ebbestad & Lehnert, Reference Kröger, Ebbestad and Lehnert2016).
3.d.4. Reefs of the Pirgu Stage of SE Latvia and Lithuania
The occurrence of small patch reefs is also reported from drill cores in the Moe and Adila formations, Pirgu Stage in Ludza-15 (56.545959°N, 27.713909°E) and Malta-105 (56.335816°N, 27.172612°E) drill cores, SE Latvia (Ulst, Reference Ulst and Ulst1972; Ulst, Gailite & Yakovleva, Reference Ulst, Gailite and Yakovleva1982; Fig. 2). A detailed description of the reefs is not available, but tabulate corals are listed as a frame-building component (Ulst, Gailite & Yakovleva, Reference Ulst, Gailite and Yakovleva1982, p. 97). Algal-coral stromatoporoid bioherms were listed from beds of the Pirgu and Porkuni Stage in the Pamituvys-98 core in Lithuania (Laškovas, Reference Laškovas2000).
3.e. Hirnantian reefs and mud mounds
During early Hirnantian time (equivalent to Hi1 Stage Slice of Bergström et al. Reference Bergström, Chen, Gutiérrez-Marco and Dronov2009) the large mud mounds of the Boda Limestone Formation, central Sweden and the mud mound of the Võhma drill core, Estonia continued to grow (see Section 3.d). Additionally, a number of framework reefs are reported from shallow depositional environments of Estonia and Norway.
3.e.1. Hirnantian bioherms of the Oslo region, Norway
Latest Ordovician bioherms of the Oslo region are listed in the literature but are generally very poorly known (e.g. Nakrem & Rasmussen, Reference Nakrem, Rasmussen, Calner, Ahlberg, Lehnert and Erlström2013, p. 64). Bioherms are described in an unpublished thesis (N.-M. Hanken, University of Oslo, 1974) from latest Ordovician sandy sediments from the southern end of the Oslo region in the Skien-Langesund area (Braithwaite, Owen & Heath, Reference Braithwaite, Owen and Heath1995; Fig. 2). Details of the stratigraphy and sedimentology of these bioherms are not known. The ‘reefs’ at Ullerntangen, Ringerike area, that were originally described by Kiær (Reference Kiær1897) and named ‘carbonate bank’ in Hanken & Owen (Reference Hanken, Owen, Bruton and Williams1982), are interpreted as debris-flow sediments by Braithwaite, Owen & Heath (Reference Braithwaite, Owen and Heath1995). The debris-flow ‘carbonate bank’ should not be confused with directly underlying ‘small argillaceous mounds’ which also occur in the near Store Svarteøya island SE of Ullerntangen (Hanken & Owen, Reference Hanken, Owen, Bruton and Williams1982; B. Gudveig Baarli, pers. comm. 2015). The mounds are embedded in a pelmatozoan grainstone, attain a thickness of less than 3 m and contain abundant stromatoporoids and tabulate corals (Hanken & Owen, Reference Hanken, Owen, Bruton and Williams1982). The stratigraphy of the pelmatozoan wackestone and the embedded mounds is poorly resolved, but regarded as equivalent to the Hirnantian Langøyene Sandstone elsewhere (Braithwaite, Owen & Heath Reference Braithwaite, Owen and Heath1995).
3.e.2. Hirnantian reefs of Estonia
Hirnantian shallow-water patch reefs developed in many places of northern Estonia within the Ärina Formation (Oraspõld, Reference Oraspõld1975; Perens, Reference Perens, Meidla, Jõeleht and Kirs1995; Hints, Oraspõld & Kaljo, Reference Hints, Oraspõld and Kaljo2000; Fig. 2). Details of the composition of these reefs are not available, but general faunal descriptions indicate that stromatoporoids auch as Clatrodictyon, Ecclimadictyon and Pachylostoma were the main metazoan constructors (Nestor, Reference Nestor1964, Reference Nestor1999). Additionally, tabulates such as Eocatenipora and Palaeofavosites are important metazoan components (Klaamann, Reference Klaamann1966). Tetradiid corals such as Rhabdotetradium played an important role as baffler in the younger reef generation of the Tõrevere Member (compare Oraspõld, Reference Oraspõld1975; Hints, Oraspõld & Kaljo, Reference Hints, Oraspõld and Kaljo2000). Our own investigations in the Porkuni quarry (59.187346°N, 26.187433°E) indicate that small patch reefs, which developed within the older Vohilaid–Siuge Member of the Ärina Formation, have a core facies with a content of more than 60% of a clotted microbial limestone. Additionally, encrusting stromatoporoids, encrusting bryozoans and baffling dasycladaceans played a major role for the reef formation (Fig. 4c).
4. Stratigraphy of the reef/mound horizons and reef/mound community evolution
Mud mounds and framework reefs became widespread in the Baltoscandian area during Late Ordovician time (Fig. 6). The oldest Baltoscandian bioherms are small, regionally restricted mud mounds within Early Ordovician limestone. During earliest Katian time reefs and mounds spread across Baltoscandia; a high diversity of frame-builders ranging from bryozoans, echinoderms and receptaculites to stromatoporoids and tabulate corals are present in strata of the Keila Stage. Middle – late Katian frame reefs are characterized by a more distinct dominance of stromatoporoids and tabulates, and often contain green algae as significant components. Green algae are an important component of the large late Katian stromatactis mud mounds. Diverse frame reefs and stromatactis mud mounds are present in early Hirnantian strata. These reefs and mounds do not reach into upper Hirnantian strata.
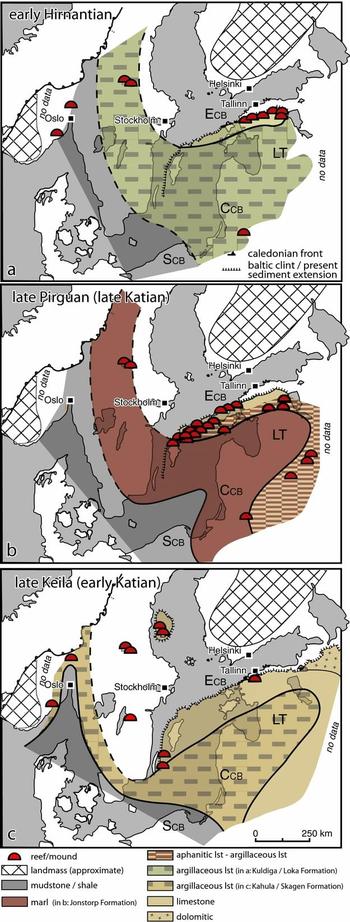
Facies reconstructions of Baltic region of three selected time slices with reef occurrences. Note the high facies differentiation during the Pirgu and Hirnatian stages. (a) Based on Männil (Reference Männil1966), Oraspõld (Reference Oraspõld1975), Hints & Meidla (Reference Hints, Meidla, Raukas and Teedumäe1997b ), Kiipli (Reference Kiipli1997), Paškevičius (Reference Paškevičius1997), Hints, Oraspõld & Kaljo (Reference Hints, Oraspõld and Kaljo2000) and Hints et al. (Reference Hints, Hints, Kaljo, Kiipli, Männik, Nõlvak and Pärnaste2010). (b) Based on Männil (Reference Männil1966), Modliński & Szymański (Reference Modliński and Szymański1997), Paškevičius (Reference Paškevičius1997), Tuuling & Flodén (Reference Tuuling and Flodén2000), Hints, Oraspõld & Kaljo (Reference Hints, Oraspõld and Nõlvak2005) and Kröger, Hints & Lehnert (Reference Kröger, Hints and Lehnert2014). (c) Based on Winterhalter (Reference Winterhalter1972), Bockelie (Reference Bockelie, Ramberg and Neumann1978), Jaanusson (Reference Jaanusson1979), Flodén (Reference Flodén1980), Bergström et al. (Reference Bergström, Huff, Kolata, Yost and Hart1997, Reference Bergström, Calner, Lehnert and Noor2011 a), Hints & Meidla (Reference Hints, Meidla, Raukas and Teedumäe1997a ), Modliński & Szymański (Reference Modliński and Szymański1997), Ainsaar, Meidla & Martma (Reference Ainsaar, Meidla and Martma2004), Bergström, Löfgren & Grahn (Reference Bergström, Löfgren and Grahn2004), Dronov & Dolgov (Reference Dronov, Dolgov, Dronov, Tolmacheva, Raevskaya and Nestell2005) and Grahn & Nõlvak (Reference Grahn and Nõlvak2007). Positions of Finnish mainland from Männil (Reference Männil1966) and Uutela (Reference Uutela1998), and from Telemark land from Hansen (Reference Hansen2011). Abbrevations: LT – Livonian Tongue; CCB – Central Baltic Confacies Belt; SCB – Scanian Confacies Belt (after Jaanusson Reference Jaanusson1976).

4.a. Pre-Katian reefs/mounds
The only pre-Katian reef/mound structures known from Baltoscandia are the flat sponge-rich microbial mud mounds of the Billingen–Volkhov stages (late Foian – Dapingian) in the St Petersburg region. During Floian–Dapingian time, this region was part of a proximal area of the interior of the Baltic Basin, a flat ramp-like sedimentary system with a deposition of temperate siliciclastic-glauconitic limestones in a storm-dominated environment (Dronov, Reference Dronov, Dronov, Tolmacheva, Raevskaya and Nestell2005). The formation of mud mounds seemed to be restricted this specific area of Baltoscandia.
4.b. Keila–Oandu Stage reefs/mounds
The late Sandbian – early Katian time interval was one of major changes in the sedimentary regime throughout Baltica. Ainsaar, Meidla & Martma (Reference Ainsaar, Meidla and Martma2004) named the interval ‘Middle Caradoc Facies and Faunal Turnover’ and emphasized the remarkable and probably interconnected changes in facies, sea level, climate and biota. The formation of reefs and mud mounds and their termination is a major aspect of this event.
The baseline and key horizon for the correlation of the lower Katian beds is the upper Sandbian Kinnekulle K-bentonite bed (Sell, Ainsaar & Leslie, Reference Sell, Ainsaar and Leslie2013; Bauert et al. Reference Bauert, Isozaki, Holmer, Aoki, Sakata and Hirata2014). The sediments above the Kinnekulle K-bentonite record a conspicuous δ13C peak, the Guttenberg isotope carbon excursion (GICE), which can be observed in North America and elsewhere in the world (Bergström et al. Reference Bergström, Schmitz, Saltzman and Huff2010a ; Bergström, Young & Schmitz, Reference Bergström, Young and Schmitz 2010 ; Sell et al. Reference Sell, Samson, Mitchell, Mclaughlin, Koenig and Leslie2015).
In Baltoscandia, the GICE interval and its directly overlying beds are characterized by pronounced depositional gaps. Two major hiati, an earlier one during the peak GICE interval and a later one in the final GICE interval, can be traced over the entire Baltoscandian basin. Reefs and mud mounds are exclusively concentrated across Baltoscandia in beds representing the narrow time interval of the rising limb and peak interval of the GICE below the major sedimentary gaps (Fig. 7).
Correlation scheme of late Sandbian – early Katian interval of selected sections of Baltoscandia, depicting depositional gaps. The Sandbian–Katian boundary is based on Bergström et al. (Reference Bergström, Lehnert, Calner and Joachimski2012), but see Sell et al. (Reference Sell, Samson, Mitchell, Mclaughlin, Koenig and Leslie2015). Our correlation differs from that of Bergström et al. Reference Bergström, Schmitz, Young and Bruton(2011b) in placing the Skålberget and Moldå limestones of Borenshult in a position that is slightly younger, nearly time equivalent to the Holtjernet Member of the Mjøsa Formation. In contrast, Bergström et al. Reference Bergström, Schmitz, Young and Bruton(2011b) correlate the entire Freberga Formation of Dalarna, Sweden (inclusively Skålberget and Moldå limestones) with the lower and middle members of the Mjøsa Formation. Our new interpretation is based on the correlation of the discontinuity surfaces at the base of the Moldå Limestone and similarities in the δ13C curve. The relative height of the lithostratographic units does not relate to the thickness of sediments, but was fitted to the relative timescale. Hiati are marked as grey intervals (for method of correlation see text) and reef and mound growth with stars. Note the time-equivalent occurrence of reef and mound growth at the Sandbian–Katian boundary interval. δ13C data of are Mjøsa area from Bergström et al. Reference Bergström, Schmitz, Young and Bruton(2010b , Reference Bergström, Schmitz, Young and Bruton2011 b), Borenshult from Bergström et al. (Reference Bergström, Lehnert, Calner and Joachimski2012), Kullsberg from Calner, Lehnert & Nõlvak (Reference Calner, Lehnert and Nõlvak2010), Ristiküla from Ainsaar, Meidla & Martma (Reference Ainsaar, Meidla and Martma1999) and Vasalemma from Kröger, Hints & Lehnert (Reference Kröger, Hints and Lehnert2014) and Kröger et al. (Reference Kröger, Hints and Lehnert2014). Abbrevations: Berge – Bergevika; K-b – K-bentonite; Mbr – Member; Lst – Limestone; Vasal. – Vasalemma.

Framework reefs of this time interval are present in the Oslo region at the margin of the Baltic Basin and in northern Estonia in more interior parts of the basin (Fig. 6). In both areas, root-like echinoderm holdfast locally played a major role as sediment binders and bafflers. Otherwise, the reefs of two regions are very different. The reefs of the Oslo region are relatively matrix poor with a content of 40% in average, in contrast to the Estonian reefs with a matrix content of 50–70% (see Section 3.d). The Estonian reefs are mainly composed of sheet-forming bryozoans, Hemicosmites-holdfasts, and receptaculites and microbial limestones are an important component. In contrast, the Norwegian reefs are formed by Solenopora, stromatoporoids and tabulate corals, and contain green algae as an important component in several places. In the Estonian reefs, tabulate corals are restricted to the last phase of reef growth and stromatoporoids and green algae are totally absent. Echinoderm-rich and receptaculite-rich reefs are stratigraphically restricted in Baltoscandia to upper Sandbian – lower Katian strata. Stromatoporoids and tabulate corals became the dominant reef frame-builders later during the Ordovician period. Sedimentological characteristics, such as the presence of pelmatozoan-grainstones and cross–bedding, indicate shallow neritic depositional envrironments for the upper Sandbian – lower Katian frame reefs. The stromatactis mud mounds of the time-equivalent Kullsberg Limestone were probably deposited in slightly deeper but also shallow neritic depositional environments (Tobin, Bergström & De La Garza, Reference Tobin, Bergström and De La Garza2005). However, few studies exists of the lithology and biotic content of the Kullsberg mounds, and a detailed discussion is not possible with the current data.
4.c. Rakvere–Nabala Stage reefs/mounds
Little is known about the stratigraphical level and the palaeogeographical extent of the middle Katian reefs/mounds. The only unequivocal place of mud mounds of Rakvere–Nabala age is the subsurface of Gotland, where drill cores indicate a mound lithology that is identical to the younger mounds of the Boda Limestone, for example. These mounds are mainly composed of a sponge-rich stromatactis limestone and a green algal (e.g. Palaeoporella) framestone and bafflestone, and are interpreted to be the result of a spectrum of essentially microbially mediated diagenetic accretionary mechanisms (Kröger, Ebbestad & Lehnert, Reference Kröger, Ebbestad and Lehnert2016). Seismic profiles imply that more middle Katian mounds of the same type are present below younger, more massive mound structures in the Central Baltic (Tuuling & Flodén, Reference Tuuling and Flodén2000, Reference Tuuling and Flodén2010). The widespread occurrence of Palaeoporella limestone boulders with Rakvere–Nabala-aged microfossils within Pleistocene erratics can be interpreted as additional evidence that middle Katian green algal-rich mud mounds were not an isolated phenomenon of subsurface Gotland (see Section 3.d).
4.d. Pirgu Stage
During the entire Pirgu Stage reefs and mounds flourished within the Baltic Basin (Fig. 6). Most prominent and best investigated are the mounds of the Boda Limestone Formation in the Siljan district of central Sweden (Ebbestad et al. Reference Ebbestad, Högström, Frisk, Martma, Kaljo, Kröger and Pärnaste2015; Kröger, Ebbestad & Lehnert, Reference Kröger, Ebbestad and Lehnert2016). In the Siljan district the mound growth started immediately after the deposition of the Fjäcka shale within the lower Jonstorp Formation, early in the Pirgu Stage, and lasted with minor disturbances until early Hirnantian time (Kröger, Ebbestad & Lehnert, Reference Kröger, Ebbestad and Lehnert2016).
There is a high probability that the reefs and mounds in subsurface Gotland and in the central Baltic area had similarly long growth intervals. Chitinozoans indicate upper Tanuchitina bergstroemi – Conochitina rugata zones of the Pirgu Stage for these structures (Bergström, Löfgren & Grahn, Reference Bergström, Löfgren and Grahn2004). With a few exceptions, the mound and reef complexes offshore of Gotland and in the central Baltic area occur between seismic reflectors O4–5 and Or2, S1 respectively, and are therefore younger than Vormsi Stage and generally older than Porkuni Stage (Tuuling & Flodén, Reference Tuuling and Flodén2000, Reference Tuuling and Flodén2010). The thick mound exposed in the Võhma drill core ranges from low in the Jonstorp Formation into beds representing the lower part of the HICE.
The exposed mud mounds of central Sweden, of subsurface Gotland and of central Estonia are sedimentologically very similar; they consist of sponge-spicule-rich stromatactis limestone cores and contain significant parts composed of Palaeoporella framestone and bafflestone. Microbially mediated sponge biomass degradation and Palaeoporella skeleton disintegration and associated diagenetic processes are considered to be the main processes behind the mud mound formation (Kröger, Ebbestad & Lehnert, Reference Kröger, Ebbestad and Lehnert2016). The mud mounds invariably occur in a narrow belt of the Baltic Basin, which is transitional between reddish argillaceous sediments and fine-grained platform carbonates. The maximum depositional depth of the Boda Limestone mounds was low in the photic zone with depths of significantly more than 50 m (Kröger, Ebbestad & Lehnert, Reference Kröger, Ebbestad and Lehnert2016).
The large mud mounds and mound complexes of the deeper depositional environments must be contrasted with the smaller mounds or framework reefs of the shallower environments, exposed in a few places in NW Estonia and described from drill cores in SE Latvia and Lithuania. These structures generally have shorter stratigraphical ranges within the Pirgu Stage. Sedimentological details about these structures are not known but frame builders such as tabulate corals and stromatolites played an important role, and green algae such as Palaeoporella are ubiquitous.
4.e. Hirnantian
The Baltic Hirnantian succession is characterized by major sedimentary hiati (Kaljo et al. Reference Kaljo, Hints, Männik and Nõlvak2008; Bergström et al. Reference Bergström, Lehnert, Calner and Joachimski2012; Ebbestad et al. Reference Ebbestad, Högström, Frisk, Martma, Kaljo, Kröger and Pärnaste2015). The growth of the mud mounds at the Siljan area, Sweden and at Võhma, central Estonia was terminated within the rising limb of the HICE, below the first major Hirnantian hiatus. The shallow-water reefs reported from Ärina Formation of northern Estonia (Oraspõld, Reference Oraspõld1975; Hints, Oraspõld & Kaljo, Reference Hints, Oraspõld and Kaljo2000) range throughout the recorded HICE interval.
The intercontinental correlation of the Hirnantian horizons of Baltoscandia with other sections in the world is problematic. This is mainly because of a lack of overlap of stratigraphically relevant chitinozoans, conodonts or graptolites. The chitinozoan index species Spinachitina taugourdeaui, which occurs in the lower two members of the Ärina Formation, indicates early Hirnantian age for most of the Porkuni Stage reefs of northern Estonia (Hints, Oraspõld & Kaljo, Reference Hints, Oraspõld and Kaljo2000).
The large stromatactis mud mounds of central Sweden and central Estonia continued to grow, although in reduced intensities, during early Hirnantian time. Notably, the uppermost parts of these mud mounds occasionally contain heliotid tabulate corals as additional biotic component, which probably indicates changes in environmental conditions or decreasing depositional depths.
Small mud mounds or framework reefs are widespread in lower Hirnantian strata in northern Estonia and occur in the Oslo region (Fig. 6). Sedimentological details about the reefs are not known, but frame-builders such as tabulate corals, stromatoporoids, and bryozoan are present and microbially mediated mineralization processes played a major role in the reef formation (see Section 3.e).
5. Interpretation
5.a. Early Katian change in mode of carbonate production in the Baltic Basin
Reefs and mounds were abundant in parts of the Baltic Basin from the latest Sandbian – earliest Katian boundary interval onwards (Fig. 6). During the latest Pirgu Regional Stage (latest Katian), a situation was established in the Baltic Basin that was quite similar to that of the Silurian period: barrier reef or mound complexes on a gently dipping carbonate platform (see Section 3.d.2; Tuuling & Flodén, Reference Tuuling and Flodén2000, Reference Tuuling and Flodén2010).
The widespread appearance of bioherms marks a critical occurrence in the evolution of the Baltic Basin. The earliest Katian regional Keila–Oandu stage boundary, which in northern Estonia is developed as a prominent facies change and hiatus, has long been recognized as a distinctive turning point in the evolution of the Baltic Basin. With an apparent major change in the tectonic regime, Estonian geologists placed the boundary between two evolutionary epochs or stages of the basin at this hiatus (Männil, Reference Männil1966; Hints et al. Reference Hints, Meidla, Nõlvak and Sarv1989). Before the Oandu Stage, the lateral facies differences across the basin were accordingly extremely low (Fig. 6) and a highly diverse, highly endemic benthic fauna existed which generally had low abundances. Subsequently, a pronounced lateral facies differentiation existed across the basin with clear-cut differences between deep basinal and shallow platform facies; the benthic fauna was generally less diverse, with a high percentage of immigrants from other regions and with generally higher abundances (Hints et al. Reference Hints, Meidla, Nõlvak and Sarv1989). Our own data support these earlier assumptions. Taxon occurrences in Estonian outcrops reveal significantly decreased diversities and increased abundances in post-Keila stages (Fig. 8), and the diversity of dominant-group reef builders is lower in post-Keila reefs.
Diversity estimates and detection probabilities during the Late Ordovician epoch of Baltoscandia are compared to the sea-level curve of Dronov et al. (Reference Dronov, Ainsaar, Kaljo, Meidla, Saadre and Einasto2011). Note the general decrease in diversities and the strong increase in detection probabilities after the Sandbian age in the Estonian samples. Note also the increasing diversity trends in the reef and mound samples. Diversity values from Estonia are based on occurrences in the geocollection database SARV of the Keila Stage (exclusive Vasalemma Formation), the Vasalemma Formation, the Oandu Stage (exclusive Vasalemma Formation), the Oandu, Rakvere, Nabala and Pirgu stages, the Moe Formation and the Ärina Formation, lower Hirnantian (see Table 1). Genus diversity estimate is calculated by rarefaction with quota n = 130 (Kullsberg Limestone sample). Detection probability was calculated based on occupancy modelling (see Section 2 on Methods). Detection probability is the probability of a genus occurrence within a site and can be interpreted as a proxy for genus abundance (see Methods). Samples from Estonia reflect stage levels and one sample from the Pirgu Stage Moe Formation. Samples from north Estonian reefs are from Vasalemma Formation, Keila Stage and Ärina Formation, Porkuni Stage. Samples from Central Sweden are from Kullsberg Limestone (Keila Stage) and Boda Limestone (Pirgu – early Hirnantian). Abbrevations: BC – Baltic Carbon Isotope Zones of Ainsaar et al. (Reference Ainsaar, Kaljo, Martma, Meidla, Männik, Nõlvak and Tinn2010); Dep.-Seq. – depositional sequence; GICE – Guttenberg isotope carbon excursion; HICE – Hirnantian isotope carbon excursion; KOPE – Kope or Rakvere isotope carbon excursion; MOE – Moe isotope carbon excursion; PARO – Paroveja isotope carbon excursion; SAUNJA – Saunja isotope carbon excursion.

Ainsaar, Meidla & Martma (Reference Ainsaar, Meidla and Martma2004) coined the term ‘Middle Caradoc Facies and Faunal Turnover Event’ for this interval and considered it to be ‘one of the most important faunal change horizons in the post-Tremadocian’. Dronov & Rozhnov (Reference Dronov and Rozhnov2007) located the change in Baltic sediments from temperate to tropical at the Keila–Oandu boundary. Likewise, the interval may be described as a major change in the mode of carbonate production across the basin. From the earliest Katian onwards, a very characteristic facies of pure carbonate mudstone occurs in a wide area in the more proximal regions of the basin (calcilutites in the terminology of e.g. Jaanusson, Reference Jaanusson1982; aphanitic limestone in the Estonian and Russian literature e.g. Raukas & Teedumäe, Reference Raukas and Teedumäe1997; Baltic limestone, and lithographic limestone in e.g. Spjeldnæs & Nitecki, Reference Spjeldnæs and Nitecki1994; and Ostseekalk in the German literature e.g. Hucke & Voigt, Reference Hucke and Voigt1967). This facies is poorly fossiliferous except for strongly recrystallized calcareous green algae (Spjeldnæs & Nitecki, Reference Spjeldnæs and Nitecki1994). Typical examples are the Slandrom Limestone (Calner, Lehnert & Nõlvak, Reference Calner, Lehnert and Nõlvak2010 a) of central Sweden, the Rägavere, Saunja and Moe formations of northern Estonia (e.g. Hints, Oraspõld & Nõlvak, Reference Hints, Oraspõld and Nõlvak2005) and the Östersjö Limestone (Axberg, Reference Axberg1980) and File Formation (Bergström, Löfgren & Grahn, Reference Bergström, Löfgren and Grahn2004) in the Bothnian Sea and subsurface Gotland, respectively. Mud mounds occur at the aphanitic limestone facies and reefs are common in the more proximal parts of the extension area (Fig. 6). This carbonate mudstone/bioherm facies rapidly fades out basinwards and only intercalates with argillacous limestone-marls within a zone of c. 50 km. The Baltic limestone facies and the bioherms must be considered as two aspects of one and the same Late Ordovician very gently dipping rimmed carbonate platform, which started to develop during earliest Katian time. What were the causes of the development of this new mode of carbonate production, and what were the controlling factors?
5.b. Causes of reef/mound formation in the Baltic Basin
5.b.1. The palaeogeographical migration of Baltica and a changing tectonic regime
Baltica became an independent palaeocontinent during Ediacaran time (570–550 Ma) and collided with Laurentia during late Silurian time (420–400 Ma) (Roberts, Reference Roberts2003; Cocks & Torsvik, Reference Cocks and Torsvik2005). The Ordovician history of this palaeocontinent was shaped by a northwards drift from low to high, near-equatorial palaeolatitudes and the docking of Avalonia at the end of Ordovician Period (c. 443 Ma) (Cocks & Torsvik, Reference Cocks and Torsvik2005). The drift is interpreted as a changing influence of rifting and converging plates with a steady closure of the Iapetus Ocean in the palaeo-NW, and the Törnquist Ocean in the palaeo-SE of the Baltic Basin.
The drift and the changing tectonic regime had a substantial influence on the sedimentation and the faunal composition of the region with cold-water sediments and faunas in early, and temperate to tropical elements in late, Ordovician time (e.g. Cocks & Torsvik, Reference Cocks and Torsvik2005; Servais & Harper, Reference Servais and Harper2013). Major changes within the benthic fauna during the critical Sandbian–Katian boundary therefore involved an increased influx of taxa from Avalonia and Laurentia (Hansen & Harper, Reference Hansen and Harper2008; Hansen et al. Reference Hansen, Kresten Nielsen and Hanken2009). Moreover, the general diversity trend of Baltoscandia with a Sandbian peak (Hammer, Reference Hammer2003) and a Katian decline (termed ‘Katian prelude’ of the Hirnantian extinctions by Kaljo et al. Reference Kaljo, Hints, Hints, Männik, Martma and Nõlvak2011) was interpreted as a consequence of Baltica's drift through latitudes with optimal climatic conditions during the Kukruse–Keila stages. However, Baltica's drift was a steady gradual movement (Cocks & Torvik, Reference Cocks and Torsvik2005) and the faunal change and the establishment of a new facies pattern was, in geological terms, a sudden process. Currently, the explanations for the processes that led to these rapid changes remain largely under debate and more detailed investigations are needed to reconstruct processes of faunal change and systemic turning points.
The moving plate tectonic setting of Baltica had an influence on the depositional situation of the Baltic Basin. Increasing Late Ordovician subsidence rates suggest a gradually increasing lithospheric flexure (e.g. Poprawa et al. Reference Poprawa, Sliaupa, Stephenson and Lazauskiene1999; Sliaupa et al. Reference Sliaupa, Fokin, Lazauskiene, Stephenson, Gee and Stephenson2006; Sliaupa & Hoth, Reference Sliaupa, Hoth, Harff, Björck and Hoth2011). The main causes of this flexure are assumed to be the amalgamation of Avalonia and the closure of the Iapetus Ocean. However, the published subsidence curves (e.g. Poprawa et al. Reference Poprawa, Sliaupa, Stephenson and Lazauskiene1999; Sliaupa et al. Reference Sliaupa, Fokin, Lazauskiene, Stephenson, Gee and Stephenson2006; Artyushov, Tesakov & Chekhovich, Reference Artyushkov, Tesakov and Chekhovich2008; Sliaupa & Hoth, Reference Sliaupa, Hoth, Harff, Björck and Hoth2011) vary substantially over different parts of the basin without any basin-wide punctuated changes at the Sandbian–Katian boundary. Seismic profiles across the central and northern Baltic Basin reveal a fault-controlled syndepositional seafloor morphology with late Katian mound structures partly following N–S-aligned fault lines (Tuuling & Flodén, Reference Tuuling and Flodén2000). This local pattern does not however explain the specific timing of the reef development, it does not explain the spatial pattern of the reef/mound girdle in its entirety and it provides no explanation for the development of a strictly limited platform with carbonate mudstone. The palaeogeographic shift of Baltica and the changing tectonic regime therefore had a major effect on the background situation of the scene but other processes, such as a shift in the oceanographic condition, must have been influenced the initiation and development of large-scale reef development.
5.b.2. Sea level as a controlling factor
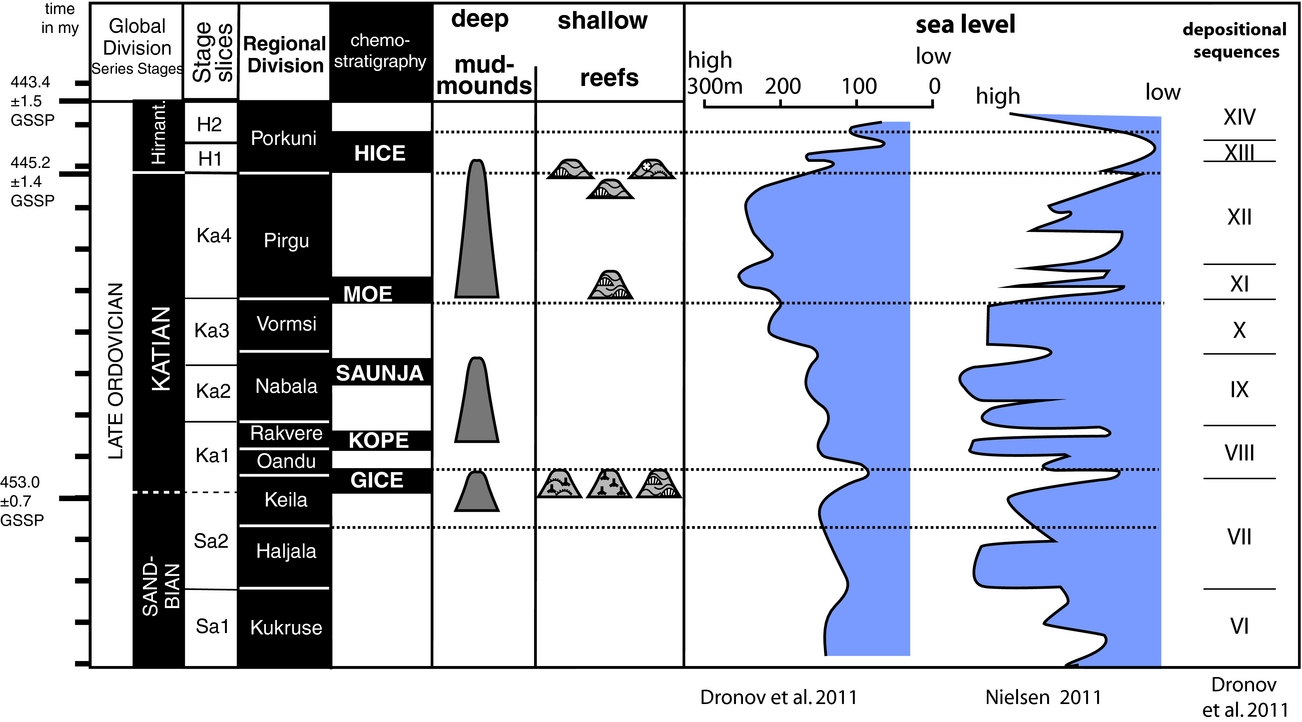
The abundance of recorded reef and mound occurrences differs over the individual Late Ordovician time intervals with a concentration in intervals with generally low sea levels (Fig. 9). The oldest interval with concentrated reef/mound occurrences is the interval spanning the time immediately before the onset of the GICE through the rising limb of the GICE during earliest Katian time. Throughout Baltoscandia, the reef and mound facies unequivocally occurs directly below the major unconformity/erosion surface at the Oandu Stage base (Fig. 7). In the Lake Mjøsa area (Norway) and in the Vasalemma area (Estonia), the reefs and their lateral equivalent beds generally represent a depositional environment that is shallower than the underlying facies (Opalinski & Harland, Reference Opalinski and Harland1981; Kröger, Hints & Lehnert, Reference Kröger, Hints and Lehnert2014; Kröger et al. Reference Kröger, Hints and Lehnert2014). This is in conflict with general assumptions that reef and mound growth requires substantial accommodation space, and must therefore have climaxed during a transgressive interval. This inconsistency is reflected in interpretations of the sea-level history of this time interval. In the scheme of Dronov et al. (Reference Dronov, Ainsaar, Kaljo, Meidla, Saadre and Einasto2011) the earliest Katian reef succession represents the uppermost part of depositional sequence VII of Dronov et al. (Reference Dronov, Ainsaar, Kaljo, Meidla, Saadre and Einasto2011). In contrast, in the scheme of Nielsen (Reference Nielsen, Webby, Paris, Droser and Percival2004) the succession spans a number of drowning (DE) and lowstand events (LE) (from base to top: Keila Drowning Event, Frognerkilen LE, Nakkholmen DE and Solvang LE).
Overview of reef/mound development within Baltoscandia compared to regional sea-level interpretations and depositional sequences. Note the concentration of shallow reefs in regressive intervals. Absolute timescale from Cooper et al. (Reference Cooper, Sadler, Hammer, Gradstein, Gradstein, Schmitz and Ogg2012). Abbrevations: GSSP –Global Boundary Stratotype Section and Point. For symbols see Figure 3.

The conflicting interpretations are best explained as a result of different scaling of the events in which the depositional sequences of Dronov et al. (Reference Dronov, Ainsaar, Kaljo, Meidla, Saadre and Einasto2011) represent third-order eustatic cycles, while the events of Nielsen (Reference Nielsen, Webby, Paris, Droser and Percival2004) reflect higher-order cycles. Here, the earliest Katian growth of the reefs and mounds are interpreted as reflecting short-term (higher than third-order) transgressive episodes within a generally regressive long-term (third-order) regime.
A similar situation can be reconstructed for the concentrations of reefs in sediments representing the time immediately before the onset of the HICE: the rising limb of the HICE during earliest Hirnantian time. The reef-bearing Hirnantian strata again are shallower than the underlying beds, and the reefs in turn occur directly below the major Hirnantian erosional unconformity (Hints, Oraspõld, A. & Kaljo, Reference Hints, Oraspõld and Kaljo2000; Kröger, Ebbestad & Lehnert, Reference Kröger, Ebbestad and Lehnert2016). The general depositional setting was therefore under a regressive regime, while the reef growth climaxed in a period of intermediate sea-level rise that created the required accommodation space.
This latest Sandbian – earliest Katian and early Hirnantian concentration of reefs in periods just before major sea-level falls represents either a primary signal; it is directly related to processes triggering the formation of the bioherms or is an effect of preservation. The latter is likely because only those reefs and mounds which formed in the deeper, still-existing parts of the basin are preserved in today's incomplete ancient landscape. It is conceivable that the existent reefs in the region reflect only a fraction of a much more proliferous proximal platform facies with a much higher reef density, which today is eroded away. In fact, some evidence supports this hypothesis.
(1) A general picture from outcrop and drill core data emerges with shallow, echinoderm/bryozoan/stromatoporoid/tabulate patch reefs in isolated proximal regions, and with green algal/sponge-rich stromatactis mud mounds in deeper parts of the basin. In Estonia, the shallow patch reefs are concentrated in locally restricted areas that are limited onshore of the erosional front of the Baltic Klint (Vasalemma Limestone reefs, Moe Formation reefs, Adila Formation reefs). In all likelihood, more reefs grew in the now-eroded more proximal parts of the platform.
(2) In Gotland the Pirgu Stage mounds are distributed along the northern edge of the present extension area of Pirgu Stage sediments. Mounds of the older Rakvere–Nabala stages occur predominantly southwards, that is, basinwards, of the younger Pirgu Stage mounds (Bergström, Löfgren & Grahn, Reference Bergström, Löfgren and Grahn2004), and the oldest mud mounds, time equivalent to the Kullsberg Limestone of the Keila Stage, occur even further south in an area east of Öland, Sweden (Flodén, Reference Flodén1980). This distribution is consistent with scenarios of a gradual Katian sea-level rise until a climax during the regional Vormsi Stage and a subsequent sea-level fall (e.g. Harris et al. Reference Harris, Sheehan, Ainsaar, Hints, Männik, Nõlvak and Rubel2004; Dronov et al. Reference Dronov, Ainsaar, Kaljo, Meidla, Saadre and Einasto2011). It is highly likely that a similar northwards shift paced by a slowly rising sea level also occurred in shallow-water reefs. Shallow-water reefs younger than Keila Stage are preserved only in very restricted areas in northern Estonia and Norway. It is very likely that reefs developed further onshore during most of the Katian and parts of the Hirnantian ages, and that these reefs were already eroded during latest Hirnantian time. Major evidence of Hirnantian subaerial emergence and erosion can be found in seismic profiles (Tuuling & Flodén, Reference Tuuling and Flodén2000, Reference Tuuling and Flodén2010) and on top of the Boda Limestone mounds in central Sweden (Kröger et al. Reference Kröger, Ebbestad, Lehnert, Ullmann, Korte, Frei and Rasmussen2015). The concentration of reefs and mounds in times of low sea level may simply be an effect of the better preservation potential of the more basinal structural positions of these reefs and mounds.
Nevertheless, an interdependence of preservational factors with primary factors for reef/mound development must be assumed, because the sea level fundamentally controlled the depositional environment. The sea level also influenced the specific current regime, and with it ecological properties such as local sea-water oxygenation, temperature, nutrient availability and sediment load.
5.b.3. Climate as a controlling factor
Improvements of the interregional stratigraphic resolution allow for unprecedented detail in the reconstruction of Late Ordovician climatic changes. This is especially the case for the Sandbian–Katian boundary interval. A series of major K-bentonites in the relevant time interval (e.g. Kinnekulle, Deicke, Millbrig, K-bentonites) can now be precisely dated by U–Pb zircon ages and placed in a high-resolution temporal framework (Sell, Ainsaar & Leslie, Reference Sell, Ainsaar and Leslie2013; Bauert et al. Reference Bauert, Isozaki, Holmer, Aoki, Sakata and Hirata2014; Sell et al. Reference Sell, Samson, Mitchell, Mclaughlin, Koenig and Leslie2015). Additionally, an increasing number of sections are available with geochemical data that record the latest Sandbian – earliest Katian GICE interval, which is a useful tool for precise interregional correlation (e.g. Young et al. Reference Young, Saltzman, Bergström, Leslie and Xu2008; Ainsaar et al. Reference Ainsaar, Kaljo, Martma, Meidla, Männik, Nõlvak and Tinn2010; Bergström et al. Reference Bergström, Schmitz, Saltzman and Huff2010a , b; Bergström, Young & Schmitz, Reference Bergström, Young and Schmitz2010).
In Baltoscandia the GICE interval coincides not only with the first record of shallow-water reefs, but also with a low-diversity period of organic-walled microfossils (Kaljo, Nõlvak & Uutela, Reference Kaljo, Nõlvak and Uutela1996), and with a dramatic faunal turnover within a wide variety of faunal groups (Meidla, Reference Meidla1996; Ainsaar, Meidla & Martma, Reference Ainsaar, Meidla and Martma1999, Reference Ainsaar, Meidla and Martma2004). The later part of the GICE interval (falling limb of this stable isotope event in the δ13C curve) records a short-term basin-wide major change from a carbonate-dominated sedimentation toward a siliciclastic-dominated sedimentation within a transgressive regime (Ainsaar, Meidla & Martma, Reference Ainsaar, Meidla and Martma2004).
These perturbations are not restricted towards Baltoscandia. Time-equivalent environmental change is known also from North America. Over the vast area of the Appalachian Basin and the US Midcontinent, the GICE interval marks a rapid transition from tropical-type to temperate-type carbonates (Lavoie, Reference Lavoie1995; Holland & Patzkowsky, Reference Holland, Patzkowsky, Witzke, Ludvigson and Day1996; Patzkowsky et al. Reference Patzkowsky, Slupik, Arthur, Pancost and Freeman1997; Pope & Steffen, Reference Pope and Steffen2003; Ettensohn, Reference Ettensohn2010). The changes in the sedimentary regime coincide with marked changes in faunal composition and evolutionary dynamics (Holland & Patzkowsky, Reference Holland, Patzkowsky, Witzke, Ludvigson and Day1996; Patzkowsky et al. Reference Patzkowsky, Slupik, Arthur, Pancost and Freeman1997; Wright & Stigall, Reference Wright and Stigall2013). Similar changes within local sedimentary and faunal regimes globally provide compelling evidence for a perturbation of the global carbon cycle and significant global cooling during the GICE interval (e.g. Patzkowsky et al. Reference Patzkowsky, Slupik, Arthur, Pancost and Freeman1997; Saltzman & Young, Reference Saltzman and Young2005; Young et al. Reference Young, Saltzman, Bergström, Leslie and Xu2008; Calner, Lehnert & Nõlvak, Reference Calner, Lehnert and Nõlvak2010; Calner, Lehnert & Joachimski, Reference Calner, Lehnert and Joachimski2010; Rosenau, Herrmann & Leslie, Reference Rosenau, Herrmann and Leslie2012; Pancost et al. Reference Pancost, Freeman, Herrmann, Patzkowsky, Ainsaar and Martma2013).
The first appearance of widespread reefs and mounds in the Baltic Basin at the Keila–Oandu boundary can be effortlessly connected with these global events (e.g. Kröger, Hints & Lehnert, Reference Kröger, Hints and Lehnert2014; Kröger et al. Reference Kröger, Hints and Lehnert2014). However, at this time a detailed analysis does not exist in which the growth of the shallow reefs of, for example, the Vasalemma and Mjøsa formations and the coeval mud mounds of the Kullsberg Limestone can be traced back to specific changes in palaeo-oceanographic properties such as nutrient availability, oxygenation and water temperature.
A better palaeo-oceanographic data record exists for the younger Pirgu Stage interval in which reefs and especially mud mounds developed in abundance across large parts of the Baltic Basin. This interval is termed ‘Boda Event’ after the prominent mud mounds in the Boda Formation of central Sweden. Fortey & Cocks (Reference Fortey and Cocks2005) originally gave this label to a ‘short-lived episode of global warming’ before the Hirnantian glaciation. In its original sense, the event was rather a long time interval spanning the base of the Dicellograptus complanatus Graptolite Zone to the base of the Hirnantian (see discussion in Kröger, Ebbestad & Lehnert, Reference Kröger, Ebbestad and Lehnert2016). Taken literally as the time interval of the formation of the Boda Limestone mounds (and also of the formation of the mounds in central Estonia), the event would have spanned the early Pirgu – early Hirnantian ages (Dicellograptus anceps – Metabolograptus extraordinarius graptolite zones), a time interval with a length of nearly 3 Ma according to Cooper et al. (Reference Cooper, Sadler, Hammer, Gradstein, Gradstein, Schmitz and Ogg2012).
The initiation and climax of the formation of the Pirgu Stage mud mounds are interpreted as reflecting a relatively stable late Katian episode with high eustatic sea levels and well-oxygenated, oligotrophic, cool waters entering the Baltic Basin from the palaeo-north (Kiipli, Kiipli & Kallaste, Reference Kiipli, Kiipli and Kallaste2009; Kröger, Ebbestad & Lehnert, Reference Kröger, Ebbestad and Lehnert2016). In contrast, the terminal beds of the Boda Limestone mounds and of the Võhma mound of central Estonia developed during conditions of general sea-level fall, and less well-oxygenated and warmer bottom-level temperatures (Kröger, Ebbestad & Lehnert, Reference Kröger, Ebbestad and Lehnert2016). This interpretation agrees well with Melchin et al.’s (Reference Melchin, Mitchell, Holmden and Štorch2013) review of the ‘Boda event’ as an interval comprising an early and late Boda warming and a middle Boda cooling. In this scheme, the late Katian climax of reefs and mound formation would correspond to at least two subsequent episodes of Late Ordovician cooling and an intermediate phase of warming. This demonstrates that the highly variable Katian – Hirnantian climatic conditions alone are a poor predictor of reef and mound growth within the Baltic Basin.
5.b.4. Biotic factors
A number of biotic factors potentially influence the timing and extent of the bioherm formation on Baltica. Two important biotic factors are: (1) the taxonomic composition of its main constructors; and (2) the resilience of the organismic consortia that formed the individual bioherms.
(1) The foundation and expansion of specific types of bioherms relies on the evolutionary range and radiation of its main constructors. The key taxa in Ordovician reefs and mounds of Baltica are bryozoans, echinoderms, green algae, sponges, stromatoporoids and tabulate corals. A coincidence of an evolutionary first appearance of these groups with first appearances of specific reef and mound types in Baltica could indicate a causal relation between the two.
However, reef constructions with encrusting bryozoans (Cuffey, Reference Cuffey2006; Cuffey et al. Reference Cuffey, Chuantao, Zhu, Spjeldnaes, Hu, Ernst, Schäfer and Scholz2013), with root-like holdfasts of rhombiferans and crinoids (Alberstad & Walker Reference Alberstad and Walker1976; Toomey & Nitecki, Reference Toomey and Nitecki1979, p. 43) with sponges, stromatoporoids and tabulate corals (e.g. Webby et al. Reference Webby, Elias, Young, Neumann, Kaljo, Webby, Paris, Droser and Percival2004; Webby, Reference Webby, Elias, Young, Neumann, Kaljo, Webby, Paris, Droser and Percival2004, 2012; Nestor & Webby, Reference Nestor, Webby, Harper and Servais2013), are known from Lower and Middle Ordovician strata, older than any Baltoscandian reef. Likewise, the two dominant orders of siphonous green algae, the crown groups Bryopsidales and Dasycladales, had their initial diversification during Floian and Sandbian ages, respectively (Nitecki et al. Reference Nitecki, Webby, Spjeldnaes, Yong-Yi, Webby, Paris, Droser and Percival2004; Verbruggen et al. Reference Verbruggen, Ashworth, Loduca, Vlaeminck, Cocquyt, Sauvage, Zechman, Littler, Littler, Leliaert and De Clerck2009).
The appearance of reefs and mounds in the Baltic Basin therefore does not coincide with the evolutionary appearance of its main constructors. Similar types of reefs and mounds already existed during Middle Ordovician time. The main phases of Ordovician reef evolution and diversification took place earlier during Middle Ordovician time and the first half of the Sandbian age, and the centres of these diversifications were elsewhere in lower palaeolatitudes (Webby, Reference Webby, Kiessling, Flügel and Golonka2002).
Instead, the beginning of the growth of bioherms in Baltoscandia falls within a time interval which was characterized by a global expansion of reef occurrences and by a further geographical and bathymetrical differentiation of reef associations (Webby, Reference Webby, Kiessling, Flügel and Golonka2002). In all likelihood, Baltica entered the geographical zone of reef growth at palaeolatitudes <25°S when the main events of the Ordovician reef diversification had already occurred (see also Webby, Reference Webby, Kiessling, Flügel and Golonka2002), and the beginning of the reef development in Baltica was dictated mainly by its palaeogeographical shift.
(2) Biotic factors potentially played a major role in the stability of the reef development during Late Ordovician time. Ecological stability in reef ecosystems is predicted by reefal species diversity (Kiessling, Reference Kiessling2005). Species richness in reef environments is negatively correlated with change in ecological parameters during the entire Phanerozoic Eon (Kiessling, Reference Kiessling2005). Accordingly, the diversity of reef ecosystems generally promotes the stability of the system itself. Evidence of a similar effect can also be detected in reefs and mounds of Ordovician Baltoscandia.
The general Ordovician diversity curve for Baltica describes a bell shape, reaching maximum diversities for all major groups during the late Sandbian – early Katian Keila Stage and showing a subsequent Late Ordovician diversity decrease (Hammer, Reference Hammer2003; Hints et al. Reference Hints, Hints, Kaljo, Kiipli, Männik, Nõlvak and Pärnaste2010; Kaljo et al. Reference Kaljo, Hints, Hints, Männik, Martma and Nõlvak2011). The diversity of reef and mound assemblages, which remained stable or even increased, contrasts with this Baltoscandian Late Ordovician trend in falling diversity. In a comparison of Late Ordovician diversities from collections of the entire present-day Estonia with the diversity patterns in specific reef settings, this decoupling becomes most evident (Fig. 8). During Late Ordovician time the Baltic reef environments became increasingly taxonomically diverse.
Our review demonstrates that shallow-water reef and deeper-water mud mound environments became a constant component of the Baltic Basin during Late Ordovician time. The bioherms had a fundamental impact on the geometry of the carbonate platform within the Baltic Basin and its vicinity. The relative stability of the bioherm environments throughout the entire Late Ordovician period was probably enhanced by an increasingly diverse faunal inventory. This hypothesis can be tested in a future analysis of evolutionary rates of the Baltic reef and mound.
6. Conclusions
The late Keila Stage (latest Sandbian – earliest Katian) marks the beginning of a long-lasting period on Baltica with a widespread development of reefs in shallow and mud mounds in deeper epicontinental settings. Reefs and mounds persisted in the Baltic Basin probably with only little interruption during the late Hirnantian crisis until latest Silurian time (Flodén et al. Reference Flodén, Bjerkéus, Tuuling and Eriksson2001; Tuuling & Flodén, Reference Tuuling and Flodén2010). The start of the widespread growth of bioherms was accompanied by the establishment of a clear-cut facies differentiation into proximal, almost-pure, lime-mudstone, the so-called Baltic Limestone, and more argillaceous deeper deposits. At the same time, within an interval of no more than 1 Ma, the faunal assemblages of the basin changed substantially towards generally less endemic taxa and higher taxic abundances. The reasons for this early Katian turnover and the subsequent relative stability are complex.
(1) The main determining factor for the timing of the start of the Baltic bioherm development was probably the large-scale tectonic movement of the palaeocontinent from initially high southerly palaeolatitudes during Early Ordovician time towards palaeotropical latitudes during Late Ordovician time. The latitudinal shift was accompanied by an increasing tectonic stress, initial Caledonian movements in the palaeo-NW and the docking of Avalonia in the palaeo-SE, which led to gradually increasing lithospheric flexure in the region of the Baltic Basin. The punctuated depositional and faunal changes during the early Katian age indicate a rather rapid establishment of a new ecological status quo, the probable result of crossing a biogeographical boundary. A detailed analysis of the facies and faunal changes is needed to develop this hypothesis further. The currently available data suggest that the entry of Baltica in a geographical zone that allowed for a widespread bioherm formation was a major factor for the Sandbian radiation of reefal and reef-related organisms such as stromatoporoids, corals, pelmatozoans, bryozoans and siphonous green algae.
(2) The current spatiotemporal distribution of bioherms is a result of interdependent factors of relative sea level and climate during the time of deposition. The likelihood that bioherms are preserved from long-term erosion is higher when deposited during low sea level in deeper parts of the basin. At the same time, oceanographic conditions were more favourable during times of cooler global climates, low sea level and glacial episodes because of enhanced marine circulation, upwelling and oxygenation. The first appearance of widespread reefs and mud mounds on Baltica coincides with a period that is considered to be the onset of a long-lived glaciation during Late Ordovician time: the GICE interval. It is likely that the event triggered the reef and mound growth on Baltica, but a detailed palaeo-oceanographical analysis is not available to further test this hypothesis.
(3) The subsequent Late Ordovician establishment of a reef and mound environment on Baltica was originally interpreted as the ‘Boda Event’, named after the prominent mud mounds in the Boda Limestone Formation of central Sweden. The growth of individual mounds in the Boda Limestone and in time-equivalent mounds elsewhere lasted over a period of more than 3 Ma from the late Katian to well into the early Hirnantian age. This time interval records substantial climatic changes such as changes in relative sea level, oxygenation level and clastic sediment load of the covering water column. Climatic factors and subsidence levels alone do not explain the surprisingly stable reef and mound development during this time.
(4) Biotic factors poorly explain the initiation of the Late Ordovician reef and mound growth in the Baltic Basin but there is evidence that, once established, the ecosystems developed a robust resilience against changing physicochemical disturbances. The local diversity trajectories of mound and reef environments increased during the Katian–Hirnantian ages, which contradicts the generally declining Late Ordovician diversities across Baltica. Further studies are needed to test the hypothesis of an increasing resilience and stability.
In summary, these four points underline the need for further palaeo-ecological and palaeo-oceonographic studies for a better understanding of the dynamics of Ordovician diversification processes. The stratigraphic resolution and the tools for data compilation and analysis are already in place, and an increasing repertoire of geochemical analyses is available to solve these problems.
Acknowledgements
We are grateful to B. Gudveig Baarli (Williamstown, MA, USA), Andrei Dronov (Moscow, Russia), Jan Ove Ebbestad (Uppsala, Sweden), Olle Hints (Tallinn, Estonia), Hans Arne Nakrem (Oslo, Norway), Juozas Paškevičius (Vilnius, Lithuania) and Igor Tuuling (Tartu, Estonia) for providing us with valuable information about reef occurrences. Lee Hsiang Liow (Oslo, Norway) helped with details of the diversity estimation. OL is very grateful for the support of this research by the Deutsche Forschungsgemeinschaft (DFG project LE 867/8-1 and 8-2). OL also thanks the Estonian Research Council for the support of his research on the Late Ordovician period of Estonia (grant PUT 378). We thank Michael Joachimski for running the carbon isotope samples in his stable isotope laboratory at the Geocenter of Northern Bavaria in Erlangen (Germany). This paper is part of the DFG financed project Kröger 2095/7-1 and a contribution to the IGCP 591 project ‘The Early to Middle Paleozoic Revolution’. The careful reviews of Leho Ainsaar (Tartu, Estonia) and one anonymous reviewer significantly helped to improve the quality of an earlier version of the manuscript; the authors are grateful for the constructive criticism during the review process.
Supplementary material
To view supplementary material for this article, please visit http://dx.doi.org/10.1017/S0016756816000303.