





Introduction
There is a global trend toward a more lenient approach to cannabis use, with an increasing push for commercialization and legal sales (Murray & Hall, Reference Murray and Hall2020). In the United States, twenty-four states, three territories, and the District of Columbia have legalized marijuana for recreational use among adults (“State Cannabis Policy Enactment Database,” 2024). Beyond the United States, Uruguay and Canada legalized non-medical cannabis nationally in 2013 and 2018, respectively, and several European countries have since followed, including Malta, Luxembourg, and Germany, while medical cannabis is now permitted in a far larger number of jurisdictions. Alongside these regulatory changes, global prevalence of cannabis use has continued to rise. Cannabis potency has also increased substantially, with tetrahydrocannabinol (THC) concentrations in herbal cannabis and resin rising markedly over recent decades, and use of higher-potency products has been associated with increased risks of psychosis and cannabis use disorder (Chandra et al., Reference Chandra, Radwan, Majumdar, Church, Freeman and ElSohly2019; Di Forti et al., Reference Di Forti, Quattrone, Freeman, Tripoli, Gayer-Anderson, Quigley and van der Ven2019; Freeman et al., Reference Freeman, Craft, Wilson, Stylianou, ElSohly, Di Forti and Lynskey2021; Petrilli et al., Reference Petrilli, Ofori, Hines, Taylor, Adams and Freeman2022). The World Drug Report for 2023 revealed that an estimated 219 million people worldwide were habitual cannabis users, making it the most commonly used substance after alcohol and tobacco (“World Drug Report 2023,” 2023). Consequently, the increasing use of cannabis together with the production of high-potency forms of the drug has become a significant public health concern. It is well established that cannabis consumption leads to impairment in attention, motivation, and memory (Ranganathan & D’Souza, Reference Ranganathan and D’Souza2006). Its use has been linked to an increased risk of motor vehicle accidents, including fatal collisions (Myers, Bonar, & Bohnert, Reference Myers, Bonar and Bohnert2023). Much attention has been focused on the well-established evidence that prolonged heavy cannabis use can raise the risk of developing psychotic disorders (Di Forti et al., Reference Di Forti, Quattrone, Freeman, Tripoli, Gayer-Anderson, Quigley and van der Ven2019) and that continued use worsens clinical and functional outcomes in those who have psychosis. Although the adverse effects of cannabis use on physical and mental health have been extensively investigated, considerably less attention has been directed toward harms to others, including interpersonal violence.
A possible link between cannabis use and violence has provoked much speculation in the media (e.g. Granger, Reference Granger2025; “Marijuana Harmless?,” 2025) and has increasingly attracted academic attention, including in systematic reviews and broader work examining cannabis-related harms and their public health implications (Finn, Murray, Stuyt, & Randall, Reference Finn, Murray, Stuyt and Randall2026; Fischer, Daldegan-Bueno, & Reuter, Reference Fischer, Daldegan-Bueno and Reuter2021; Fischer, Lindner, Jutras-Aswad, & Hall, Reference Fischer, Lindner, Jutras-Aswad and Hall2023). Previous systematic reviews have examined this association in specific populations, including patients with severe mental illness (Dellazizzo et al., Reference Dellazizzo, Potvin, Beaudoin, Luigi, Dou, Giguère and Dumais2019) and broader samples of adolescents and adults (Zhong, Yu, & Fazel, Reference Zhong, Yu and Fazel2020). However, important uncertainties remain regarding the magnitude and consistency of the association across different populations and violent outcomes. Schizophrenia and other psychotic disorders have known associations with violent behaviors (Fazel et al., Reference Fazel, Gulati, Linsell, Geddes and Grann2009); however, it appears that much of the elevated risk is mediated by comorbid substance abuse. For example, in England and Wales, substance misuse was common among individuals with schizophrenia who committed homicide, with cannabis among the most frequently reported substances (Appleby et al., Reference Appleby, Kapur, Shaw, Turnbull, Hunt, Ibrahim, Bojanić, Graney, Baird, Rodway, Tham, Rivart and Burns2023).
Although previous systematic reviews have examined the association between cannabis use and violence in selected populations, there has been no comprehensive systematic review and meta-analysis synthesizing evidence across both the general population and patients with severe mental illness while considering both perpetration and victimization. Therefore, we conducted a comprehensive systematic review and meta-analysis to examine the association between cannabis use and involvement in violent events. We specifically focused on two groups: cannabis users (a) within the general population, and (b) among patients with severe mental illness. Recognizing the intricate interplay between cannabis use and violent outcomes, we also investigated potential sources of heterogeneity among studies, including differences in study design. In essence, this study seeks to shed light on whether, and to what extent, cannabis use is linked to occurrences of violence.
Methods
Search strategy and selection criteria
The PRISMA (Preferred Reporting Items for Systematic Reviews and Meta-Analyses) standards were applied to this systematic review and meta-analysis (the checklists are provided in the Supplementary eTable 1) (Deshpande et al., Reference Deshpande, Asselt, Tomini, Armstrong, Allen, Noake and Westwood2013). The review was registered at PROSPERO in March 2021 under the protocol number CRD42021240658.
Data search was conducted and subsequently updated following additional searches in MEDLINE, EMBASE, and PsycINFO through the Ovid platform for articles published from the inception of each database to November 2024. We searched Medical Subject Headings (MeSH) and keywords related to: (1) violence; (2) cannabis use, connected using the Boolean operators (full list of search terms provided in Supplementary Material – Search Terms).
Inclusion and exclusion criteria
Studies were included if they satisfied the following criteria: (1) were performed in humans both from the general population and from clinical samples including all forms of clinical diagnoses (Population); (2) measured cannabis use in any form, studies were eligible if they reported any cannabis use prior to the violent outcome (Intervention/risk factor), see eAppendix 2.1 for a detailed description; (3) either as a perpetrator or as a victim of a violent act against or in comparison with non-users within the same population (Comparison); (4) examined the relationship between cannabis use and subsequent episodes of violence (Outcome), including physical, sexual, or psychological violence as defined by the original study, where multiple violent outcomes were reported, the most severe available outcome was extracted (see eAppendix 2.2 for further details on definition of outcome); and (5) published in English language. Studies were classified as involving the general population when participants were recruited from community or population-based samples, and as clinical populations when participants were recruited from psychiatric or other clinical settings with a diagnosed mental disorder. Studies reporting violence perpetration and victimization separately contributed to the corresponding meta-analysis for each outcome.
Studies were excluded if the reported exposure included cannabis combined with other substance use (e.g., alcohol, amphetamines). We excluded from quantitative analyses any overlapping samples, prioritizing the larger sample or more recent study. Non-original and peer-reviewed research (conference abstracts, reviews, grey literature, etc.) were also excluded. Eligible studies were excluded from the quantitative synthesis if data for effect size calculation were unavailable or the reported outcomes could not be harmonized across studies. Detailed reasons for exclusion are provided in Supplementary eTable 6.
Screening, quality assessment and data extraction procedures
Titles and abstracts, and subsequently selected eligible full texts of articles, were screened independently by three reviewers (PM, MG, and GT); title and abstract discrepancies were resolved through discussion at a team meeting; full-text discrepancies were screened by a third independent reviewer (EV). A cross-reference search extracted title/abstract from identified relevant reviews on the same topic, and a full-text check of potentially eligible studies from the references cited in these reviews was performed by three authors (PM, MG, and GT). Quality assessment was carried out using the Newcastle–Ottawa Scale by three independent reviewers (PM, MG, and GT) (Luchini, Stubbs, Solmi, & Veronese, Reference Luchini, Stubbs, Solmi and Veronese2017). Details on the instrument items and quality assessment procedures can be found in the Supplementary Material. The agreed quality grades of each study are presented in Supplementary eTable3 (Supplementary Material). Studies were awarded a maximum of nine points on items related to the selection of the cohort/cases, comparability of exposed and non-exposed groups, ascertainment of exposure and outcome, and adequacy of follow-up.
Data analysis
Pooled data were presented as ORs and 95% CIs to show the association between cannabis use and risk of being a perpetrator or victim of violence. When results were given separately between men and women, individual effect sizes were pooled into a single estimate per study. Given the substantial differences in the studied populations, we performed separate meta-analyses of studies in the general population from studies in clinical samples. Similarly, based on the outcomes, we examined separately studies measuring the effect of cannabis on being a perpetrator versus being a victim of violent acts. All analyses were conducted using Stata 16.0 (StataCorp, TX, USA).
Due to fundamental differences in study design, high heterogeneity was anticipated and assessed using the I2 test (Higgins & Thompson, Reference Higgins and Thompson2002). According to others (Higgins, Thompson, Deeks, & Altman, Reference Higgins, Thompson, Deeks and Altman2003), we considered an I2 value below 50% as low, 50% – 75% as moderate, > 75% as high, and we used random-effects models to estimate pooled effects. To investigate potential sources of heterogeneity, subgroup analyses were undertaken according to gender, type of violence, source of reported violence, and population (i.e., general or psychiatric population).
To assess publication bias, we examined funnel plot asymmetry, applied Duval’s trim-and-fill method to estimate potential unpublished studies with negative results, and conducted Egger’s test (p < 0.05 might indicate potential publication bias) (Harbord, Egger, & Sterne, Reference Harbord, Egger and Sterne2006; Rothstein, Sutton, & Borenstein, Reference Rothstein, Sutton and Borenstein2006). These analyses were also restricted to studies rated at least “fair” quality to minimize the influence of low-quality data.
We conducted sensitivity analyses stratifying studies based on quality assessment, design, and whether unadjusted or adjusted OR was provided.
Results
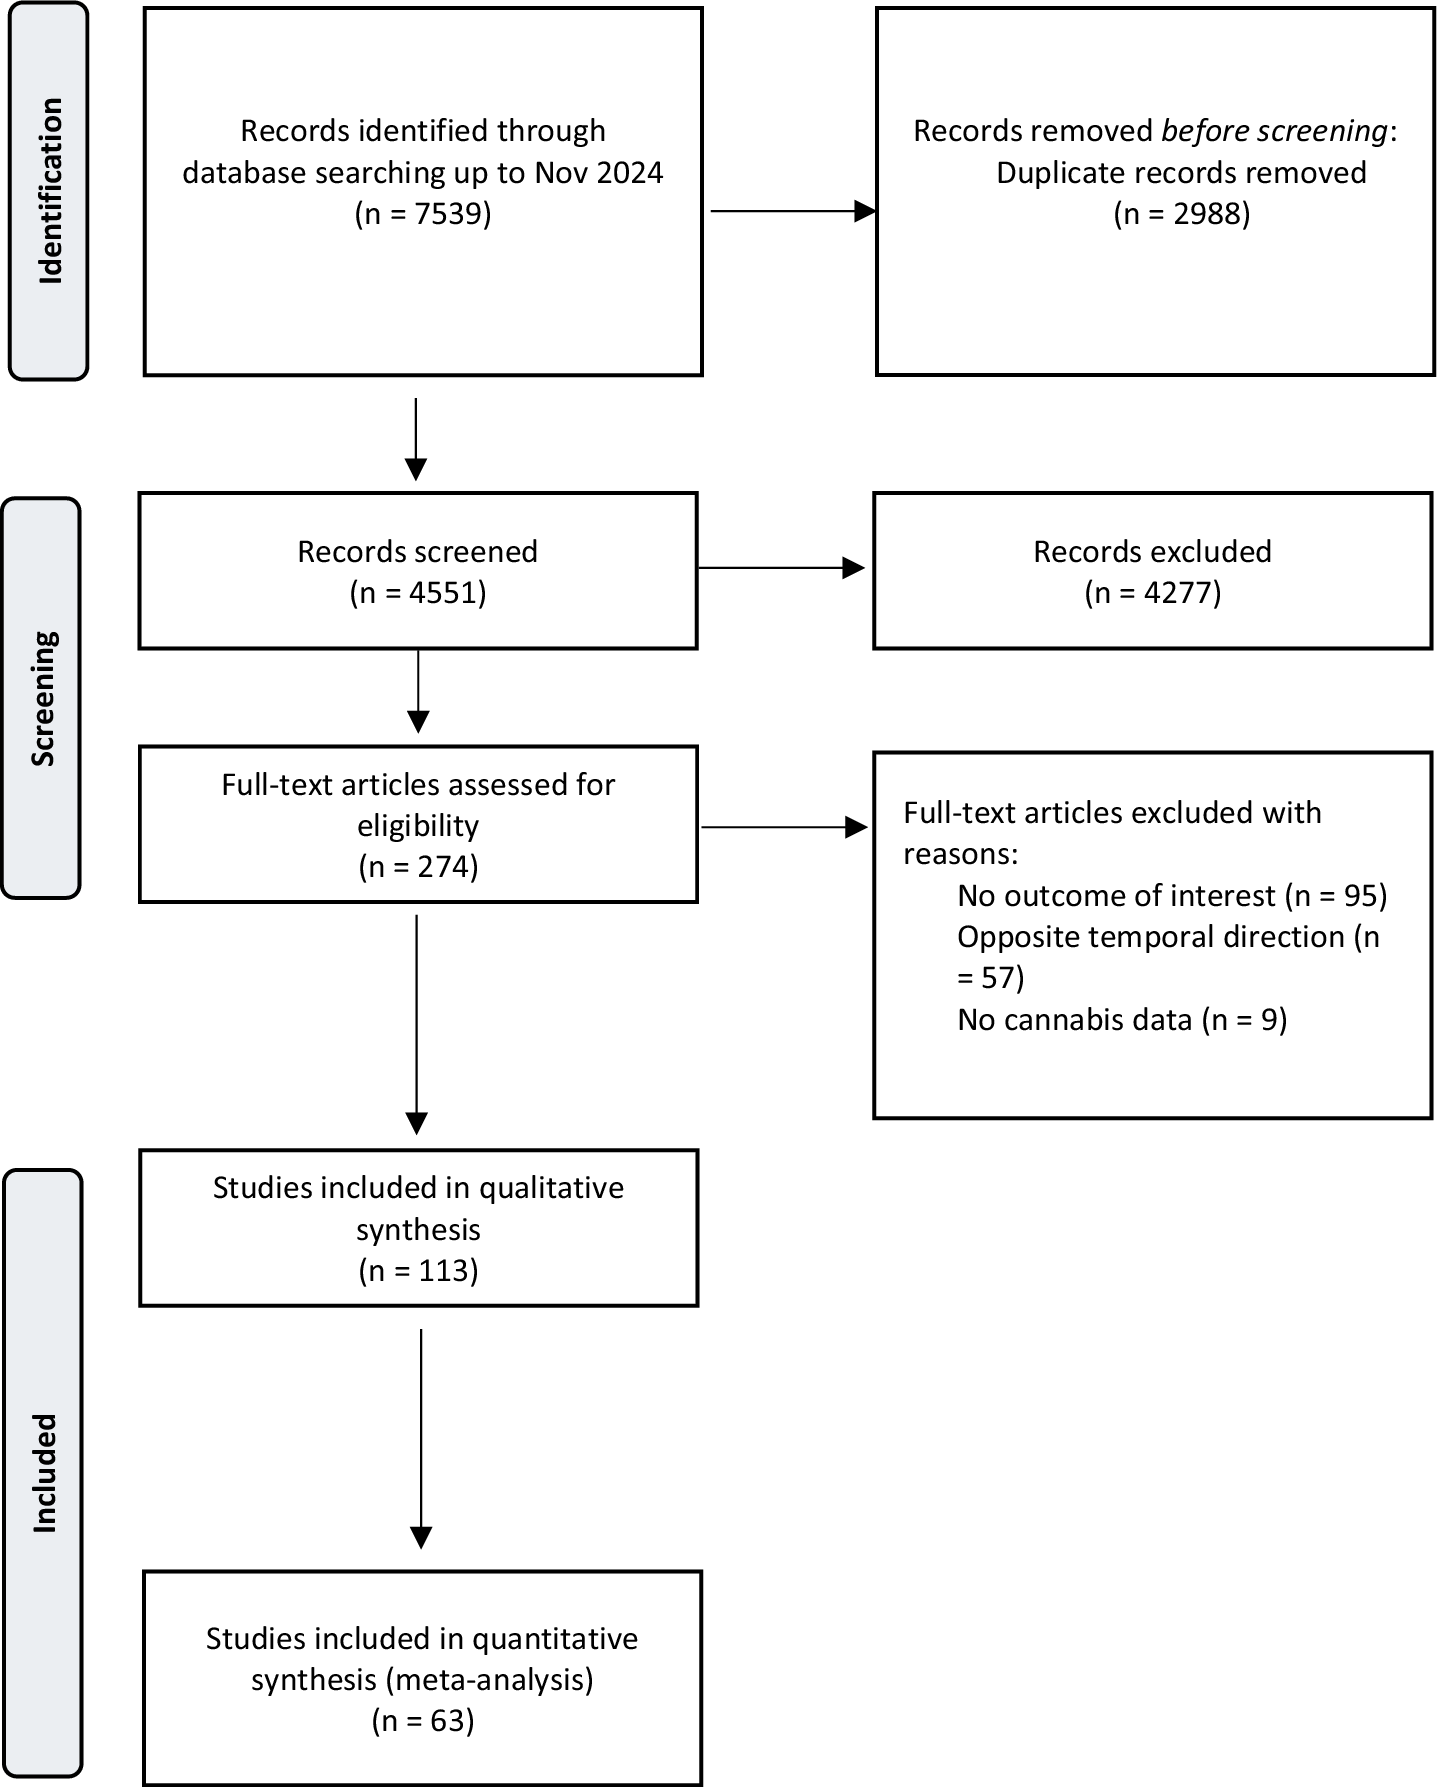
From the initial search, we identified 7539 studies. 113 met the inclusion criteria for qualitative synthesis, and 63 of these were included in the quantitative meta-analysis. Reasons for the exclusion of 50 studies from the quantitative analysis included: (i) lack of data to calculate ORs when these were not provided, and (ii) duplication or overlap of samples. Figure 1 summarizes the flow chart of the study selection.
Flow chart of included studies for qualitative and quantitative analyses. Note: Flow diagram of database search by November 2024.

Figure 1. Long description
The flowchart is organized into three vertical phases labeled on the left.
1. Identification phase
* Top-left box: Records identified through database searching up to Nov 2024 (n = 7539).
* An arrow points right to a box: Records removed before screening: Duplicate records removed (n = 2988).
* An arrow points down to the next phase.
2. Screening phase
* First central box: Records screened (n = 4551).
* An arrow points right to a box: Records excluded (n = 4277).
* An arrow points down from screened records to a second central box: Full-text articles assessed for eligibility (n = 274).
* An arrow points right to a box: Full-text articles excluded with reasons: No outcome of interest (n = 95), Opposite temporal direction (n = 57), and No cannabis data (n = 9).
* An arrow points down to the final phase.
3. Included phase
* First central box: Studies included in qualitative synthesis (n = 113).
* An arrow points down to the final box: Studies included in quantitative synthesis (meta-analysis) (n = 63).
Among the 64 studies included in meta-analyses (one study included two independent samples, resulting in 64 total samples from 63 unique studies): 46 were cross sectional and 17 were prospective; 50 explored associations in the general population, and 13 looked at psychiatric samples. In our quality assessment, 13 of the 63 studies (20.6%) were rated as “good,” 45 (71.4%) as “fair,” and 5 (7.9%) as “poor”; detailed ratings are provided in Supplementary Material (Supplementary eTable3). Out of the 77 reported effects (some studies examined both being perpetrator and victim of violence), 47 examined the association of cannabis with being a perpetrator; and 30 with being a victim of violence.
Characteristics of included studies are provided in Table 1 and Supplementary Material (Supplementary eTable4). Main analyses were conducted on 47 studies showing associations between cannabis use and being a perpetrator of violence: 33 cross-sectional and 14 longitudinal; 34 on the general population and 13 on psychiatric populations. They included a total of 208,951 exposed individuals (199,660 from the general population and 9291 psychiatric patients). For the association between having used cannabis and being a victim of violence, we included 22 cross-sectional and 8 longitudinal general population studies (86510 exposed).
List of studies by prediction of being perpetrator or victim included for meta-analyses

Table 1. Long description
The table is organized into ten columns: References, Cohort name and/or country, Study design, Sample size, Age range (M age), F %, Population, Victims/perpetrators/both, Cannabis use assessment, and Outcome assessment/type of violence.
Key entries include:
* Afifi et al. (2012): Canada, Cross-sectional, 25,778 participants, GP population, assessing both victims and perpetrators using A U D A D I S - I V and Short C T S for I P V.
* Arseneault et al. (2000): New Zealand, Cross-sectional, 39 participants, S S D population, perpetrators only, using S R D I and N Y S questionnaire.
* Beaudoin et al. (2020): Canada, Longitudinal, 965 participants, S C Z population, perpetrators only, using G C S I and M A C V I.
* Carabellese et al. (2013): Italy, Cross-sectional, 1,582 participants, various mental health disorders (Mood, Psychotic, Anxiety), perpetrators only.
* Dim and Elabor-Idemudia (2024): Canada, Cross-sectional, 26,456 participants, GP population, both victims and perpetrators, using C T S for I P V.
* Volkow et al. (2024): U S A, Cross-sectional, 23,235 participants, GP population, perpetrators only, using self-report.
Population types include G P (General Population), S C Z (Schizophrenia), S S D (Schizophrenia Spectrum Disorders), and F E P p (First-episode psychosis patients). Outcome assessments frequently include I P V (Intimate Partner Violence), D V (Domestic Violence), and N P V (Non-partner violence). Assessment tools mentioned include C T S, Y R B S, and N S D U H.
Note: GP, general population; SCZ, schizophrenia; SZA, schizoaffective disorder; SSD, schizophrenia spectrum disorders; FEPp, first-episode psychosis patients; ENAp, early non-affective psychosis; EP, early psychosis; SUD, substance use disorder; PD, personality disorder; NA, not available; IPV, intimate partner violence; DV, domestic violence; NPV, non-partner violence.
Cannabis use assessment tools: AUDADIS-IV, Alcohol Use Disorder and Associated Disabilities Interview Schedule-IV; ASSIST, Alcohol, Smoking and Substance Involvement Screening Test; CUDIT-R, Cannabis Use Disorders Identification Test-Revised; CIDI-SAM, Composite International Diagnostic Interview – Substance Abuse Module; SCID, Structured Clinical Interview for DSM; TLFB, Timeline Follow-Back; YRBS, Youth Risk Behavior Survey; NSDUH, National Survey on Drug Use and Health; CMR, clinician-rated measures; GCSI, Global Cannabis Severity Index; SRDI, self-reported drug involvement; MATE, Measurements in the Addictions for Triage and Evaluation; SAOM, self-administered outcome measure; REDCap, Research Electronic Data Capture.
Outcome assessment tools: CTS/CTS-2, Conflict Tactics Scale (revised versions where specified); HITS, Hurt, Insult, Threaten, Scream; CAS, Composite Abuse Scale; LEC, Life Events Checklist; SOAS-R, Staff Observation Aggression Scale-Revised; LHA, Life History of Aggression; ABQ, Aggression Behavior Questionnaire; SES, Sexual Experiences Survey; MACVI, measure of aggression/violence (study-specific); GLSS, Ghana Living Standards Survey; national reg, national registry data; original questionnaire, non-validated study-specific instrument.
Among individuals from the general population, the combined pooled effect showed a significantly increased risk among cannabis users of being a perpetrator of violence (OR 2.05, 95% CI 1.74–2.41), with little difference when “poor” quality studies were excluded (OR 2.02, 95% CI 1.70–2.40) (Supplementary eFigure1A). The association remained significant when analyses were restricted to longitudinal studies, although the effect size was substantially smaller (OR 1.17, 95% CI 1.07–1.28) than in cross-sectional studies (OR 2.37, 95% CI 1.66–3.40) (Supplementary eFigure2). In subgroup analyses in the studies with single sex participants, we observed that the combined odds were slightly lower in males (OR 1. 51, 95% CI 1.29–1.78) than in females (OR 1.98, 95% CI 1.33–2.97) (Figure 2). The effect of cannabis on the risk of being a perpetrator was higher in studies of psychiatric patients (OR 2.49, 95% CI 1.72–3.61) than in the general population (Figure 3). The association with becoming a perpetrator within an intimate relationship or in the context of dating was lower (OR 1.22, 95% CI 1.11–1.35) than that of being a perpetrator in other contexts (OR 2.79, 95% CI 1.92–4.07) (Supplementary eFigure3). A significant risk of being a victim of violence following cannabis use was found (OR 1.49, 95% CI 1.38–1.60), in particular for females and mixed gender studies compared to males (Figure 4). This did not change if studies rated as “poor” were excluded (OR 1.46, 95% CI 1.36–1.57) (Supplementary eFigure1C). Table2 summarizes the findings of all the analyses we carried out.
Forest plot – Perpetrator in the general population by gender. The yellow circles represent the point estimates of the effect sizes, with the size of each circle proportional to the study’s weight in the meta-analysis. The horizontal bars extending from each circle depict the 95% confidence intervals. A narrower bar signifies a more precise estimate. The term ‘Both’ refers to studies that included participants of all genders, without differentiating between male and female data in the analysis. The diamonds represent the pooled effect size for each subgroup and the overall effect size, integrating the data from all included studies. Note: Forest plot of the association between cannabis use and violence grouped by gender.

Figure 2. Long description
A forest plot table with columns for Author and year, Sample size, E S (95 percent C I), and percent Weight. The x-axis at the bottom uses a logarithmic scale with markers at .3, 1, 5, 10, and 20. A solid vertical line is at 1 (null effect) and a dashed red vertical line represents the overall pooled effect size.
* Subgroup Both: Contains 19 studies. Point estimates range from Lim (2016) at 1.12 to Ghoussoub et al. (2022) at 9.58. The subtotal diamond is centered at 2.43 with a 95 percent C I of 1.63 to 3.62. I-squared is 99.0 percent.
* Subgroup Male: Contains 15 studies. Point estimates range from Blitstein (2005) at 0.61 to Schoeler (2016) at 8.94. The subtotal diamond is centered at 1.51 with a 95 percent C I of 1.29 to 1.78. I-squared is 93.2 percent.
* Subgroup Female: Contains 11 studies. Point estimates range from Grest (2018) at 0.84 to Silva (2014) at 7.00. The subtotal diamond is centered at 1.98 with a 95 percent C I of 1.33 to 2.97. I-squared is 90.7 percent.
* Overall: The final pooled diamond at the bottom is centered at 2.05 with a 95 percent C I of 1.74 to 2.41. Total I-squared is 98.6 percent, p equals 0.000.
Forest plot – Perpetrator in Psychiatric Population in both genders. The yellow circles represent the point estimates of the effect sizes, with the size of each circle proportional to the study’s weight in the meta-analysis. The horizontal bars extending from each circle depict the 95% confidence intervals. A narrower bar signifies a more precise estimate. The diamond at the bottom represents the overall effect size, integrating the data from all included studies. Note: Forest plot of the association between cannabis use and violence grouped by gender.

Figure 3. Long description
A forest plot organized into columns: Author, year; Sample size; E S (95 percent C I); and percent Weight. The x-axis at the bottom is a logarithmic scale with markers at .3, 1, 5, 10, and 20. A solid vertical line is positioned at 1 (no effect), and a dashed vertical line represents the pooled effect size.
Thirteen studies are listed vertically:
- Dharmawardene, 2017: Sample 141, E S 1.06 (1.01, 1.11), Weight 9.34.
- Lamsma, 2019: Sample 701, E S 1.50 (0.99, 2.27), Weight 8.36.
- Park, 2019: Sample 1888, E S 1.58 (1.01, 2.48), Weight 8.21.
- Rolin, 2018: Sample 366, E S 2.00 (1.22, 3.28), Weight 8.01.
- Lamsma, 2019: Sample 642, E S 2.00 (1.34, 2.99), Weight 8.43.
- Dugre, 2017: Sample 1136, E S 2.44 (1.06, 5.62), Weight 6.34.
- Dawson, 2018: Sample 251, E S 2.77 (0.93, 8.24), Weight 5.16.
- Harris, 2010: Sample 85, E S 2.90 (1.04, 8.09), Weight 5.44.
- Dan-Glauser, 2022: Sample 240, E S 2.91 (1.61, 5.27), Weight 7.54.
- Carabellese, 2013: Sample 1582, E S 3.70 (1.48, 9.26), Weight 5.94.
- Arseneault, 2000: Sample 936, E S 3.80 (2.16, 6.68), Weight 7.68.
- Beaudoin, 2020: Sample 965, E S 3.98 (2.47, 6.41), Weight 8.09.
- Krakowski, 2016: Sample 118, E S 4.14 (1.03, 16.63), Weight 4.03.
- Moulin, 2018: Sample 240, E S 5.45 (2.94, 10.09), Weight 7.43.
At the bottom, two diamonds represent the overall effect. The primary aggregate row states: Overall (I-squared = 89.4 percent, p = 0.000), E S 2.49 (1.72, 3.61), Weight 100.00.
Forest plot – Victims in the General Population by gender. The yellow circles represent the point estimates of the effect sizes, with the size of each circle proportional to the study’s weight in the meta-analysis. The horizontal bars extending from each circle depict the 95% confidence intervals. A narrower bar signifies a more precise estimate. The term ‘Both’ refers to studies that included participants of all genders, without differentiating between male and female data in the analysis. The diamonds represent the pooled effect size for each subgroup and the overall effect size, integrating the data from all included studies. Note: Forest plot of the association between cannabis use and violence grouped by gender.

Figure 4. Long description
The plot is organized into four vertical sections.
1. Both Subgroup: Contains 12 studies. Point estimates range from Whitton et al. (1.13) to Yan (15.34). The subtotal diamond is centered at 1.94 with a 95 percent C I of 1.52 to 2.47. I-squared is 93.1 percent.
2. Male Subgroup: Contains 12 studies. Estimates range from Kraanen (0.81) to Yan (5.36). The subtotal diamond is centered at 1.30 with a 95 percent C I of 1.14 to 1.48. I-squared is 88.8 percent.
3. Female Subgroup: Contains 15 studies. Estimates range from Grest (0.56) to Caldentey (6.11). The subtotal diamond is centered at 1.60 with a 95 percent C I of 1.37 to 1.88. I-squared is 93.2 percent.
4. Overall Estimate: At the bottom, a final diamond represents the pooled effect size of 1.49 with a 95 percent C I of 1.38 to 1.60. The total weight is 100.00 percent.
The X-axis at the bottom uses a logarithmic scale with markers at .3, 1, 5, 10, and 20. A solid vertical line of no effect is positioned at 1, and a dashed red vertical line represents the overall pooled estimate. Yellow circles of varying sizes indicate study weights, and horizontal black lines represent confidence intervals.
Summarising table of main analyses, subgroup analyses, and sensitivity analyses

Table 2. Long description
The table is organized into six columns: Analysis Category, Number of studies, O R, 95% C I, I super 2, and p-value.
Main analyses:
* Perpetrators in the General Population: 45 studies, O R 2.05, C I 1.74 to 2.41, I super 2 98.6%, p 0.000.
* Perpetrators in Psychiatric Population: 14 studies, O R 2.49, C I 1.72 to 3.61, I super 2 89.4%, p 0.000.
* Victims in the General Population: 39 studies, O R 1.49, C I 1.38 to 1.60, I super 2 93.1%, p 0.000.
Subgroup analyses highlights:
* Perpetrator in General population male: 15 studies, O R 1.51, p 0.000.
* Perpetrator in General population female: 11 studies, O R 1.98, p 0.000.
* Perpetrator in Psychiatric population longitudinal studies: 4 studies, O R 3.71, C I 2.73 to 5.05, I super 2 6.0%, p 0.363.
* Perpetrator in General population reported criminal conviction: 3 studies, O R 3.75, I super 2 0.0%, p 0.377.
* Perpetrator in Psychiatric population reported criminal conviction: 3 studies, O R 4.21, I super 2 0.0%, p 0.504.
* Victims in General population longitudinal studies: 8 studies, O R 1.05, p 0.000.
Sensitivity analyses:
* Perpetrator in General population fair quality: 41 studies, O R 2.02, p 0.000.
* Perpetrator in Psychiatric population fair quality: 13 studies, O R 2.47, p 0.000.
* Victims in General population fair quality: 38 studies, O R 1.46, p 0.000.
Bold values indicate statistical significance (P < 0.05). Also, P values currently reported as 0.000 should be presented as P < 0.001.
In a small number of studies identifying violence as involving a criminal conviction, we found a higher effect size in both general population (OR 3.75, 95%CI 2.54–5.53) and psychiatry population (OR 4.21, 95% CI 2.86–6.22) compared with self-reported violence (OR 2.02, CI 95% 1.66–2.46 for general population and OR 2.18, 95% CI 1.51–3.14 for psychiatric) (Supplementary eFigures 4 and 5). Further analyses were run to test for differences between unadjusted and adjusted ORs, with very similar estimates (adjusted OR 2.01, 95% CI 1.40–2.89; unadjusted OR 2.19, 95% CI 1.68–2.85) (Supplementary eFigures 6 and 7).
We included twenty-one cross-sectional and eight longitudinal general population studies (84395 exposed), which explored the association between having used cannabis and being a victim of violence. The combined pooled effect from the random-effects meta-analyses showed a slightly increased risk of being a victim of violence (OR 1.49, 95% CI 1.38–1.60); this did not change if studies rated as “poor” were excluded (OR 1.46, 95% CI 1.36–1.57) (Supplementary eFigure1C).
In subgroup analyses by gender, females using cannabis (OR 1.60, 95% CI 1.37–1.88) were more at risk of being a victim of violence than males (OR 1.30, 95% CI 1.14–1.48) (Figure 4). The risk of being a victim was less likely within an intimate relationship or in the context of dating (OR 1.39, 95% CI 1.28–1.51) than in other relational contexts (OR 1.88, 95% CI 1.44–2.45) (Supplementary eFigure8).
The subgroup analyses on study design in victims of violence showed a smaller pooled effect from longitudinal studies (OR 1.05, 95% CI 1.01–1.10) than from cross-sectional studies (OR 2.20, 95% CI 1. 80–2.68) (Supplementary eFigure9). We could not explore differences based on the source of information on reported violence, but the results showed small variation based on utilized effect size (unadjusted or adjusted OR) (Supplementary eFigure10).
The asymmetrical distribution of the funnel plots, both for perpetrators and victims, raises the possibility of publication bias or other small-study effects (Supplementary eFigures 12–20), which was confirmed by significant Egger regression tests (p < 0.001). The trim-and-fill method was used to correct for publication bias, yielding a similar overall effect size compared to the uncorrected for perpetrators in the general population (OR 2.12, 95% CI 1.68–2.69) but somewhat lower in the psychiatric population (OR 1.85, 95% CI 1.37–2.51) and for victims (OR 1.52, 95% CI 1.17–1.98). Further analysis demonstrated how these biases may differentially impact the results based on the study design and the source of information. Specifically, pooled results from cross-sectional studies of offenders remained the same (OR 2.39, 95% CI 1.86–3.01), whereas corrected results from longitudinal studies appeared reduced (OR 1.5, 95% CI 1.01–2.26). This extended to the source of information, with significant but reduced findings in offenders based on criminal records (OR 3.51, 95% CI 2.41–5.12) but unchanged in self-reported violence (OR 2.02, 95% CI 1.59–2.58).
Discussion and conclusions
We carried out a systematic review and meta-analysis, including a total of 63 studies, to explore the association between cannabis use and violent events, both as perpetrators and victims, in two distinct populations: (a) cannabis users in the general population and (b) patients with severe mental illness.
Overall, our findings show an increased risk of carrying out interpersonal violence, including severe types of violence such as aggravated assault, sexual aggression, fighting, and robbery, in cannabis users. The high effect size for convictions of violence among cannabis users is of particular importance given the severity of this violence and the likely greater reliability of these data than self-report.
Possible explanations for the association between cannabis use, particularly high doses, and violence include impairments in attention, executive function, inhibition, and problem-solving abilities (Crean et al., Reference Crean, Tapert, Minassian, MacDonald, Crane and Mason2011). Prolonged heavy use can also influence mood and emotional regulation, including feelings of anger and hostility (Gruber, Rogowska, & Yurgelun-Todd, Reference Gruber, Rogowska and Yurgelun-Todd2009). Moreover, during periods of cannabis withdrawal, individuals may experience irritability, anxiety, restlessness, and impaired functioning, potentially leading to aggressiveness (Connor et al., Reference Connor, Stjepanović, Budney, Le Foll and Hall2022). Most importantly, regular cannabis use increases the likelihood of experiencing paranoia, causing individuals to interpret neutral stimuli as potentially threatening, leading individuals to believe that they must defend themselves (Freeman et al., Reference Freeman, Dunn, Murray, Evans, Lister, Antley, Slater, Godlewska, Cornish, Williams, di Simplicio, Igoumenou, Brenneisen, Tunbridge, Harrison, Harmer, Cowen and Morrison2015). In addition, cannabis users tend to exhibit higher levels of impulsivity and engage in more risk-taking behaviors, which could lead to antisocial and criminal activities as part of their lifestyle (Moeller & Dougherty, Reference Moeller and Dougherty2002). These mechanisms represent only one component of the broader relationship between drugs and violence, which has also been conceptualized as involving psycho-pharmacological, economic-compulsive and systemic pathways (Goldstein, Reference Goldstein1985). However, these psycho-pharmacological mechanisms are unlikely to fully explain the observed association. Cannabis use frequently co-occurs with a range of individual, social and environmental factors, including impulsivity, antisocial traits, adverse socioeconomic circumstances and exposure to violent environments, that may independently contribute to violence risk. The available evidence therefore suggests that the association between cannabis use and violence is likely to reflect multiple interacting pathways rather than a single direct causal mechanism.
The risk of violence appears to be higher among psychiatric patients, corroborating the findings from an earlier meta-analysis (Dellazizzo et al., Reference Dellazizzo, Potvin, Beaudoin, Luigi, Dou, Giguère and Dumais2019). In people with psychosis, continued cannabis use leads to poorer clinical outcomes, contributing to a higher risk of relapse, persistent positive symptoms, poor treatment adherence, and treatment resistance (Patel et al., Reference Patel, Wilson, Jackson, Ball, Shetty, Broadbent, Stewart, McGuire and Bhattacharyya2016). These factors could increase risk for violence. In addition, socioeconomic and personality factors may also play a role. Cannabis users often differ from non-users in terms of social context, lifestyle, and personality characteristics. For instance, individuals with higher impulsivity and antisocial traits may be more likely both to use cannabis (particularly in settings where it is illegal) and to engage in delinquent or violent behavior. Given the higher rate of cannabis use among individuals with severe mental disorders compared to the general population, this group represents a particularly at-risk population in terms of violent behavior (“Marijuana Harmless?,” 2025).
The link we found between cannabis use and victimization, although weak, may reflect increased vulnerability rather than direct causality. Cannabis users may place themselves in risky situations. They may associate with peers who engage in substance use or criminal activities, thereby increasing their exposure to violent contexts. Thus, both behavioral disinhibition and social environment may have contributed to the increased risk of victimization.
The following limitations to our study must be considered. Firstly, the studies we reviewed employed a heterogeneity of definitions used for violence (e.g., physical, sexual, intimate/non-intimate), and varying methods of reporting cannabis use (e.g., self-reported measures, validated questionnaires, and biological samples). Secondly, the included studies also differed considerably in how cannabis exposure was defined and measured (e.g., lifetime or recent use), and most lacked a detailed assessment of exposure intensity, including frequency of use, dose, duration, and THC and cannabidiol (CBD) ratio. Consequently, subgroup or dose–response analyses based on cannabis exposure intensity or potency were not feasible. Thirdly, although we excluded studies in which the effects of cannabis could not be separated from polydrug use, participants classified as cannabis users may also have used other psychoactive substances, and most included studies did not comprehensively account for concomitant substance use. Residual confounding by alcohol or other drugs therefore cannot be excluded. Fourthly, a significant number of studies were cross-sectional and retrospective in nature, making it challenging to establish a definitive chronological relationship between cannabis use and violent behavior. However, sensitivity analysis based on study design indicated that when analyzing longitudinally collected data, there was still a significant effect of cannabis use on subsequent violence. This suggests that the association between cannabis use and violence is not due to recall bias or reverse causation. Nevertheless, the substantial statistical heterogeneity observed across studies suggests that the pooled estimates should be interpreted as average effects across diverse populations, study designs, and definitions of both cannabis use and violence. A substantial proportion of eligible studies could not contribute to the pooled estimates, most often because published data were insufficient for effect size calculation. This may introduce reporting bias if incomplete reporting is associated with the magnitude or direction of findings. Lastly, publication bias may have influenced the reported effect sizes. To address this limitation, we performed additional analyses using the trim-and-fill method, which imputes hypothetical “missing” studies to provide a corrected effect size. Further detailed analyses revealed that the impact of publication bias varied minimally across different study designs and sources of information, with all calculated corrected results remaining significant. Finally, our review was restricted to studies published in the English language, and therefore relevant evidence published in other languages may have been missed, introducing the potential for language bias.
The findings of our study underscore the importance of addressing this issue at both a societal and clinical level. From a public health perspective, violence should be considered alongside other established cannabis-related harms when developing prevention strategies, public education campaigns, and regulatory policies, particularly in jurisdictions where cannabis has been legalized or decriminalized. Our findings also suggest that violence should be considered within broader frameworks for assessing cannabis-related harm, as it represents a potential harm not only to the user but also to other individuals and society more broadly. At the clinical level, our findings highlight the necessity for mental health professionals to routinely assess cannabis use in individuals presenting with violent tendencies, particularly among those with severe mental illness, and to consider ongoing cannabis use as a potentially modifiable risk factor when undertaking violence risk assessment and management. This should include identifying patterns of cannabis use, discussing the potential impact of continued use on symptoms and violence risk, and supporting reduction or cessation of cannabis use as part of an integrated treatment plan. There remains a need to develop and evaluate population-specific interventions aimed at reducing cannabis use and determining whether such interventions also reduce the risk of violence.
To conclude, this meta-analysis reveals a significant association between cannabis use and increased risk of violence, especially criminal violence, in the general population and particularly among psychiatric patients. It is important to note that the majority of the studies we reviewed were carried out before the increased use of high-potency preparations of cannabis. Future research should prioritize prospective longitudinal studies with detailed characterization of cannabis exposure, including frequency, cumulative use and THC/CBD composition, to better disentangle causal pathways. Studies should also examine whether reducing cannabis use through clinical or public health interventions leads to reductions in violent behavior (Marconi et al., Reference Marconi, Di Forti, Lewis, Murray and Vassos2016).
Supplementary material
The supplementary material for this article can be found at http://doi.org/10.1017/S0033291726105856.
Acknowledgments
RM and EV thank the NIHR Maudsley Biomedical Research Centre at South London and Maudsley NHS Foundation Trust and King’s College London. MDF and GT thank the MRC. LA thanks the Foundation Adrian and Simone, and Carigest SA Foundation for their support. The views expressed are those of the authors and not necessarily those of the NIHR or the Department of Health and Social Care.
During the preparation of this work, the authors used ChatGPT 4.0 and Gemini in order to improve language and readability. After using this tool/service, the authors reviewed and edited the content as needed and take full responsibility for the content of the publication.
Author contributions
PM and GT performed search, screening, data extraction, and quality appraisal. Discrepancies were screened by EV. The extracted data was used for quantitative analyses, and VR was responsible for performing statistical analyses. GT, with the input of PM and VR, wrote the first draft of the manuscript. All authors provided input on the writing of the manuscript and interpretation of the data.
Funding statement
RM and EV are supported by the NIHR Maudsley Biomedical Research Centre at South London and Maudsley NHS Foundation Trust and King’s College London. GT, MDF and ZL were supported by the UK Medical Research Council (MRC) grant MR/T007818/1.
Competing interests
The authors declare none.


 Open access

