Background
Head and neck cancer accounts for approximately 5% of all cancers. 1 Squamous cell carcinoma represents the main histological type with 9,300 new cases and 2,820 deaths per year. Reference Siegel, Miller and Jemal2 As per population-based cancer registries in Egypt, HNC represents 2·3% of all malignancies. As per expectation, Egypt will report 2,147 (3·6%) new cases of HNC by the end of 2020· Reference Scarsbrook, Chuter and Prestwich3 The total number of patients referred to the centre of Clinical Oncology and Nuclear Medicine (NEMROCK) with HNC from the start of 2008 till the end of 2018 was about 2,435 patients, representing 3% of all patients referred to the centre during the same period (NEMROCK registration database).
Anatomic sites include nasopharynx, paranasal sinuses, oral cavity, oropharynx, hypopharynx and larynx. Reference Marur and Forastiere4
Proper treatment affects both overall survival (OAS) and progression-free survival (PFS) in patients with locally advanced HNC (5-year OAS: 51·0% versus 69·1%, p = 0·002; 5-year PFS: 42·7% versus 61·8%, p = 0·001). Reference Wuthrick, Zhang and Machtay5
Innovations in computer technology allowed us to combine fluoro-2-deoxy-D-glucose (FDG)-positron emission tomography (PET) and computed tomography (CT) ([fluorine 18] FDG-PET/CT), this achieved matching of anatomical details that reflect the biological morphological changes in early detection of disease. FDG-PET/CT is being increasingly used in HNC to avoid pitfalls during image interpretation. Reference Wong AG6 The most important prognostic factor in patients with head and neck squamous cell carcinoma (HNSCC) is lymph node involvement. Survival decreases by 40–50% in patients with positive nodes. Reference Edge and Compton7 Available evidence suggests that it is safe to spare neck dissection in patients with negative PET/CT findings. Reference Mehanna, Wong and McConkey8
In a large meta-analysis of 51 studies including 2,335 patients, the FDG-PET/CT sensitivity, specificity, positive predictive value and negative predictive value for the detection of residual primary HNSCC were reported to be 94, 82, 75 and 95%, respectively. Reference Sheikhbahaei, Taghipour and Ahmad9 False positive image post-radiation inflammation can be confirmed by tissue biopsy. Reference Demir, Okutan and Demir10
In a meta-analysis for HNC, PET/CT examinations 12 weeks or more after the completion of radiation therapy had a higher sensitivity than examinations performed earlier (4–8 weeks) (80% versus 73%, respectively). Reference Sheikhbahaei, Taghipour and Ahmad9
Zhang et al. analysed eight clinical trials dedicated to HNSCC and determined the values of standardised uptake volume (SUV) max and mean SUV as a prognostic marker. The authors concluded that increased SUV of the primary tumour is a poor prognostic factor. Reference Zhang, Li and Lu11 Similarly, another meta-analysis by Xie et al. proved that when SUVs of the primary tumour were low they were associated with better survival outcomes. Reference Xie, Li, Zhao, Sun, Fu and Yu12 The primary goal of this prospective study is to evaluate the role of PET/CT in restaging and response evaluation of locally advanced HNSCC, and proper staging with subsequent proper treatment decision whether radical or palliative if metastatic, which effects survival outcome, in addition to comparing delineation of PET/CT with CT.
Methods and Materials
This is a prospective phase II study conducted as a single institute centre to evaluate the role of PET/CT in radical radiotherapy practice and evaluation of treatment response of 30 patients included in this study with locally advanced HNSCC. Our cases did not undergo radical surgery for the primary tumour and were referred to our centre from March 2017 to December 2019. Confirmation of response was achieved by tissue biopsy.
Patient preparation
All patients underwent a pre-treatment evaluation (proper history, examination, dental assessment and labs).
Patient set-up
All patients were imaged in supine position with head fully extended and properly centralised using the external laser. Flat toped treatment table was used with patient immobilization.
Image acquisition protocol
After CT imaging, 18F-FDG-PET/CT scan was performed in the same patient position. A PET/CT scanner combining a modular, LYSO-based PET component with a 64-channel CT component was used. After 6-hours fasting 4·62 MBq/kg (0·125 mCi/kg), with a maximum of 555 MBq (15 mCi) 18F-FDG radiopharmaceutical was administrated intravenously. Blood glucose levels were checked.
Imaging of the head and neck region was carried out 60 minutes later. The PET scan was performed in three-dimensional (3D) modes. CT and PET fused images of each patient were transferred to the radiotherapy workstation [Eclipse TPS (version 11) via “DICOM” network-Varian Medical System, Palo Alto, CA, USA] for delineation. Reports were interpreted by a nuclear medicine specialist.
GTV contouring
GTV of the primary tumour and lymph nodes was manually delineated in each patient with the selection of both modalities performed on both the conventional CT-based topometric slides and the PET/CT registered images. GTV-PET was delineated over regions showing active FDG uptake.
Clinical target volume (CTV) contouring
Delineation was based on the published European Organization Research and Treatment of Cancer consensus guidelines. Reference Grégoire, Evans, Bourhis and Budach13
Planning target volume (PTV) contouring
PTV is generally done by 5mm expansion of all the CTVs. Limiting the margin to 1 mm around the CTV is allowed near the brainstem and spinal cord. A surface clipping margin of 3 mm was used for the PTV.
Planning for evaluation
A planning system (Eclipse) was used for evaluation. In each case, the GTV volume based on the performed 18F-FDG-PET/CT scan was compared to the GTV provided by the CT scan and their difference was described both in cm3 and in percentage.
Organs at risk (OAR)
Concerning OAR, the objectives are as follows.
Critical
Spinal cord: D1%< 46 Gy, max point dose 50 Gy. Brainstem: D1%<54 Gy, max point dose 60 Gy. Temporo-mandibular joint/mandible: max point dose 70 Gy. Optic nerves and Chiasma: D1%< 50Gy.
Non-critical
Parotids: V30 Gy< 45%, D mean < 26 Gy (in at least one gland). Cochlea: max 50 Gy.
Larynx: V40 Gy< 50% (except in laryngeal, hypopharyngeal and advanced oropharyngeal cancers involving the supra-glottis region). Oral cavity (not involved): D mean = 40 Gy; eyes: V40 Gy <50%;
Contouring plans for each patient were then transferred to the treatment planning system (Eclipse TPS-Varian, unique version 11).
Treatment planning and delivery
Patients were planned for inverse intensity modulated radiotherapy (IMRT) and volumetric modulated arc therapy techniques, using Eclipse TPS (version 11, from Varian Medical Systems). The majority of patients were treated with one iso-centre using 7–9 fields.
Dose and fractionation
Based on the early experience with IMRT and the consensus opinion used in and subsequently validated by the RTOG 0225 (Radiation Therapy Oncology Group), the prescribed dose to the PTV gross disease was 69·96 Gy in 2·12-Gy fractions, the dose to the PTV subclinical disease was 59·4 Gy in 1·8-Gy fractions and the dose to the PTV low-risk subclinical disease was 54·12 Gy in 1·64-Gy fractions. The prescribed doses were delivered in 33 once-a-day fractions, 5 days a week. Reference Nancy, Harris and Garden14
Follow-up
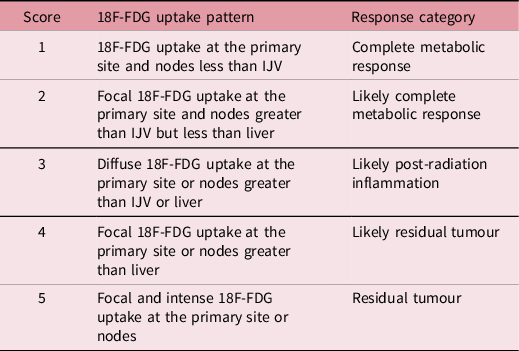
Follow-up by clinical examination was done monthly. Follow-up by PET/CT was done 12 weeks after definitive concurrent chemo-radiation. Endoscopic and ENT examination was done after 12 weeks. In case of positive FDG avidity on PET/CT, a biopsy was done for confirmation. The proposed Hopkins criteria have the merit of standardising FDG-PET/CT therapy response interpretation for HNSCC. Reference Marcus, Ciarallo and Tahari15 The Hopkins criteria define a qualitative five-point scale according to the intensity and pattern of FDG uptake (Table 1).
(Hopkins criteria) for head and neck PET/CT. The five-point qualitative post-therapy assessment scoring system.

Note: Score 1, 2 and 3 are considered negative for tumour. Scores 4 and 5 are considered positive for tumour. New lesions would be considered as progressive disease.
Abbreviation: IJV, internal jugular vein.
Statistical analysis
Continuous normally distributed data were exemplified using mean and standard deviation (SD). Alternatively, non-normal distributed data were explicated in the form of median and range and its confidential paired groups were compared using the Wilcoxon signed-rank test. Categorical variables were elucidated as numbers and percentages and were compared using chi-square test. Subgroup analysis was performed to reveal the impact of the tumour site on the tumour response and OAS rates. Survival analysis was done using Kaplan–Meier methods to calculate the OAS rates and disease-free survival rates, and the overall comparison was evaluated using the log-rank test. Cox proportional hazards regression model for survival analysis was implemented to detect the independent predictors of survival and to calculate the hazard ratio (HR) for specific variables.
Statistical analysis was performed using SPSS software version 23 for Windows (SPSS Inc., Chicago, IL, USA). The figures were renovated using Graph Pad Prism (Graph Pad Software, Inc, San Diego) software version 7. The significance was of p < 0·05.
Results
This is a prospective study including 30 cases with HNSCC referred to Kasr El Ainy-Cairo University Clinical Oncology Department, during the period from March 2017 to December 2018, to analyse the role of PET/CT starting as regards staging, treatment decision then proper contouring and volume definition. Moreover, consequently its effect on OAS and time to disease progression and lastly following up response after radical radiotherapy confirmed by tissue biopsy.
This study included an overall of 30 patients with a mean age of 49·4 ± 10·2 years. Males were predominant 22 (73·3%), while females were only 8 cases (26·7%). The nasopharyngeal tumours were the most predominant site 16/30 (53·3%), followed by laryngeal tumours 5/30 (16·7%), then hypopharyngeal tumours 4/30 (13·3%) and buccal mucosa 2/30 (6·7%) patients, ear 1/30 (3·3%) and base of tongue 1/30 (3·3%) patients.
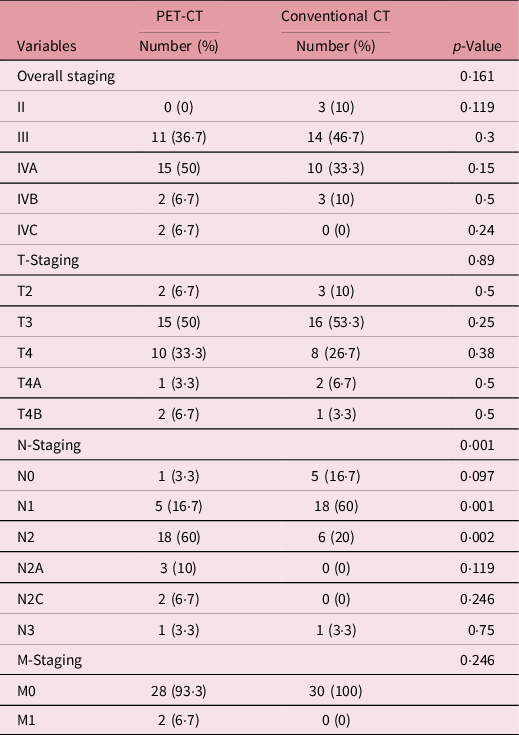
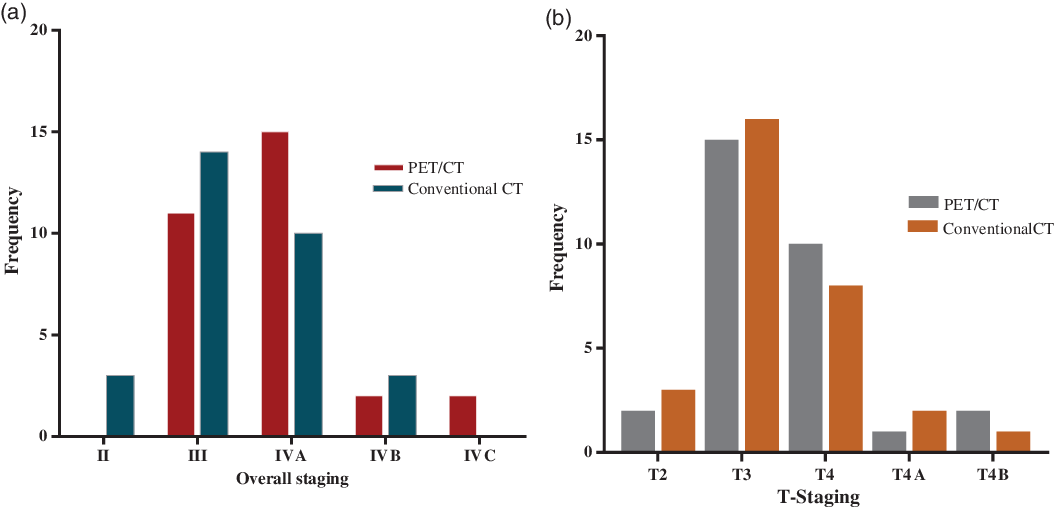
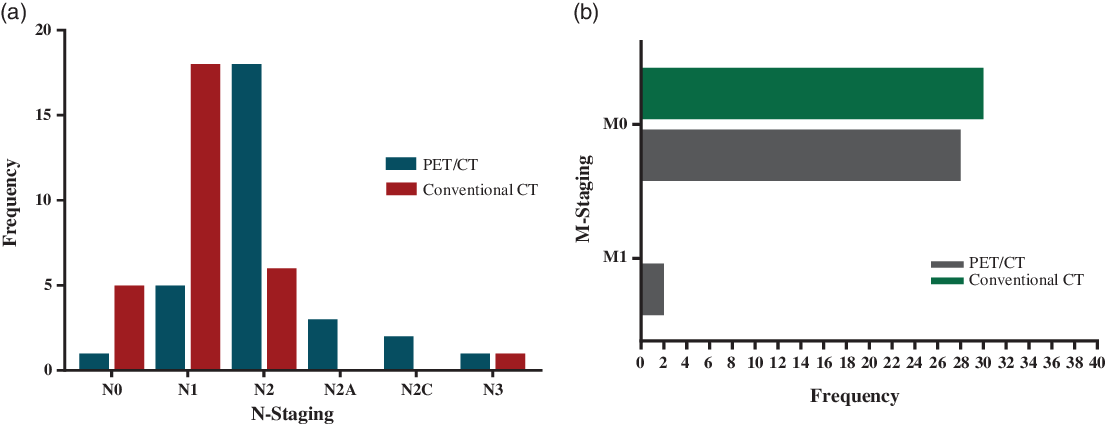
In our study, we compared the impact of PET/CT versus CT in TNM (Tumour stage, Nodal status, Metastatic status) staging and delineation of GTV, CTV of primary target and lymph node drainage groups. The total TNM staging changed in 12 (40%) of 30 patients, upstaged in 11 (36·7%) patients and downstaged in 1 (3·3%) patient and remained the same in the remaining 18 (60%) patients. This significantly changed the treatment plan (Table 2; Figures 1 and 2 ).
HNSCC staging based on PET-CT and conventional CT.

Abbreviations: HNSCC, head and neck squamous cell carcinoma; T, tumour; N, lymph nodes; M, metastasis.
(a) Bar chart displayed the differences of overall staging between PET/CT and conventional CT (p = 0·161). (b). Bar chart illustrated the variation of the tumour (T) staging between PET/CT and conventional CT (p = 0·89).

(a) Bar chart depicted the difference of lymph node (N) staging between PET/CT and conventional CT (p = 0·001). (b) Bar chart illustrated the difference in metastasis (M) staging between PET/CT and conventional CT (p = 0·246).

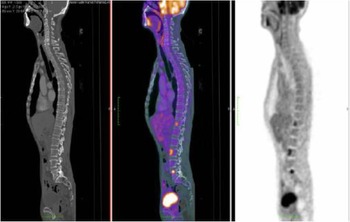
However, PET/CT study detected bone metastases in two2 nasopharyngeal carcinoma patients (6·7%), which was not detected using conventional CT. Accordingly, the treatment strategy was modified from curative to palliative therapy (Figure 3 ).
Transaxial PET/CT image with SUV 12. These findings led to upstaging of disease to clinical stage T3N1M1.

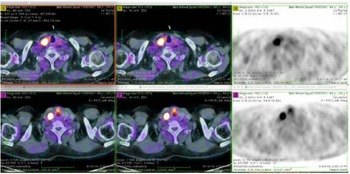
In the current study, PET/CT also detected 2 (6·7%) cases with a second primary tumour, one of them with focal activity in the sigmoid colon in a case of nasopharyngeal carcinoma where a colonoscopy biopsy was taken and revealed adenocarcinoma and the other case with a thyroid nodule proved to be papillary carcinoma (Figure 4).
FDG-PET/CT was performed for initial staging in a 68-year-old man who presented with a laryngeal mass conventional CT staged the case as T3N0M0 where PET/CT staged as T3N1M0 with a SUV of the primary lesion of 11·2 and LN SUV of 4 and in addition revealed a right thyroid nodule with a SUV of 24.

Relative to conventional CT, PET/CT achieved specificity and a sensitivity of 68·75% and 42·8%, respectively, in the detection of patients with stage III HNSCC. Additionally, PET/CT attained a sensitivity of 72·7% and a specificity of 57·8% in the diagnosis of patients with stage IVA HNSCC. Regarding stage IVB, PET/CT achieved a sensitivity and a specificity of 33·3% and 96·2%, respectively.
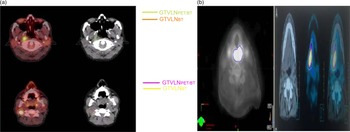
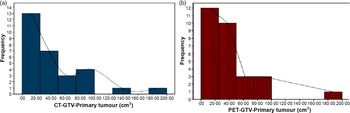
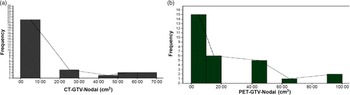
In radiotherapy, it is crucial to precisely contour target organs and critical organs. The GTV of the initial tumour differed statistically (p-value = 0·023) between PET/CT and conventional CT; the median GTV of the tumour was 27 cm3 (2·01–178·21) and 32·05 cm3 (2·87–193·30) for PET/CT and conventional CT, respectively. The mean, PET/CT-GTV of the primary tumour was smaller in 23/30 (76·7%) patients and larger in 5/30 (16·7) patients than CT-GTV with statistical significance (p-value = 0·023). On the other hand, PET/CT altered the median GTV of the lymph nodes which was significantly high (p-value < 0·0001), 9·8 cm3 (0–92·67), when compared with conventional CT, 7·82 cm3 (0–63·66), with a median difference of 2·77 cm3 (3·91–34·94). This means that the GTV of lymph nodes determined by PET/CT was larger in 20/30 (67·7%) cases (more than half of patients was smaller in 4/30 (13·33%) cases and unchanged in 6/30 (20%) cases, with statistical significance) (p-value < 0·0001) (Figures 5, 6 and 7).
(a) Radiotherapy planning volumes described by planning CT and PET/CT. (b, c) CT, FDG-PET and fused F-FDG-PET/CT images of patient with hypopharynx squamous cell carcinoma. GTV delineated on CT was larger than that of PET/CT. Abbreviations: GTV, gross tumour volume; GTVLN, involved loco-regional lymph node volume; CT, computed tomography; PET/CT, positron emission tomography/computed tomography.
Second case patient with carcinoma of base of tongue GTVs obtained by CT.

(a) Histogram illustrated the frequency of the GTV of the tumour based on conventional CT in 30 patients with HNSCC. (b) Histogram illustrated the frequency of the GTV of the tumour based on PET CT in 30 patients with HNSCC.

(a) Histogram illustrated the frequency of the GTV of the lymph nodes based on conventional CT in patients with HNSCC. (b). Histogram illustrated the frequency of the GTV of the lymph nodes based on PET CT in patients with HNSCC.

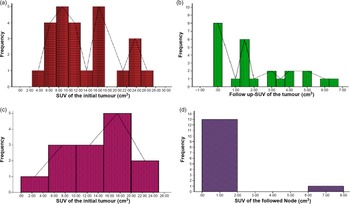
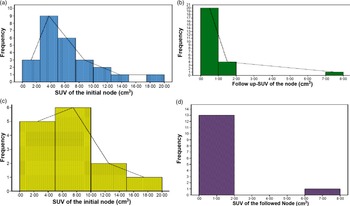
The median SUV of the tumour varied dramatically (p-value < 0·0001) with the initial SUV = 11·9 (3·10–25) and 1·5 (0–6·5) at 3 months follow-up (Figures 8a and 8b). Consequently, the median initial SUV of the lymph nodes was 5 (0–18·8), while it was 0 (0–7·5) 3 months later (p-value < 0·0001). Additionally, for patients with a FDG avid PET/CT at 3 months, the tissue biopsy revealed no recurrence of the initial tumour (Figures 9a and 9b).
(a) Histogram delineated the SUV measurements of initial tumours among patients with HNSCC. (b) Histogram delineated the SUV measurements of tumours after 3 months follow-up among patients with HNSCC. (c) Histogram delineated the SUV pattern of initial tumours among patients with nasopharyngeal HNSCC. (d) Histogram delineated the SUV pattern of tumours after treatment among patients with nasopharyngeal HNSCC.

(a) Histogram delineated the SUV pattern of initial lymph nodes in patients with HNSCC. (b) Histogram delineated the SUV measurements of lymph nodes after 3 months follow-up among patients with HNSCC. (c) Histogram delineated the SUV pattern of initial lymph nodes among patients with nasopharyngeal HNSCC. (d) Histogram delineated the SUV measurements of lymph nodes after 3 months follow-up among patients with nasopharyngeal HNSCC.

For patients with nasopharyngeal tumours, 14 patients were subordinated to PET/CT 3 months after treatment. Scans revealed a statistically highly significant difference between the SUV of the initial tumour and the post-therapy tumour (p-value = 0·001). To clarify, the median SUV of the initial and post-therapy tumour was 13·9 (3·1–23) and 0·65(0–18·8), respectively (Figures 8c and 8d). Moreover, the median SUV of the lymph nodes was 0 (range 0–7·5) and differed considerably (p-value = 0·001) when compared with the SUV of the initial node 5·5 (range 0–18·8) (Figures 9c and 9d).
Three months after treatment of the included participants, 25/30 patients were assessed by post-management PET/CT to evaluate the tumour response, and the rest of the patients had financial difficulties. PET/CT displayed a complete response in 21/25 (84%) patients and FDG avidity in 4/25 (16%) patients. Those patients were biopsied and reported a residual squamous cell carcinoma in only one patient out of four patients. Additionally, after approximately 16 months, another patient out of those four patients experienced local tumour recurrence which was confirmed by biopsy. So, there were only two patients who experienced local recurrence.
The Kaplan–Meier estimated that the OAS rate was 75·9%, and the mean OAS was 20·5 months (95% CI: 17·01–24·08) (Figure 10). No statistically significant difference was observed between patients with nasopharyngeal tumours and patients with other tumour sites (log-rank test, p-value = 0·169); the OAS rate of patients with nasopharyngeal tumours was relatively higher (86·7% versus 64·3%), 22·91 months (95% CI: 18·89–26·94), compared to other sites, 17 months (95% CI: 11·84–22·19) (Figure 11).
Kaplan–Meier curve expresses a disease-free survival rate of (88%) in patients with HNSCC.

Kaplan–Meier curves compared the overall survival rate between the nasopharyngeal and other tumours in patients with HNSCC.

Among 25 candidates out of 30 patients, the disease-free survival rate was 88% and the mean survival was 24·16 months (95% CI: 21·8–26·4).
Cox-regression model showed that the SUV of the initial tumour had been a dependent predictor of death in patients with HNSCC (p-value = 0·033) where the risk of death was 0·725 times among patients with high SUV of the initial tumour. Consequently, GTV of the tumour attained significant ability in the prediction of death (p = 0·018). To clarify, patients with higher tumour GTV were at high risk of death with HR of 1·043 times when compared with patients with lower GTV (Table 3).
Results of multivariate Cox regression model to retrieve the dependent predictors of survival in patients with HNSCC.

Abbreviations: GTV, gross tumour volume; CI, confidence interval; SUV, standardised uptake volume; HNSCC, head and neck squamous cell carcinoma.
Discussion
PET/CT has become an important tool for diagnosis, staging, radiotherapy planning and post-therapy follow-up for those patients. Reference Wong AG6
In our study, the total TNM staging changed in 12 of 30 patients (40%), upstaged in 11 (36·7%) patients and downstaged in 1 (3·3%) patient and remained the same in the remaining 18 (60%) patients, which was comparable to El-Khodary et al. study that enrolled 36 HNCs patients and found that PET/CT fusion changed the TNM staging in 23 (51·1%) patients, upstaged in 19 (42·2%) and downstaged in 4 (8·8%) patients. Reference El-Khodary, Tabashy, Omar, Mousa and Mostafa16 However, when compared with conventional CT, no statistically significant difference was observed in the overall staging (p = 0·161) in our study. In a similar study by Abramyuk et al., the authors found that FDG/PET caused T downstaging in 36/102 (35·3%) patients and upstaging in 10/102 (9·8%) patients. Reference Abramyuk, Appold, Zöphel, Baumann and Abolmaali17 This study showed a higher downstaging and similar upstaging compared to our current study, where PET/CT changed the T stage which was upstaged in 6/30 (20%) patients, downstaged in 2/30 (6·7%) patients and remained the same in the remaining 22 patients.
The most important prognostic factor in patients with HNSCCs is Lymph node involvement, the survival decreases by 40–50% in patients with positive nodes. Reference Edge and Compton7 El Khodary et al. found that PET/CT changed N staging in 15/45 patients (33·3%), upstaged in 12 (26·6%) and downstaged in 3 (6·6%) patients. Reference El-Khodary, Tabashy, Omar, Mousa and Mostafa16 Another study by Dietl et al. for initial staging for HNC in 35 patients revealed almost the same results provided by EL-Khodary et al. study. Reference Dietl, Marienhagen and Kuhnel18 In our study, PET/CT upstaged the N stages of 20 (66·7%) cases and downstaged only 1 (3·3%) patient; the N upstaging is relatively more than that of EL-Khodary et al. and Dietl et al. and this may be due to the higher number of locally advanced cases in our study.
The overall incidence of distant metastases in HNSCC is relatively low (2–18%), as stated by Kmju who conducted a meta-analysis and reported that 209 of 1445 (14·4%) HNSCC patients had distant metastases detected with PET/CT. Reference Xu, Guan and He19 In our study, PET/CT detected distant metastasis in 2 (6·7%) patients (bone deposits) in two nasopharyngeal carcinomas, which were not detected using conventional CT, which is comparable to the study by El Khodary et al. which found that FDG–PET/CT detected distant metastases in 5/45 patients (11·1%), Reference El-Khodary, Tabashy, Omar, Mousa and Mostafa16 and Dietl et al. study, who confirmed that PET/CT could detect metastases in 6/35 (17·1%) patients. Reference Dietl, Marienhagen and Kuhnel18 Accordingly, the treatment strategy was modified from curative to palliative therapy. PET/CT has proven useful for detection of second primary tumours in HNCs. Reference El-Khodary, Tabashy, Omar, Mousa and Mostafa16 In the current study, PET/CT detected 2 (6·7%) cases with secondary primary tumours, one of them showed focal activity in the sigmoid colon in a case of nasopharyngeal carcinoma which was pathologically proven and the other case with a thyroid nodule proved to be papillary carcinoma. Because of the diagnosis of a second primary, the two patients received additional curative therapy. So our study was comparable to El-Khodary et al., who detected second primary tumours in 3 (6·6%) cases. Reference El-Khodary, Tabashy, Omar, Mousa and Mostafa16 In comparison to our study, Dietl et al. detected by PET/CT 4 (11·4%) cases out of the 35 patients to have second primaries, which was relatively higher than our findings. Reference Dietl, Marienhagen and Kuhnel18
A literature survey on the use of PET/CT in HNC indicates that PET has a higher specificity (89%) and sensitivity (87%) for cancer staging. Reference Schmid, Stoeckli and Bandhauer20 Zimny et al. described the sensitivity and specificity of PET/CT in tumour detection as 77 and 82%, respectively. Reference Zimny, Wildberger and Cremerius21 Similarly, in our study PET/CT demonstrates a specificity ranging from 58% to 96% and a sensitivity ranging from 33% to 73%.
In radiotherapy, it is crucial to precisely contour target organs and critical organs. Reference Sonay, Abakay and Sen22 In our study, we reported statistically significant differences in gross target volume as assessed by 18F-FDG-PET/CT and CT in patients with HNC undergoing radiation therapy planning. PET/CT-GTV of the primary tumour was smaller in 23/30 (76·7%) patients and larger in 5/30 (16·7) patients than CT-GTV with statistically significant differences found between CT and PET/CT-based GTV (p-value = 0·023). These results were similar to those reported by Besenyi et al. who discovered that GTV was smaller in 58 cases (82%) and larger in 12 cases (18%) with a statistically significant difference between the two. Reference Besenyi, Hideghety and Lengyel23 Similarly, Sonay found that GTV PET/CT was smaller than GTV-CT in 34 (92%) of 37 cases, while GTV-CT was smaller than GTV PET/CT in 3 cases. Reference Sonay, Abakay and Sen22
In our study 3 months after treatment, PET/CT displayed a complete response in 21/25 (84%) patients and FDG avidity in 4/25 (16%) patients. A residual squamous cell carcinoma was found in only one patient out of four patients and was confirmed by biopsy. Additionally, another patient out of those four patients experienced local tumour recurrence which was also biopsy proven, after approximately 16 months from ending treatment. Moreover, Yao and colleagues found that (a total of 41 patients underwent a follow-up PET scan 3–4 months after radiotherapy) all patients with a negative FDG-PET after radiotherapy or those with a maximum SUV of < 3 were found to be free of residual tumour confirming our study results. Reference Yao, Graham and Hoffman24
A maximum SUV value of 3 as the criterion for a negative FDG-PET scan. Another study by Zheng et al. found that 4 of 33 patients had histologic persistence at 1–6 weeks after radiotherapy with a negative FDG-PET/CT and consequently salvage treatment was not offered. All four patients had repeat biopsies, which were negative at a later time, and none developed a loco-regional recurrence. Reference Zheng, Chen and Wang25 Distant metastases developed in one patient (3·3%) in our study and it was 3 months after ending treatment, which was comparable to Chan’s et al. study that recorded distant metastases in 3/111 (2·7%) patients with nasopharyngeal carcinoma on follow-up after 6–8 months from the initial staging. Reference Chan, Yen and Chang26
In our study, the overall survival rate of patients with nasopharyngeal tumour was relatively high (86·7% versus 64·3%) compared to other sites. These is compatible with the studies by Dimiri et al. who studied 88 patients with locally advanced HNSCC treated with CCRT and recorded of median and 5-years disease-free survival were 26 months and 39·4% respectively, while the median and OAS were 27 months and 41·8% respectively. Reference Dimri, Pandey, Trehan, Rai and Kumar27
To conclude we found that the mean survival time of patients with nasopharyngeal tumours was considerably higher, 22·91 months compared to other sites, 17·019 months, and the overall disease-free survival rate was superior 88% with a mean survival of 24·16 months.
The main limitations for PET/CT usage, especially in the post-treatment setting, are possible false positive results due to inflammation and the inability to detect microscopic disease. In the future, new tracers other than 18FDG, as well as PET-MRI imaging, will provide clear advantages in several clinical scenarios.
Conclusion
The authors of this study can assert that PET/CT has superior accuracy over clinical examination and conventional anatomic imaging (CT) in addition to proper staging, radiotherapy delineation and follow-up in patients with locally advanced HNC. Also, radiotherapy delineation in HNC by 18-FDG-PET/CT can provide the accurate volume to be irradiated to high dose levels while facilitating the sparing of normal structures and the escalation of dose.
Recommendations
PET/CT is mandatory in the staging and delineation of HNC as not to over-irradiate or under-irradiate, while sparing risk structures. Close follow-up and biopsy to high risk patients are recommended due to relatively high false positive rate and post-radiation inflammation. If in doubt PET-MRI may be recommended.
Acknowledgements
We deeply acknowledge the Head of Department Prof Dr. Emad Hamada, and our Professors’ Dr Ehsan Elghoneimy, Dr Mohamed Abdulla, for the facilities they did to complete this study, in addition to physicists who helped us in planning and calculation.
Disclosure of Potential Conflicts of Interest
The authors declare that they have no conflict of interest and no known competing financial interest or personal relationships that could have appeared to influence the work reported in this manuscript.
Research Involving Human Participants and/or Animals
This study has been approved by the ethics committee and has been performed in accordance with the ethical standards of the 1964 Declaration of Helsinki and its later amendments.
Informed Consent
All patients signed an informed consent form to participate in the study.
Consent
This study was conducted after acceptance of the ethical committee.