




1. Introduction
A large assembly of randomly amassed solid particles, commonly termed granular particles, is ubiquitous in both industry and nature. Granular particles discharging through silos or hoppers exhibit interesting phenomena such as spatio-temporal heterogeneities (Mehta Reference Mehta2010), jamming (Zuriguel et al. Reference Zuriguel, Garcimartín, Maza, Pugnaloni and Pastor2005), funnel flow (Kozicki & Tejchman Reference Kozicki and Tejchman2005), etc. This, along with its applications in industry, has garnered interest among researchers to explore the characteristics of dense granular media flowing out of a silo. Some works (Pournin et al. Reference Pournin, Ramaioli, Folly and Liebling2007; Hidalgo et al. Reference Hidalgo, Lozano, Zuriguel and Garcimartín2013; López-Rodríguez et al. Reference López-Rodríguez, Gella, Kiwing, Maza, Garcimartín and Zuriguel2019) have been dedicated to comprehending the dynamic behaviour of spherical particles in silos or hoppers. However, solid particles involved in either industry or nature are often non-spherical. The non-spherical shape of the flowing particles introduces more complexity into the system, thus yielding in yet new phenomena such as ratholing (Ashour et al. Reference Ashour, Wegner, Trittel, Börzsönyi and Stannarius2017) or local jamming, because of strong interlocking among the particles. In non-spherical particulate flow, the shear-induced orientation of the particles at different depths also plays a crucial role in flow dynamics. Börzsönyi et al. (Reference Börzsönyi, Somfai, Szabó, Wegner, Mier, Rose and Stannarius2016) noticed that the longer axis of elongated particles or rods were not oriented parallel to the streamlines but enclosed small angles during silo flow. In practice, the solid materials are often heterogeneous mixtures due to imperfect processing while grinding or milling. So, a basic understanding of the flow dynamics of heterogeneous mixtures of particles, which vary in shape and size, is of great importance. Binary mixtures of spherical and non-spherical particles flowing out of a silo is a special case.
Adding spherical particles to a system of non-spherical particles or vice versa, shows a wide variety of phenomena such as lubricating effects, stratification and segregation. Wambaugh, Reichhardt & Olson (Reference Wambaugh, Reichhardt and Olson2002) has observed lubrication effects by adding monomers to a collection of trimers (gluing three spherical particles side by side in a single line). Here, monomers or spherical particles acted as a lubricant, thus increasing the velocity of trimers on a vibrating ratchet-shaped base. The critical angle of repose of a sandpile consisting of spherical monomer grains was found (Ertaş et al. Reference Ertaş, Halsey, Levine and Mason2002) to increase with the addition of dimers (two spherical particles fused adjacent to each other). However, Guo et al. (Reference Guo, Chen, Xu and Liu2015) has observed the ‘needle particle effect’, where the addition of elongated particles has enhanced the flow of fine granules. They argued that elongated particles played a major role in reducing cohesion and adhesion among fine granules, thus improving the flow conditions. A comprehensive understanding of the flow of mixtures helps in predicting flow rates which aid in effective handling of operations in industry.
One of the most widely accepted laws that predicts the flow rate of grains discharging through a silo, proposed by Beverloo, Leniger & van de Velde (Reference Beverloo, Leniger and van de Velde1961), is  $Q=C\rho _b\sqrt {g} (W-kD)^{n-{1}/{2}}$. Here
 $Q, W, D$ are mass flow rate, orifice width and particle diameter,
 $\rho _b$ is bulk density and
 $C, k$ are empirical discharge and shape coefficients and
 $n=2,3$ corresponds to the two-dimensional or three-dimensional system. The major limitation of this model is that it is only valid for
 $W\gg D$, and it fails to predict flow rates for small orifice widths where clogging is evidenced. To bridge this gap, Mankoc et al. (Reference Mankoc, Janda, Arévalo, Pastor, Zuriguel, Garcimartín and Maza2007) has proposed a modified expression for the number of beads discharged per unit time, which is valid for orifice widths ranging from
 $2 < W/D < 100$ as
 \begin{equation} Q_b=C'\left(1-\frac{1}{2}\textrm{e}^{-b({W}/{D}-1)}\right)\left(\frac{W}{D}-1\right)^{n-{1}/{2}}. \end{equation}
Here,  $C,\rho _b,\sqrt {g}$ of Beverloo's expression are clubbed together into a single term
 $C'$, and
 $k$ is set to one, which is obtained from the fit. Further, they reported that the introduced correction factor (exponential term) most possibly corresponds to the variation in grain density in the region above the orifice. The above-mentioned models apply to monodisperse particles. In reality, granular systems are hardly monodisperse. In this light, modified Beverloo expressions were proposed for different binary mixtures. For instance, Artega & Tüzün (Reference Artega and Tüzün1990) has proposed a model for the flow rate of binary mixtures of equal density granules in cylindrical and conical hoppers. Whereas, for binary mixtures of fine particles flowing through a sieve, Chevoir, Gaulard & Roussel (Reference Chevoir, Gaulard and Roussel2007) has proposed an alternative model. Recently, Benyamine et al. (Reference Benyamine, Djermane, Dalloz-Dubrujeaud and Aussillous2014) empirically generated a flow rate expression for the binary mixture of glass beads.
Researchers (Medina et al. Reference Medina, Cabrera, López-Villa and Pliego2014; Serrano et al. Reference Serrano, Medina, Chavarria, Pliego and Klapp2015) have proposed analytical expressions for flow rate which mostly apply to the large orifice width to particle size ratios  $W/d\gg 1$. In industry, often regulated flow of solid particles is essential during processing or packing. In regulated flows involving narrow outlets, particle flow might encounter a hindrance or it might abruptly stop because of the blockage at the orifice. This phenomenon is commonly termed as clogging. In the flow of monolayered spherical particles, it has been noticed that clogging might occur at the orifice of the silo or in the bulk (Arévalo, Maza & Pugnaloni Reference Arévalo, Maza and Pugnaloni2006; Harada, Mitsui & Sato Reference Harada, Mitsui and Sato2012; Cao et al. Reference Cao, Chakrabortty, Barker, Mehta and Wang2013). The latter type of clogging slightly hinders the flow, whereas the former one yields in complete stoppage of the flow. This issue of clogging at bottlenecks has been addressed in different ways such as understanding the arch geometry (To & Lai Reference To and Lai2002), the stability of arches when subjected to external force (Lozano, Zuriguel & Garcimartín Reference Lozano, Zuriguel and Garcimartín2015), or placing an obstacle just above the orifice (Zuriguel et al. Reference Zuriguel, Janda, Garcimartín, Lozano, Arévalo and Maza2011; Lozano et al. Reference Lozano, Janda, Garcimartín, Maza and Zuriguel2012a) to alleviate clogging.
The clogged structures of mutually stabilised particles formed above the orifice were found to be close to a semicircle or dome shape in two-dimensional and three-dimensional silos. To & Lai (Reference To and Lai2002) proposed that arches are convex everywhere by showing the angle  $\varPhi$ made by any arch particle with its two adjacent arch particles is less than
 $180^{\circ }$ for the case of monolayered spherical particles in a silo. However, Garcimartín et al. (Reference Garcimartín, Zuriguel, Pugnaloni and Janda2010) proved the existence of local concavities in arches, namely defects (
 $\varPhi > 180^{\circ }$), although they observed the ratio of height and half-width of the arch as close to one. Defects were found to be the weakest portions of an arch. Lozano et al. (Reference Lozano, Lumay, Zuriguel, Hidalgo and Garcimartín2012b) observed that the resistance of the arch to vibrations of the silo is determined by
 $\varPhi _{max}$. The geometry of the arch gets more complex for the case of non-spherical particles (Ashour et al. Reference Ashour, Wegner, Trittel, Börzsönyi and Stannarius2017; Börzsönyi et al. Reference Börzsönyi, Somfai, Szabó, Wegner, Ashour and Stannarius2017) such as elongated particles or dumbbells. In the existing literature, the clogged arches are studied mostly for a system of spherical particles or a system of elongated particles. However, to the best of our knowledge, there is hardly any work which deals with the geometry of arches in the case of heterogeneous mixtures.
The flow of heterogeneous mixtures through silos has been a topic of interest due to its wide variety of applications in industry. Binary mixtures are a special case comprising only two types of particle which differ in either their shape or size. Experimental (Benyamine et al. Reference Benyamine, Djermane, Dalloz-Dubrujeaud and Aussillous2014) and simulation (Zhou, Ruyer & Aussillous Reference Zhou, Ruyer and Aussillous2015) works were carried out for analysing bidisperse mixtures of spherical particles varying in size. However, the dense solid mixtures in practice often consist of particles varying in shape. In the present work, we have analysed how the presence of dumbbell-shaped particles affects the flow of a mixture of disc and dumbbell particles in two-dimensional silos using numerical simulations. We have studied flow characteristics by varying the orifice width  $W$ and the fraction of dumbbells
 $X_{db}$ in the mixture. Two regimes were analysed namely, the free flow regime and the interrupted flow regime. Firstly, in the free-flow regime, flow is characterised by using various parameters such as flow rate, area fraction, granular temperature. We plotted mean flow fields for various parameters to analyse the region above the orifice. In the interrupted flow regime, unlike the free flow one, the orifice might get blocked after some time because of the formation of mesoscopic structures of mutually stabilising particles. In this case, we focussed on the morphology of arches for different particle mixtures. Moreover, we determined the deviation of the arch shape from a semicircle with the addition of dumbbells. The paper is organised as follows. Simulation methodology is explained in § 2. The results obtained from numerical simulations for the free-flow regime are explained in § 3.1 and those of interrupted flow regime in § 3.2. In § 4, concluding remarks of the work are reported.
2. Simulation methodology
We employed the discrete element method (known as DEM) (Cundall & Strack Reference Cundall and Strack1979) to study the dynamics of granular mixtures of dumbbells and discs in a two-dimensional silo. Figure 1 shows the schematic representation of our system. dumbbells are rigid particles created by fusing two circles, each of diameter  $d$, adjacent to each other. The diameter of the disc is
 $D=\sqrt {2}d$, which is computed by considering the area of dumbbell same as that of the disc. The total number of particles is
 $N=15\,000$ for all fractions of dumbbells
 $X_{db}$. The origin is located at the centre of the silo base, which is also the centre of the orifice. Firstly, dumbbells and discs are placed at arbitrary positions with random orientations in a silo confined by walls at
 $x={\pm }50d$ and
 $y=0$ while ensuring that there are no overlaps among them. Then, a gravity of magnitude
 $g$ is applied in the negative-
 $y$ direction. Once the particles get settled, the height of the assembly of particles reaches close to
 $290\pm 10d$, which slightly depends on
 $X_{db}$. At time
 $t=0$, the orifice of width
 $W$ on the silo base is opened to let the particles discharge out of the silo. Periodic boundary conditions are applied in
 $y$-direction and the particles discharged out of the silo are placed at random positions with reduced velocities above the granular bed. In the discrete element method technique, positions and velocities of particles are updated after every time step
 $t_s$ by integrating equations of motion using the velocity Verlet algorithm. The contact force and gravity on the particles are the only forces taken into account. The normal and tangential components of contact force
 $F^n_{ij}$,
 $F^t_{ij}$, respectively, between particles
 $i$ and
 $j$ of radii
 $R_i$,
 $R_j$ are computed using the contact force model (Brilliantov et al. Reference Brilliantov, Spahn, Hertzsch and Pöschel1996) as follows:
 \begin{gather} \boldsymbol{F}^n_{ij} = \sqrt{R_{eff}\delta_{ij}} (K_n\delta_{ij}\boldsymbol{\hat{r}_{ij}}-m_{eff}\gamma_n\boldsymbol{v}^n_{ij}), \end{gather}
 \begin{gather} \boldsymbol{F}^t_{ij} = -\min( \mu F^n_{ij} , \sqrt{R_{eff}\delta_{ij}}(K_t\boldsymbol{\Delta s_{ij}}+m_{eff}\gamma_t\boldsymbol{v}^t_{ij})). \end{gather}
Here,  $R_{eff} = ({R_i R_j})/({R_i+R_j})$ and
 $m_{eff} = ({m_i m_j})/({m_i+m_j})$ are the effective radius and the effective mass of the particles
 $i$ and
 $j$ in contact. Two particles
 $i$ and
 $j$ are said to be in contact if overlap,
 $\delta _{ij}$ =
 $R_i+R_j-|\boldsymbol {R_{ij}}|$, is greater than or equal to zero. Here
 $K$ and
 $\gamma$ are the elastic constant and damping coefficient, ‘
 $n$’ and ‘
 $t$’ as subscripts or superscripts correspond to normal and tangential components of respective parameters. Here
 $\boldsymbol {v_{ij}}$ is relative velocity and
 $\boldsymbol {\hat {r}_{ij}}$ is a unit vector in the direction of the line joining centres of particles
 $i$ and
 $j$. The tangential displacement vector is denoted by
 $\boldsymbol {\Delta s_{ij}}$, the coefficient of friction
 $\mu$ is taken as 0.5 and the time step
 $t_s$ is set to
 $10^{-4} \sqrt {d/g}$. The values of
 $K_n$ and
 $K_t$ are
 $2.0\times 10^6 \rho dg$ and
 $2.45\times 10^6 \rho dg$, and those of
 $\gamma _n$ and
 $\gamma _t$ are
 $1000\sqrt {g/d^3}$. The position and velocity of a dumbbell is the centre of mass position and centre of mass velocity computed from the two discs of the same dumbbell. The force acting on each dumbbell is calculated by adding the total force acting on two discs of the dumbbell and assigning it to the centre of mass position of the dumbbell. The torque on each dumbbell is calculated in the same way as that of the force. Note that forces or torques experienced by a disc due to another disc which is part of the same dumbbell are set to zero. All of our simulations are performed in LAMMPS (Plimpton Reference Plimpton1995) and the visualisation is done using OVITO (Stukowski Reference Stukowski2009).
Schematic diagram representing a mixture of dumbbells (red circles) and discs (blue circles) in a two-dimensional silo. Here,  $d$ is the diameter of each circle of a dumbbell. Few parameters in our work are computed in the region
 $A$, whose width is
 $W+2\sqrt {2}d$ and height is
 $5\sqrt {2}d$, where
 $W$ is the orifice width. The origin is located at the centre of the orifice, which is equidistant from both the sidewalls.

3. Results and discussion
In this section, we will present numerical simulation results for our system of dumbbells and discs. Flow dynamics of mixtures which varied in the fraction of dumbbells  $X_{db}$ are analysed at different orifice widths
 $W$. The results pertaining to the free-flow regime (
 $W/d\ge 15$) are explained in § 3.1. Time-averaged flow fields of various parameters in the absence of an obstacle are demonstrated in § 3.1.1 and the flow fields in the presence of an obstacle are illustrated in § 3.1.2. In § 3.2, results corresponding to the interrupted flow regime (
 $W/d\le 10$) are elucidated, and in the next subsection the morphology of arches is discussed.
We examine the flow characteristics at different orifice widths  $W$ using various parameters such as flow rate
 $Q$, area fraction
 $\phi$ and granular temperature
 $T_g$. Flow rate
 $Q$ is the average number of particles discharged per unit time during the free flow of particles, or before the system gets clogged. Area fraction
 $\phi$ and granular temperature
 $T_g$ are computed in the region
 $A$ as shown in figure 1 which lies just above the orifice and whose length is
 $W+2\sqrt {2}d$ in the
 $x$ direction and
 $5\sqrt {2}d$ in the
 $y$ direction, respectively. Area fraction
 $\phi$ is calculated as the ratio of area occupied by all the particles in the region
 $A$ and the area of region
 $A$. Granular temperature is a measure of fluctuations in translation and rotation velocities (Kumar, Dhiman & Reddy Reference Kumar, Dhiman and Reddy2019; Reddy, Talbot & Kumaran Reference Reddy, Talbot and Kumaran2010) and is computed as
 $T_g = ({1}/{3})\langle m\{(v_x-\langle v_x\rangle )^2 + (v_y-\langle v_y\rangle )^2\} + I (\varOmega _z - \langle \varOmega _z\rangle )^2 \rangle$. Here,
 $v_x , v_y$ are the instantaneous velocities in the
 $x$,
 $y$ directions and
 $\varOmega _z$ is the instantaneous angular velocity in the
 $z$ direction. Moreover,
 $\langle \cdot \rangle$ denotes the spatio-temporal average over the region
 $A$ and from time
 $t=0$ to
 $t=T$. The mass and moment of inertia of the particles are indicated by
 $m$ and
 $I$.
3.1. The flow of a mixture of discs and dumbbells in the free-flow regime
In this subsection, we will elucidate the numerical results for large orifice widths  $W/d\ge 15$ where free-flow regime is observed. We analyse the flow characteristics at six different orifice widths
 $W/d$ ranging from 15 to 40. To examine how the total number of dumbbells in the mixture affects the flow dynamics, we have considered nine different fractions of dumbbells
 $X_{db}$ at each
 $W/d$. Figure 2 shows flow rate
 $Q$, area fraction
 $\phi$ and granular temperature
 $T_g$ as a function of
 $W/d$. Here
 $Q$ is observed to increase monotonically with
 $W/d$ for all
 $X_{db}$. Interestingly, at each
 $W/d$,
 $Q$ is observed to decrease with an increase in the fraction of dumbbells
 $X_{db}$. We tried to find whether the average orientation of dumbbells is almost zero with the horizontal in the flowing zone which might hinder the flow. Figure 3 shows the average orientation of dumbbells
 $\theta$ at different horizontal positions
 $x/D$ from the centre of the orifice
 $x,y=0$ and
 $\theta$ at various angular positions
 $\varPsi$ of the dumbbells with
 $x,y=0$ as the centre. Both plots show that the longer side of the dumbbells is almost vertically oriented
 $\theta \approx 90^{\circ }$ at the centre line of the silo,
 $x=0$ and
 $\varPsi =90^{\circ }$. As the position of the dumbbells shifts from the centreline,
 $\theta$ is observed to decrease, which can be seen in both the plots. These results show that the dumbbells do not orient horizontally in the flowing zone, suggesting that the orientation of dumbbells is not the reason behind the decrease in
 $Q$ with an increase in
 $X_{db}$. Börzsönyi et al. (Reference Börzsönyi, Somfai, Szabó, Wegner, Mier, Rose and Stannarius2016) observed that in a system of elongated particles, the longer side of the particles align to the flow and their average orientation makes small angles with streamlines. However, in our case, for
 $x/d>10$, there is no correlation in the orientation of dumbbells due to the stagnant zone where velocities of the particles are almost zero. The reason for the decrease in
 $Q$ with an increase in
 $X_{db}$ could be due to the interlocking of particles. Spheres or discs cannot interlock among themselves, but particles with higher aspect ratio are more prone to interlocking. An example of this is a robust ‘bird's nest’ created by interlocking feeble ‘twigs’ of high aspect ratios. In our case, dumbbells with an aspect ratio of two can interlock among themselves and hinder the flow. Moreover, dumbbells experience a much higher hindrance in their rotational degree of freedom, i.e. the spheres have their rotational freedom resisted by just the frictional forces as their rotation does not occupy any space. However, rotation of dumbbells entails the particles surrounding them to undergo complete rearrangement. There may be these two, namely, geometrical interlocking and hindrance to the rotation that may compete, or possibly one of the two may dominate in reducing the flow rate of the mixture with an increase in
 $X_{db}$. To validate whether the flow rate of the mixture decreases with an increase in the fraction of particles with a higher aspect ratio, we performed simulations with a mixture of discs and elongated particles with aspect ratio of four. The elongated particles (
 $AR = 4$) are generated by fusing four circles adjoining each other. Here, the mass and area of the elongated particles are taken the same as that of the discs, so that the diameter of each circle of the elongated particle (
 $AR=4$) is
 $d_{AR=4}=0.707$. The variation of flow rate
 $Q$ in figure 4 shows a decreasing trend with an increase in the fraction of elongated (
 $AR=4$), (
 $AR=2$) particles
 $X_{db}$ at
 $W/d=40$. This indicates that adding elongated particles to a system of discs decreases the flow rate of the mixture provided the particles are non-cohesive and their areas are equal.
(a) Flow rate  $Q$, (b) area fraction
 $\phi$ and (c) granular temperature
 $T_g$ as a function of normalised orifice width
 $W/d$ for different fractions of dumbbells
 $X_{db}$. Here,
 $d$ is the diameter of each of the circles in a dumbbell and
 $\rho$ is the particle density.

The mean orientation of dumbbells  $\theta$ with respect to (a) horizontal position
 $x$ at different heights and with respect to (b) angular position
 $\varPsi$ for different radii from the centre of the orifice. (c) The angular position
 $\varPsi$ and the mean orientation
 $\theta$ of the dumbbells is represented. The orientation of a dumbbell
 $\theta$ is computed as the angle between the larger axis of the dumbbell and horizontal axis
 $y=0$. The angular position
 $\varPsi$ is measured as the angle made by the line joining the centre of the orifice
 $x,y=0$ and centre of the dumbbell with horizontal axis
 $y=0$.

Flow rate  $Q$ as a function of the fraction of elongated particles
 $X_{db}$ at an orifice width of
 $W/d=40$ for a mixture of discs and elongated particles. Here
 $AR$ corresponds to aspect ratio of the elongated particle.

The area fraction  $\phi$ in region
 $A$ increases with
 $W/d$ for all
 $X_{db}$, as shown in figure 2(b). As orifice width increases, the flowing zone above the orifice increases and facilitates better rearrangement of the particles increasing the area fraction. However,
 $\phi$ decreases with an increase in
 $X_{db}$ at all
 $W/d$ because the void space formed inside a set of interconnected dumbbells is more than the void space formed inside a set of interconnected discs. Similar behaviour was observed previously (Ertaş et al. Reference Ertaş, Halsey, Levine and Mason2002) in a mixture of dimers and monomers. Granular temperature
 $T_g$ increases steadily with
 $W/d$ as shown in figure 2(c) due to an increase in the fluctuations of velocity components. This is due to an increase in the collision rates among the particles flowing from either side of the orifice resulting from an increase in the particle velocities with
 $W/d$. The increase in
 $V_x$ with
 $W/d$ is shown by an increase in the width of the probability distributions in figures 5(a), 5(b) and 5(c), which correspond to
 $W/d=15, 25$ and
 $35$. In figure 6,
 $V_y$ is observed to increase with an increase in
 $W/d$ in the form of first maxima, whereas the maxima at
 $V_y=0$ corresponds to those particles present on the silo base. Moreover, in each of the three plots of the
 $V_y$ distribution, the magnitude of first maxima decreases with an increase in
 $X_{db}$. Consequently,
 $T_g$ at all
 $W/d$ is noticed to decrease with an increase in
 $X_{db}$, as shown in figure 2(c).
Probability distribution (p.d.f.) of horizontal velocities  $V_x$ of particles in region
 $A$ at orifice widths
 $W/d$ = (a) 15, (b) 25 and (c) 35 for various fractions of dumbbells
 $X_{db}$.

Probability distribution of vertical velocities  $V_y$ of particles in region
 $A$ at orifice widths
 $W/d$ = (a) 15, (b) 25 and (c) 35 for various fractions of dumbbells
 $X_{db}$.

Figure 7 shows velocity profiles as a function of horizontal position in the region  $A$. Self-similar profiles were observed when the normalised horizontal
 $V_x/V_{x_{max}}$ and vertical velocities
 $V_y/V_{y_{max}}$ are plotted against normalised horizontal position
 $x/W$. In an earlier study (Zhou et al. Reference Zhou, Ruyer and Aussillous2015), similar trends of velocity profiles were observed in the case of binary mixtures of spherical particles of two different sizes. The maximum velocity
 $V_{max}$ in the region above the orifice increases gradually with
 $W/d$, as shown in figure 7(c). However,
 $V_{max}$ decreases with an increase in
 $X_{db}$ at all
 $W/d$ because the addition of dumbbells hinders the flow as dumbbells can interlock more effectively among themselves than with discs.
(a) Normalised horizontal velocity  $V_x$ and (b) normalised vertical velocity
 $V_y$ profiles as a function of normalised horizontal position
 $x/W$ at various widths
 $W/d$ of the orifice. (c) The maximum velocity
 $V_{max}$ as a function of orifice width
 $W/d$. The magnitudes of the parameters in these plots are time averaged and space averaged over region
 $A$ and they correspond to
 $X_{db}=0.5$. Similar trends were observed for all other
 $X_{db}$.

3.1.1. Mean flow fields
In this subsection, we will illustrate the spatial distributions of various parameters such as area fraction  $\phi$, angular velocity
 $\varOmega$ and its fluctuation
 $\varOmega ^2_{fl}$, granular temperature
 $T_g$, shear stress
 $\tau$, pressure
 $P$ and velocity
 $\boldsymbol {v}$. The parameters at various spatial locations are computed using the Gaussian coarse-graining function as implemented in Glasser & Goldhirsch (Reference Glasser and Goldhirsch2001). The aforementioned parameters are computed at any position
 $p$ with position vector
 $\boldsymbol {r_p}$ as follows:
 \begin{gather} \mathcal{W}(\boldsymbol{r})=\frac{1}{{\rm \pi} w^2}\textrm{e}^{-\boldsymbol{r}^2/w^2}, \end{gather}
 \begin{gather} \phi(t) = \left.\left[ \sum_{i=1}^{n} \frac{\rho {\rm \pi}d_i^2}{4} \mathcal{W}(\boldsymbol{r_p}-\boldsymbol{r_i(t)}) \right]\right/\rho, \end{gather}
 \begin{gather} \varOmega(t) = \left.\left[ \sum_{i=1}^{n} \frac{\rho {\rm \pi}d_i^2}{4} \varOmega_{z_i} \mathcal{W}(\boldsymbol{r_p}-\boldsymbol{r_i(t)}) \right]\right/\rho \phi, \end{gather}
 \begin{gather} \varOmega^2_{fl}(t) = \left.\left[ \sum_{i=1}^{n} \frac{\rho {\rm \pi}d_i^2}{4} (\varOmega_{z_i}-\varOmega)^2 \mathcal{W}(\boldsymbol{r_p}-\boldsymbol{r_i(t)}) \right]\right/\rho \phi, \end{gather}
 \begin{gather} \boldsymbol{v}(t) = \left.\left[\sum_{i=1}^{n} \frac{\rho {\rm \pi}d^2_i}{4} \boldsymbol{v_i} \mathcal{W}(\boldsymbol{r_p}-\boldsymbol{r_i(t)}) \right]\right/\rho \phi, \end{gather}
 \begin{gather} T_g(t) = \frac{\displaystyle \sum_{i=1}^{n} \dfrac{\rho {\rm \pi}d^2_i}{4}|\boldsymbol{v_i}-\boldsymbol{v}|^2 \mathcal{W}(\boldsymbol{r_p}-\boldsymbol{r_i(t)})}{2\rho \phi}, \end{gather}
 \begin{gather} \boldsymbol{\sigma_{ij}}(t)= \sum_{i=1}^{n}\sum_{j=i+1}^{n}(\boldsymbol{F^{ij}} \times r_{ij}) \int_{s=0}^{1} \mathcal{W}(\boldsymbol{r_p}-\boldsymbol{r_i(t)}+s\boldsymbol{r_{ij}})\,\textrm{d}s, \end{gather}
 \begin{gather} P(t) =\frac{-\textrm{tr}(\sigma_{ij}(t))}{2}. \end{gather}
Here,  $\phi (t)$,
 $\varOmega (t)$,
 $\varOmega ^2_{fl}(t)$,
 $\boldsymbol {v}(t)$,
 $T_g(t)$,
 $\boldsymbol {\sigma _{ij}}(t)$ and
 $P(t)$ corresponds to area fraction, rotational velocity, fluctuations in rotational velocity, velocity, granular temperature, stress tensor and pressure at time
 $t$. Whereas,
 $\phi$,
 $\varOmega$,
 $\varOmega ^2_{fl}$,
 $\boldsymbol {v}$,
 $T_g$,
 $\boldsymbol {\sigma _{ij}}$ and
 $P$ are the time-averaged values of the respective parameters over approximately 5000 frames. Here
 $\mathcal {W}(\boldsymbol {r})$ is the Gaussian coarse-graining function with
 $w=1.414$. The Gaussian coarse-graining function at any position
 $p$ is measured for all the particles
 $i=0$ to
 $n$ which satisfy
 $|\boldsymbol {r_p}-\boldsymbol {r_i}|<3w$, where
 $r_i$ is the position vector of
 $i$th particle. For each parameter, we have plotted flow fields corresponding to a different fraction of dumbbells
 $X_{db}$ starting from 0.0 to 1.0. For all cases, the distributions are plotted in the space range of
 $-40d < x < 40d$ and
 $1.414d < y < 148.414d$ as shown in figure 8 and the orifice width is
 $W/d=15$. Figure 9 shows the spatial distribution of area fraction
 $\phi$ at different
 $X_{db}$. Area fraction is less in the region above the orifice as compared with the bulk due to shear-induced dilation. Moreover, as
 $X_{db}$ increases,
 $\phi$ is observed to decrease in the bulk as well as in the region above the orifice. This can be explained by an increase in the void space formed inside a set of three or more particles with the addition of dumbbells. This is due to the longer side of the dumbbells, which results in larger void spaces when the particles are randomly packed. Similar behaviour has been observed by Börzsönyi et al. (Reference Börzsönyi, Somfai, Szabó, Wegner, Mier, Rose and Stannarius2016) where they found a strong dilation in the case of elongated particles as compared with that of spherical particles. The angular velocity
 $\varOmega$ as displayed in figure 10 is almost negligible in the bulk because the particles hardly rotate due to space constraints. However, small rotational velocities are observed near the orifice for all
 $X_{db}$ because of the availability of space due to shear-induced dilation as observed in figure 9. Interestingly, the addition of dumbbells has very little effect on the angular velocities of the particles near the orifice. Fluctuations in rotational velocities
 $\varOmega ^2_{fl}$ are almost negligible in the bulk for all
 $X_{db}$ as shown in figure 11. However, as
 $X_{db}$ increases,
 $\varOmega ^2_{fl}$ near the orifice decreases. To rotate, discs require less space around them than does a dumbbell. Thus discs can rotate easily, leading to higher fluctuations in rotational velocity than seen for dumbbells.
The region of interest for plotting flow fields is demonstrated. The shaded region corresponds to  $-40d < x < 40d$ and
 $1.414d < y < 148.414d$.

Spatial variation of area fraction  $\phi$ at
 $X_{db}$ = (a) 0.0, (b) 0.25, (c) 0.5, (d) 0.75 and (e) 1.0 and width of the orifice is
 $W/d=15$. The plots are averaged over approximately 5000 frames.

Spatial variation of rotational velocity  $\varOmega$ at
 $X_{db}$ = (a) 0.0, (b) 0.25, (c) 0.5, (d) 0.75 and (e) 1.0 and width of the orifice is
 $W/d=15$. The plots are averaged over approximately 5000 frames.

Spatial variation of fluctuations in rotational velocities  $\varOmega ^2_{fl}$ at
 $X_{db}$ = (a) 0.0, (b) 0.25, (c) 0.5, (d) 0.75 and (e) 1.0 and width of the orifice is
 $W/d=15$. The plots are averaged over approximately 5000 frames.

The velocity  $V$ fields are shown in figure 12. Velocities of the particles are lower and almost constant in the entire bulk for all
 $X_{db}$. Higher velocities of the particles are observed only above the orifice because the particle motion is less obstructed by the surrounding particles in this region than in the bulk. The regions of dark red beside the orifice correspond to the stagnant zone or dead zone where the particles remain stationary or move with negligible velocities. The stagnant zone is found to expand with an increase of
 $X_{db}$ due to the interlocking among the dumbbells. Thus, the flow pattern deviates from mass flow to semi-mass flow as
 $X_{db}$ increases from 0.0 to 1.0. In a previous study (Liu et al. Reference Liu, Zhou, Zou, Pinson and Yu2014), the size of the stagnant zone was found to increase with an increase in the aspect ratio of the particles. The stagnant zone beside the orifice hinders the movement of the particles flowing adjacent to it. This phenomenon coupled with geometrical interlocking, results in the decrease of the velocity with an increase in
 $X_{db}$ in the region above the orifice. Figure 13 demonstrates spatial distributions of granular temperature
 $T_g$. In the bulk,
 $T_g$ is almost negligible because the particle velocities are almost constant as noticed in figure 12. However, in the region above the orifice,
 $T_g$ decreases with an increase in
 $X_{db}$. With the addition of dumbbells, velocities of the particles approaching from either side of the orifice decrease, resulting in a decrease in the velocity fluctuations. Here
 $T_g$ is negligible in the region beside the orifice due to the presence of the stagnant zone. Moreover, the size of the stagnant zone where
 $T_g$ is negligible is found to increase with an increase in
 $X_{db}$, which is similar to that observed in figure 12.
Spatial variation of velocities  $V$ at
 $X_{db}$ = (a) 0.0, (b) 0.25, (c) 0.5, (d) 0.75 and (e) 1.0; the width of the orifice is
 $W/d=15$. The plots are averaged over approximately 5000 frames.

Spatial variation of granular temperature  $T_g$ at
 $X_{db}$ = (a) 0.0, (b) 0.25, (c) 0.5, (d) 0.75 and (e) 1.0; the width of the orifice is
 $W/d=15$. The plots are averaged over approximately 5000 frames.

Pressure fields  $P$ are demonstrated in figure 14. In the bulk,
 $P$ is observed to be higher near the sidewalls than in the centre because the particles near the walls experience more stress as force chains are supported by the sidewalls. Figure 15 displays the force chains where its strength is found to be more near the walls as compared with that in the centre. The pressure is least at the centre of the orifice because of a low area fraction resulting from shear-induced dilation, as observed in figure 9. In the region above the orifice,
 $P$ at the centre of the silo is found to increase gradually with an increase in the vertical distance from the orifice due to an increase in the area fraction and consequently an increase in the stress transmission. Similar behaviour has been observed previously (Rubio-Largo et al. Reference Rubio-Largo, Janda, Maza, Zuriguel and Hidalgo2015) for pressure fields near the orifice for a system of spherical particles. The pressure is found to be higher in the stagnant zone as compared with that of the flowing zone because of the presence of strong force chains supported by the sidewalls as well as the bottom wall. As
 $X_{db}$ increases, the strength of force chains is noticed to decrease leading to a decrease in
 $P$. Figure 16 illustrates shear stress fields
 $|\tau |$ at different
 $X_{db}$. At the centre of the silo, as it is the flowing zone, interparticle shear stress
 $|\tau |$ is observed to be very much less, which is similar to that observed in the flowing zone of liquids. However,
 $|\tau |$ increases close to the wall for all
 $X_{db}$. In the region beside the orifice,
 $|\tau |$ is noticed to be very much less due to the presence of a stagnant zone. As
 $X_{db}$ increases,
 $|\tau |$ is noticed to decrease because elongated particles hinder the movement of particles adjacent to them more effectively than that of the discs.
Spatial variation of pressure  $P$ at
 $X_{db}$ = (a) 0.0, (b) 0.25, (c) 0.5, (d) 0.75 and (e) 1.0; the width of the orifice is
 $W/d=15$. The plots are averaged over approximately 5000 frames.

Fore chains inside the silo at  $X_{db}$ = (a) 0.0, (b) 0.25, (c) 0.5, (d) 0.75 and (e) 1.0; the width of the orifice is
 $W/d=15$.

Spatial variation of shear stress  $|\tau |$ at
 $X_{db}$ = (a) 0.0, (b) 0.25, (c) 0.5, (d) 0.75 and (e) 1.0; the width of the orifice is
 $W/d=15$. The plots are averaged over approximately 5000 frames.

3.1.2. Mean flow fields in the presence of an obstacle
An obstacle placed at a proper position above the orifice has been proved (Zuriguel et al. Reference Zuriguel, Janda, Garcimartín, Lozano, Arévalo and Maza2011; Lozano et al. Reference Lozano, Janda, Garcimartín, Maza and Zuriguel2012a) to decrease the probability of clogging near the silo orifice. Zuriguel et al. (Reference Zuriguel, Janda, Garcimartín, Lozano, Arévalo and Maza2011) proposed that a decrease in pressure in the region above the orifice due to the presence of an obstacle as the reason for a decrease in clogging probability. However, Endo, Reddy & Katsuragi (Reference Endo, Reddy and Katsuragi2017) proposed that placing an obstacle results in less packing fractions in the region of arch formation which causes a decrease in clogging probability. In both cases, it is evident that obstacles can dramatically influence the flow dynamics inside a silo. In this subsection, we will explain how the presence of an obstacle affects the mean flow fields of the mixtures. For all cases, the orifice width is  $W/d=12$ and the obstacle of diameter
 $D_{obs}/d=24$ is placed with its centre at a height of
 $h_{obs}/d=27$ from the base of the silo. Figure 17 displays the spatial distributions of area fraction
 $\phi$ at different fractions of dumbbells
 $X_{db}$ in the presence of an obstacle. The obstacle forces those particles in its vicinity to detour around it to reach the orifice. It results in a wake formation downstream of the obstacle provided the particles are reaching the obstacle with high velocities, as is the case in Chehata, Zenit & Wassgren (Reference Chehata, Zenit and Wassgren2003). However, in our case, as velocities of the particles approaching the obstacle are less, the wake region is not evident for
 $X_{db}\le 0.5$. A small wake is observed for
 $X_{db}\ge 0.75$ despite the low velocities of the particles because dumbbells cannot move into the wake region due to their longer side. For the case of
 $X_{db}=1.0$, a region of dark purple just below the obstacle signifies the presence of wake. In the region above the orifice,
 $\phi$ is observed to be small because of the presence of an obstacle in the flowing zone. Similar behaviour was noticed in Endo et al. (Reference Endo, Reddy and Katsuragi2017) for the case of a system of spherical particles in a two-dimensional silo.
Spatial variation of area fraction  $\phi$ at
 $X_{db}$ = (a) 0.0, (b) 0.25, (c) 0.5, (d) 0.75 and (e) 1.0; the width of the orifice is
 $W/d=12$. The plots are averaged over approximately 5000 frames for a silo with an obstacle of diameter
 $D_{obs}/d=24$ placed at height
 $h_{obs}/d=27$.

The spatial distributions of the rotational velocities  $\varOmega$ are shown in figure 18. In the bulk,
 $\varOmega$ is almost negligible as the particles are closely packed. The areas of light cyan around the obstacle are due to the particles rolling over the obstacle. In the region above the orifice, rotational velocities of the particles are significant due to the availability of space to rotate. As
 $X_{db}$ increases, there is no significant variation in
 $\varOmega$. Figure 19 shows spatial variations in the fluctuations of rotational velocity
 $\varOmega ^2_{fl}$. In the region above the orifice,
 $\varOmega ^2_{fl}$ decreases with an increase in
 $X_{db}$ similar to that of the case without an obstacle. The velocity fields at different
 $X_{db}$ are displayed in figure 20. The velocity
 $V$ just above the obstacle is observed to be almost negligible, and it increases gradually in the region beside the obstacle. The flowing zone expands in the region beside the obstacle and covers almost the entire width of the silo as the particles traverse around the obstacle. This leads to a smaller stagnant zone beside the orifice as compared with that of the case without an obstacle. In the region above the orifice,
 $V$ is a maximum as compared with the other regions of the silo. However,
 $V$ is observed to be less as compared with that of the case without obstacles because of the hindrance to the flow due to the presence of an obstacle.
Spatial variation of rotational velocity  $\varOmega$ at
 $X_{db}$ = (a) 0.0, (b) 0.25, (c) 0.5, (d) 0.75 and (e) 1.0; the width of the orifice is
 $W/d=12$. The plots are averaged over approximately 5000 frames for a silo with an obstacle of diameter
 $D_{obs}/d=24$ placed at height
 $h_{obs}/d=27$.

Spatial variation of fluctuations in rotational velocities  $\varOmega ^2_{fl}$ at
 $X_{db}$ = (a) 0.0, (b) 0.25, (c) 0.5, (d) 0.75 and (e) 1.0; the width of the orifice is
 $W/d=12$. The plots are averaged over approximately 5000 frames for a silo with an obstacle of diameter
 $D_{obs}/d=24$ placed at height
 $h_{obs}/d=27$.

Spatial variation of velocities  $V$ at
 $X_{db}$ = (a) 0.0, (b) 0.25, (c) 0.5, (d) 0.75 and (e) 1.0; the width of the orifice is
 $W/d=12$. The plots are averaged over approximately 5000 frames for a silo with an obstacle of diameter
 $D_{obs}/d=24$ placed at height
 $h_{obs}/d=27$.

The spatial variations of granular temperature  $T_g$ are shown in figure 21. In the region above the obstacle,
 $T_g$ is negligible as the particles are closely packed and their velocities are almost constant. Here
 $T_g$ is significant in the region below the obstacle because the particles detouring from either side of the obstacle collide in this region and result in fluctuations of the velocities. As
 $X_{db}$ increases,
 $T_g$ varies slightly. The obstacle has a significant effect on the pressure
 $P$ fields as shown in figure 22. The particles lying just above the obstacle experience a higher
 $P$ as compared with that of the other regions of the silo. This can be explained by the presence of strong force chains supported by the obstacle as shown in figure 23. The zones of dark blue below the obstacle and extending up to the base of the silo indicate that of a low
 $P$. This is due to the absence of a strong contact network of force chains in those particles that are lying below the obstacle. The reduction of pressure in the region above the orifice due to the presence of an obstacle has been observed previously (Zuriguel et al. Reference Zuriguel, Janda, Garcimartín, Lozano, Arévalo and Maza2011) in the system of spherical particles. As
 $X_{db}$ increases, the magnitude of pressure decreases due to a decrease in the strength of the force chains as seen in figure 23. The spatial variations of shear stress at different
 $X_{db}$ are shown in figure 24. Upstream of the obstacle, a large
 $|\tau |$ is noticed on either side of it due to detouring of particles around the obstacle. Shear stress beside the obstacle is due to the flowing zone as observed in figure 20. However,
 $|\tau |$ is almost negligible beside the orifice due to the presence of a stagnant zone. The magnitude of
 $|\tau |$ decreases with an increase in
 $X_{db}$ because the addition of dumbbells leads to the hindrance of flow as dumbbells can interlock with the adjacent particles.
Spatial variation of granular temperature  $T_g$ at
 $X_{db}$ = (a) 0.0, (b) 0.25, (c) 0.5, (d) 0.75 and (e) 1.0; the width of the orifice is
 $W/d=12$. The plots are averaged over approximately 5000 frames for a silo with an obstacle of diameter
 $D_{obs}/d=24$ placed at height
 $h_{obs}/d=27$.

Spatial variation of pressure  $P$ at
 $X_{db}$ = (a) 0.0, (b) 0.25, (c) 0.5, (d) 0.75 and (e) 1.0; the width of the orifice is
 $W/d=12$. The plots are averaged over approximately 5000 frames for a silo with an obstacle of diameter
 $D_{obs}/d=24$ placed at height
 $h_{obs}/d=27$.

Fore chains inside the silo at  $X_{db}$ = (a) 0.0, (b) 0.25, (c) 0.5, (d) 0.75 and (e) 1.0 in the presence of an obstacle of diameter
 $D_{obs}/d=24$ placed at height
 $h_{obs}/d=27$. The width of the orifice is
 $W/d=12$.

Spatial variation of shear stress  $|\tau |$ at
 $X_{db}$ = (a) 0.0, (b) 0.25, (c) 0.5, (d) 0.75 and (e) 1.0; the width of the orifice is
 $W/d=12$. The plots are averaged over approximately 5000 frames for a silo with an obstacle of diameter
 $D_{obs}/d=24$ placed at height
 $h_{obs}/d=27$.

3.2. The flow of a mixture of discs and dumbbells in the interrupted-flow regime
The results explained in the previous sections pertain to large orifice widths  $W/d\ge 15$ where a free flow of particles is mostly observed. However, if the silos are operated at smaller
 $W$, the flow might get blocked due to the formation of self-stable structures at the orifice. This phenomenon is commonly termed as clogging. In this section, flow characteristics are investigated at narrow orifice widths
 $W/d\le 10$ where clogging of particles is mostly noticed. We have considered four different orifice widths
 $W/d$ ranging from 7 to 10. At each
 $W/d$, four mixture concentrations (
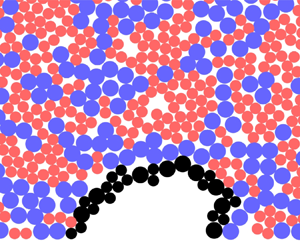
 $0.25 \le X_{db} \le 1.0$) are analysed. Figure 25 displays clogged states of the system at different
 $W/d$ where blue circles denote discs, red ones indicate dumbbells and black ones represent clogged particles. Figure 26 shows flow rate
 $Q$, area fraction
 $\phi$ and granular temperature
 $T_g$ with respect to orifice width
 $W/d$ at different
 $X_{db}$. The trends are qualitatively similar to those observed in a free-flow regime. As
 $X_{db}$ increases,
 $Q$ is observed to decrease at all
 $W/d$ because non-spherical particles present either in the flowing zone or in the stagnant zone provide more resistance to the flow than the discs, as non-spherical particles can interlock among themselves. The area fraction
 $\phi$ slightly increases with
 $W/d$, whereas it decreases with an increase in
 $X_{db}$ because of void spaces formed within a structure of particles increase with an increase in the number of dumbbells, due to the longer side of the dumbbells. This yields in a poor tessellation of elongated particles. The particles in the region above the orifice can rearrange more effectively when there is a large flowing zone. This is the reason for a slightly larger
 $\phi$ in the free-flow regime than that of the interrupted flow regime. Granular temperature
 $T_g$ increases gradually with
 $W/d$ for all
 $X_{db}$ because of an increase in the velocities of the colliding particles flowing from either side of the orifice resulting in more velocity fluctuations. The variation of average avalanche size
 $\langle s\rangle$ with
 $W/d$ is displayed in figure 27. Avalanche size
 $s$ is the number of particles discharged out of a silo before the system gets clogged. We have computed
 $\langle s\rangle$ by taking the average of a minimum of 100 avalanches
 $s$ for each case. Average avalanche size
 $\langle s\rangle$ increases gradually as a function of orifice width
 $W/d$ for all
 $X_{db}$. However,
 $\langle s\rangle$ decreases with an increase in
 $X_{db}$ due to geometrical interlocking of dumbbell particles. One of the main factors which determine the clogging and the subsequent unclogging due to external force is the stability of the arch. The stability of the arch mainly depends on its geometry, which is hardly explored (Garcimartín et al. Reference Garcimartín, Zuriguel, Pugnaloni and Janda2010). In the next section, arch geometry is analysed.
Representative arches of the clogged outlets for the fraction of dumbbells  $X_{db}$ = (a) 0.25, (b) 0.5, (c) 0.75 and (d) 1.0. Here, blue circles correspond to discs, red ones to dumbbells and black ones to clogged particles.

The variation in (a) flow rate  $Q$, (b) area fraction
 $\phi$ and (c) granular temperature
 $T_g$ as a function of orifice width
 $W/d$ for various fractions of dumbbells
 $X_{db}$. Here,
 $d$ is the diameter of each of the circles in a dumbbell and
 $\rho$ is the particle density.

The variation in average avalanche size  $\langle s\rangle$ with respect to orifice width
 $W/d$ for various fractions of dumbbells
 $X_{db}$.

3.2.1. Morphology of arches at the orifice
In this subsection, we will discuss the morphology of arches near the orifice by using different parameters such as the fraction of dumbbells  $X_{db}^{arch}$ and the number of particles
 $N_t$ in the arch, width
 $w$, height
 $h$ and perimeter
 $p$ of the arch. During a clogging event, the particles radially closest to the centre of the orifice are considered as particles belonging to an arch. The horizontal distance between the centres of two arch particles each lying on either side of the orifice on the silo base is the width of the arch
 $w$. The difference in
 $y$ position of an arch particle with a maximum
 $y$ value and the one lying on the base is the height of arch
 $h$. The perimeter of the arch
 $p$ is computed by calculating the distance between centres of the adjacent particles in the arch and summing them up. The value of each parameter is an average over a minimum of 100 clogged states. We have shown the variation of the fraction of dumbbells
 $X_{db}^{arch}$ and number of particles
 $N_t$ in an arch, the ratio of circular arclength to arch perimeter
 $c/p$ in figure 28. The fraction of dumbbells in the arch
 $X_{db}^{arch}$ is observed to be more than
 $X_{db}$ (black horizontal lines) at all
 $W/d$ and for all
 $X_{db}$ except for that of
 $X_{db}=1.0$. This indicates that elongated particles play a major role in the arch formation when a mixture of circular and elongated particles are considered. The number of particles in an arch
 $N_t$ increases gradually with
 $W/d$. However,
 $N_t$ is observed to increase even with an increase of
 $X_{db}$. This can be explained by the shear-induced alignment of dumbbells to the flow direction in the flowing part as observed in the past (Börzsönyi et al. Reference Börzsönyi, Somfai, Szabó, Wegner, Mier, Rose and Stannarius2016) which results in more particles in an arch. The deviation of arch shape from a semicircle is analysed using
 $c/p$. Here,
 $c$ is the length of the arc which passes through the centres of two arch particles on the silo base and the arch particle with the highest
 $y$, and
 $p$ denotes the perimeter of the arch. Figure 28(c) shows that
 $c/p$ is close to one for
 $X_{db}=0.25$ which indicates that the arch shape is close to a semicircle. Similar behaviour was observed for the case of spherical particles (
 $X_{db}=0.0$) in a two-dimensional silo, where Garcimartín et al. (Reference Garcimartín, Zuriguel, Pugnaloni and Janda2010) found that the arch shape is close to a semicircle. A semicircular arch is more stable due to an isotropic loading. As
 $X_{db}$ increases,
 $c/p$ is found to decrease suggesting a deviation from a semicircle shape or the presence of local concavities in the arch. Lozano et al. (Reference Lozano, Lumay, Zuriguel, Hidalgo and Garcimartín2012b) found that local concavities in an arch are the weakest portions in a system of spherical particles. However, if an arch involves non-spherical particles, whether the local concavities are the weakest portions of an arch is still an open question. Determining the stability of the arch based on the arch shape in a system involving non-spherical particles is still an unanswered question. Figure 29 displays width
 $W/d$, height
 $h/d$ and perimeter
 $p/d$ of an arch as a function of orifice width
 $W/d$. As
 $X_{db}$ increases,
 $W/d$ is noticed to vary slightly. However,
 $h/d$ and
 $p/d$ of the arch increases with
 $X_{db}$ at all
 $W/d$. This can be due to the coupled effect of an increase in the number of arch particles with an increase in
 $X_{db}$ and length of the longer side in the case of dumbbells
 $(2.0d)$ is more than that of a disc
 $(1.414d)$.
The variation in (a) fraction of dumbbells in arch  $X_{db}^{arch}$, (b) number of particles in arch
 $N_t$ and (c) the ratio of arclength to the perimeter of the arch
 $c/p$ as a function of orifice width. The symbols represent the same
 $X_{db}$ values as that of figure 27. The black horizontal lines represent
 $X_{db}=0.25,0.5,0.75$ and
 $1.0$ in the system.

The variation in the (a) width  $w$, (b) height
 $h$ and (c) perimeter
 $p$ of the arches as a function of orifice width
 $W/d$. The arch is formed by mutually stable clogged particles at the outlet.

4. Conclusion
In this work, we performed numerical simulations to study the heterogeneous mixtures of dumbbells and discs flowing out of a silo. We have analysed the flow characteristics for various fractions of dumbbells, as well as at different orifice widths, and found that the flow rate of the mixture decreases with an increase in  $X_{db}$. This could be due to the geometrical interlocking or hindrance to the rotation of dumbbells offered by the surrounding particles. In the flowing zone of the silo, we found that the longer side of the dumbbells is oriented along the flow even in the case of mixtures. Self-similar velocity profiles with horizontal positions are observed for all mixture concentrations. Mean flow fields are plotted for various parameters at different
 $X_{db}$. We noticed that as
 $X_{db}$ increases, there is a decrease in the area fraction in the region above the orifice. Rotational velocity is observed to remain constant with a variation in
 $X_{db}$ whereas fluctuations in rotational velocity decrease with an increase in
 $X_{db}$ in the region above the orifice. The stagnant zone was found to expand beside the orifice where the particle velocities are found to be almost negligible. The effect of the obstacle on mean flow fields is also studied. The obstacle has a dramatic effect on the pressure and shear stress flow fields where maximum pressure is observed upstream of the obstacle. This can be attributed to the strong network of force chains supported by the obstacle. Along with free-flow regime at large orifice widths
 $W/d\ge 15$, we studied the mixture flow at small orifice widths
 $W/d\le 10$ where the system might get clogged after a certain time. We analysed the arch geometry at different orifice widths and for various fractions of dumbbells. The number of particles in an arch is found to increase with
 $X_{db}$ because the elongated particles are mostly aligned to the flow direction in the region of the arch formation. A parameter
 $c/p$ is introduced which measures the deviation of the arch structure from a semicircle shape (
 $c/p=1.0$). As
 $X_{db}$ increases,
 $c/p$ is found to decrease indicating the presence of local concavities. In previous studies, local concavities were found to be the weakest portions of an arch in the case of spherical systems. However, whether the same definition works for an arch involving non-spherical particles hasn't been addressed yet. The weakest location of an arch is ideally the particle which experiences the least stress, however, determining it is a very tedious task. Moreover, evaluating the continuum model with
 $\mu (I)$ rheology on a mixture of spherical and non-spherical particles could be interesting future work.
Declaration of interests
The authors report no conflict of interest.



